MCAS is the Wrong Answer: Six Ways High-Stakes Testing Has Failed Students and What to Do Now - Citizens for Public Schools
←
→
Page content transcription
If your browser does not render page correctly, please read the page content below

MCAS is the Wrong Answer: Six Ways High-Stakes Testing Has Failed Students and What to Do Now
MCAS is the
      Wrong Answer:
 Six Ways High-Stakes Testing Has
Failed Students and What to Do Now

        CITIZENS FOR PUBLIC SCHOOLS
IV MCAS is the Wrong Answer: Six Ways High-Stakes Testing Has Failed Students and What to Do Now
MCAS is the
Wrong Answer:
Six Ways High-Stakes Testing Has
Failed Students and What to Do Now

Overview
Often described as “the grand bargain,” the Massachusetts                  In this report,
Education Reform Act of 1993 (MERA) committed to
                                                                      we seek to answer
substantially increase state financial contributions to public
education spending in exchange for increased state control.            the question: Has
New state authority included first-time state curriculum            MCAS furthered or
standards, a student assessment system that turned into a          hindered social and
single set of standardized tests, an accountability system for
rating schools and districts, and the birth of charter schools.
                                                                   racial justice in our
As touted in a Massachusetts Department of Elementary &                  public schools?
Secondary Education (DESE) 2014 report, this legislation “…
was the most dramatic change in generations in how the Commonwealth supported and
oversaw the delivery of education services by local school districts.”1

In the years since, state and federal officials have hailed Massachusetts’ system of student
testing and district/school accountability a success. They claim the Massachusetts
Comprehensive Assessment System (MCAS) moved Massachusetts’ (MA) public
education system from what state officials have termed “mediocrity” to the top of the
nation in scores on the National Assessment for Educational Progress (NAEP) math
and reading tests. Recently, the COVID-19 pandemic forced DESE to resort exclusively
to online education and cancel the 2020 spring administration of MCAS. It is unclear
whether pandemic conditions next year will force cancellation or modification of the 2021
spring MCAS administration.

Against this backdrop, twenty-seven years later, it is time to examine whether the claims
of MCAS success are true, with a particular emphasis on how underserved students have
fared under MCAS and MERA. After all, a major goal of MERA was to address the major
inequities in our state public school system. In this report, we seek to answer the question:
Has MCAS furthered or hindered social and racial justice in our public schools? To do so,
we draw upon a wide array of research studies and data sources.

                                                                     Citizens for Public Schools   1
1
MCAS measures a narrow range of academic
achievement, not the full scope of what we want
students to know and be able to do nor the full
scope of what makes a quality school.
Multiple studies have found that standardized tests, especially those with high stakes
for students and schools, narrow the curriculum and increase the amount of classroom
time focused on test preparation, memorization, and drills. These changes result in lost
instructional time and increased student stress.2 This is most likely to happen in schools
that serve high percentages of low-income, Black, Latinx, and English Learner (EL)
students, depriving them of access to a robust curriculum, instruction, and assessment.
Instead, too often students in these schools are subject to extra-long English and math
classes, focused on teacher-directed drills, to the exclusion of other subjects. They are
less likely to experience engaging project-based learning, the arts, and other electives
that provide students with a richer, more balanced education.3
Beginning with eight-year-olds in the third grade, MCAS measures only a narrow range
of knowledge that is best gained through memorization. In today’s global, diverse, and
technological world, high school graduates need knowledge and skills that cannot
be measured by a standardized test. Colleges seek students who have key cognitive
strategies (capacity to think, problem solve, and conduct research), learning skills
(ownership of learning, collaborative learning, strategic reading), and transition knowledge
and skills (self-advocacy, postsecondary aspirations).4 Likewise, greater than 90% of
surveyed employers cite ethical judgment and integrity, intercultural skills, collaboration,
communication, and capacity to learn as critical qualities that factor into hiring decisions.5
Furthermore, research has indicated that demand for social skills in the job market is
increasing at a faster rate than demand for STEM skills.6
Although MCAS scores have been shown to be related to post high school outcomes7,
these relationships are similar to or smaller than for high school grade point average (GPA).
For example, a study found that 10th grade English language arts and math MCAS scores
explained only 6% and 13%, respectively, of the total variability in first-year college students’
grades. The MCAS’s ability to predict college grades was no better than SAT scores.8
Moreover, multiple studies have shown that high school GPA is a stronger predictor of
college success than standardized test scores.9 Although one recent study found that
10th grade MCAS scores are related to future earnings10, a similar pattern has been shown
with high school GPA. A one-point increase in high school GPA has been found to be
related to a 12-14% increase in annual earnings for young adults.11 As noted by the Chicago
Consortium on School Research, “Grades are so important because they capture many of
the noncognitive aspects of students’ work habits that test scores miss, such as executive
functioning, academic perseverance, and growth mindset.”12 These “noncognitive aspects
2 MCAS is the Wrong Answer: Six Ways High-Stakes Testing Has Failed Students and What to Do Nowof students’ work habits” are the very qualities that colleges and businesses are seeking in
new enrollees and hires.
Finally, standardized tests cannot possibly measure the full range of indicators that make
for a quality school – school culture, community wellness, resources and opportunity to
learn, teachers and school leaders, family engagement, and academic learning. All these
factors contribute to student learning progress.
The public agrees. In a 2017 Phi Delta Kappan poll13, the extent to which schools help
students acquire interpersonal skills (such as cooperation, respect, problem solving) was a
far more important measure of school quality than how students perform on standardized
testing, which ranked dead last by a considerable amount:
CATEGORY EXTREMELY IMPORTANT NOT AT ALL/NOT
IMPORTANT SO IMPORTANT
Interpersonal skills 82% 12% 4%
Technology/Engineering courses 82% 15% 2%
Advanced academic courses 76% 19% 2%
Art and music courses 71% 23% 5%
Extracurricular activities 70% 25% 4%
Standardized Tests 42% 31% 24%
In the 2019 PDK poll14, 94% of teachers and 77% of parents said student progress over
time, as measured by report cards, is a better measure of school quality than the percent of
students who pass a standardized test. Despite this evidence, Massachusetts continues to
judge its schools primarily on MCAS tests, an inadequate measure of both student learning
and school quality.
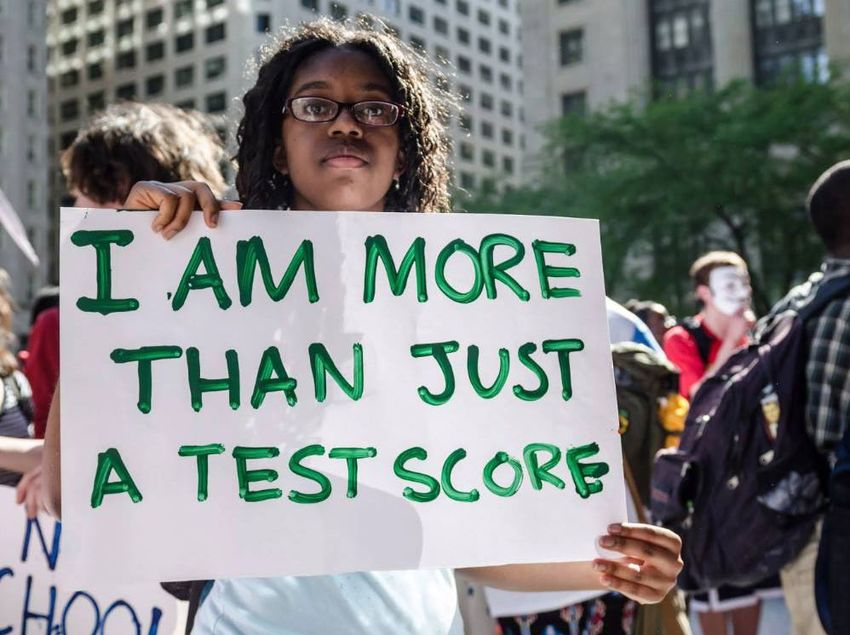
Ultimately, we should take to heart the words of Annelise Schantz, valedictorian of the
2000 graduating class at Hudson High School in Massachusetts, which ring true 20
years later:
So I’m the valedictorian. Number one. But, what separates me from number two, three,
four, five, six, 50, or 120? Nothing but meaningless numbers. All these randomly assigned
numbers reflect nothing about the true character of an individual. They say nothing about
desire or will. Nothing about values or morals. Nothing about intelligence. Nothing about
creativity. Nothing about heart. Numbers cannot and will not ever be able to tell you who
a person really is. Yet in today’s society we are sadly becoming more and more number
oriented. Schools today are being forced to teach to the numbers. The MCAS serves as
just another set of meaningless numbers that add one more reason to focus on scores
and forget learning. Judging us by our competency on a biased test is perhaps the big-
gest injustice that the state could ever inflict upon us.15
Citizens for Public Schools 32 Standardized tests are inherently biased against
the very students they purport to benefit.
As noted by In this time of widespread protests focused on eliminating
racist policies and institutions in our society, spurred by yet
renowned scholar another murder of a Black man by a White police officer, we
Ibram X. Kendi, must examine how institutional racism is embedded within
public education. Standardized testing, MCAS included,
“Standardized tests
is first in line. Few people know or acknowledge that
have become the standardized testing’s origins lie in the eugenics movement.
most effective racist This movement, begun in the late 1800s through the early
1900s, set the goal of designing so-called intelligence tests
weapon ever devised
to prove the existence of racial hierarchies, that White
to objectively people were genetically smarter than Black and Latinx
degrade Black minds people. Lewis Terman, in his 1916 book, The Measurement
of Intelligence, stated that standardized tests would reveal
and legally exclude “enormously significant racial differences in general
their bodies. intelligence, differences which cannot be wiped out by any
scheme of mental culture.”16
As reported by researcher Claude Steele, cultural bias and stereotype threat further
contribute to lowering the test scores of Black and Latinx students on standardized
tests.17 (Stereotype threat occurs when the negative stereotype associated with a group
[e.g., lack of intelligence] negatively affects a group member’s performance on a task,
such as a test.) Indeed, stereotype threat merely mirrors the reality that standardized
tests, including MCAS, reflect and reward the dominant culture. As recently as 2019, in
an MCAS essay question based on a passage from the Pulitzer-Prize winning novel The
Underground Railroad, students were required to write an essay from the perspective of a
White woman who uses derogatory language towards an escaped slave and is conflicted
about helping her.
There is a reason why MCAS has failed to meaningfully close race, language, and
income test score gaps over 27 years. As noted by renowned scholar Ibram X. Kendi,
“Standardized tests have become the most effective racist weapon ever devised to
objectively degrade Black minds and legally exclude their bodies.” He goes on to ask,
“What if we realized the best way to standardize a highly effective educational system is
not by standardizing our tests but by standardizing our schools to encourage intellectual
openness, [diversity], and difference?”18 In addition, the linguistic aspects of the MCAS
exams may unfairly disadvantage ELs. One study found that ELs answered some MCAS
science items incorrectly even when the EL students had the relevant knowledge to
answer the items correctly.19
4 MCAS is the Wrong Answer: Six Ways High-Stakes Testing Has Failed Students and What to Do NowStandardized tests are most closely correlated
with parental education and income. 3
Rather than an accurate predictor of student’s success in future life, standardized tests are
most closely correlated to a student’s parental education and income. The U.S. Department
of Education found that children with more highly educated parents have higher average
reading and math scores on national standardized tests than children with lesser educated
parents, leading to racial disparity in test scores, high school diplomas, and undergraduate
degrees.20
Unfortunately, the disparity between low-income and high-income earners has continued to
widen in this country. In Massachusetts, the gap is widening at a much faster pace than the
national average. In 2015, Massachusetts had the sixth largest gap in the nation between
the top 1% percent and bottom 99% family incomes.21 Therefore, it is not surprising that
there is a large standardized test score gap between families of different income levels.
Research has found that this widening income gap has little to do with school quality; rather,
the primary reason is the lack of opportunity and resources for low-income students. As
noted by researchers Knoester and Au, “Standardized tests are highly correlated with race
and class; higher test scores do not necessarily signal high-quality schools so much as
they signal schools that are situated in affluent, white communities. The spreading of this
misinformation about school quality exacerbates already alarming rates of school and
residential segregation.”22
In Massachusetts, contrary to public officials’ claim that our public education system was
mired in “mediocrity” prior to 2003, the state has always been close to the top of the
nation in National Assessment for Educational Progress (NAEP) scores. One reason why
Massachusetts has always scored well on NAEP tests is because our parents are among
the most educated and highest income of any state in the nation. In 2016, according to
Education Week’s 2019 Quality Counts report, Massachusetts had the 3rd highest percent
of children living in families with incomes at least 200% greater than the poverty level, and
the 4th highest percent of children living with at least one parent with a postsecondary
degree.23 On the flip side, according to the U.S. Department of Education, the state has
the 9th lowest percentage (13%) of children in families living in poverty.24 MA students
should be near or at the top on standardized tests.
Citizens for Public Schools 54
Massachusetts has made few academic gains
during the last 16 years under MCAS in the
aggregate and in particular with historically
underserved groups.
Using NAEP scores instead of MCAS scores to evaluate the academic progress of MA
students prevents two problems that could bias the evaluation of test results. Specifically,
scores on a state’s test might increase because instruction is narrowly focused on the
content in a state’s test or considerable time is devoted to developing test-taking skills
relevant to that state’s test. These causes of test score inflation are especially likely in a
state such as Massachusetts, where high stakes are attached to the results.25 In addition,
MA DESE’s evaluation of the technical properties of MCAS suggest the difficulty level of the
test might not have held constant over the years.26
One or more of the above factors might account for why MCAS scores have substantially
increased between 2003 and 2019, whereas MA’s NAEP scores have shown very little
improvement during that time period. A second advantage of using NAEP to evaluate
academic progress of Massachusetts’ students is that NAEP facilitates a 16-year
comparison between the performance of Massachusetts’ students and the performance
of students in all other states, including underserved student groups.
Since the earliest reporting of state-level NAEP results, even before the passage of MERA
in 1993, Massachusetts’ students have scored at statistically significant higher levels than
the average for participating states on 4th and 8th grade NAEP reading and math tests.
In addition, since 2003, MA’s NAEP scores have shown little improvement in comparison
to the national average. In 2003, the first year in which passing MCAS became a high
school graduation requirement, MA students on average scored 10.2 points higher than
the national average on the 4th and 8th grade reading and math NAEP tests. In 2019, this
advantage increased to only 10.9 points, a gain of less than one point. The only bright
spot for MA was 8th grade math, which increased by a modest 3.1 points relative to
national average during that 16-year time period.27
Furthermore, between 2003 and 2019, the large NAEP test score gaps (21 to 61 points)
among MA’s underserved students have shown little or no improvement. We examined 20
test score gaps: one gap for each of five underserved groups on each of the four NAEP
tests (4th grade and 8th grade reading and math). We found that since 2003, there have
been no statistically significant changes in the NAEP score gaps for MA Low-Income, Black,
or Latinx groups. Even the largest improvements were modest. The largest reduction in the
test score gap over 16 years was 5.5 points for Latinx students on the 4th grade reading
test. However, at that rate of progress, it would take another 78 years to eliminate the gap.
6 MCAS is the Wrong Answer: Six Ways High-Stakes Testing Has Failed Students and What to Do NowAlso noteworthy are growing gaps in NAEP scores for two underserved groups. MA ELs
experienced a statistically significant increase in the gap on the 8th grade math test of
15.6 points. In addition, between 2009 and 2019, score gaps for MA students in special
education became statistically significantly larger on all four tests.
We also conducted 20 comparisons between MA and the nation on the 2019 NAEP score
gaps of these student groups. MA had eight test score gaps that were statistically larger
than the national average. These larger score gaps were on all four NAEP tests (4th and 8th
grade reading and math) for both the Latinx and EL groups. The only MA score gap that was
significantly smaller than the national average in 2019 was for special education students
on the 4th grade test.
Massachusetts ELs NAEP
Score Gap: 8th Grade Math Test 2003-20019
320
310
300
290
280
270
260
250
240
230
220
2003 2005 2007 2009 2011 2013 2015 2017 2019
ELL NOT ELL
In summary, MA has made little or no progress on aggregate NAEP scores during the last
16 years when compared to national averages. Similarly, MA has not made progress in
closing NAEP score gaps among underserved student groups. During the last 16 years,
there have been no significant changes in the NAEP score gaps for MA Low-Income,
Black, or Latinx groups. However, score gaps have significantly increased for ELs and
students in special education. In 2019, MA had eight NAEP score gaps statistically larger
than the national average and only one smaller for underserved student groups.
Citizens for Public Schools 75
The demographic make-up of MA public school
students is rapidly diversifying. The fastest
growing groups include those students who are
most likely to be harmed by the state’s high-stakes
standardized testing accountability system.
In the 22 years since 1998, the two fastest growing student groups have been EL and
Latinx students, with the percent of students in these two groups more than doubling.28
According to Education Week’s 2019 Quality Counts report, our state now has the eighth
highest percent of parents who are not fluent in English.29 MA had the largest percent
increase of ELs in the nation between 2010 and 2017.30 The percent of Low-Income, Asian/
Pacific Islander, and Multi-Race students has also grown considerably, while the percent of
White students has fallen dramatically by 25%. Essentially, the state’s public school student
enrollment has become more economically disadvantaged and more racially diverse while
increasing its immigrant population. Excepting Asian/Pacific Islander students, these are
the very groups that have least benefited from MCAS and the state’s accountability system.
MA Public School Students
Demographic Changes 1998 – 2020
DEMOGRAPHIC GROUP 1998 (%) 2020 (%) % CHANGE
White 77.5 57.9 (25%)
Black 8.5 9.2 8%
Latinx 9.7 21.6 123%
Asian/Pacific Islander 4.1 7.2 76%
Multi-Race 3.4 4.1 21%
First Language Not English 12.6 23.0 83%
English Learner 4.8 10.8 125%
Low-Income 25.3 32.8 30%
Of the demographic groups listed above, the two fastest growing groups are also the two
most likely to fail the MCAS. Despite multiple attempts, 19.9% of EL and 8.6% of Latinx
students had not passed all three required MCAS exams by the end of their high school
senior year in 2019. Barely failing the high school MCAS by only one or two items can have
8 MCAS is the Wrong Answer: Six Ways High-Stakes Testing Has Failed Students and What to Do Nowlong-term serious consequences for historically marginalized MA’s graduation
students. Papay, Murnane and Willett found that low-income
gaps in the 2017-18
urban students who barely failed the high school MCAS math
exam on their first attempt were more likely to drop out and school year were
not graduate than those who barely passed.31 Furthermore, larger than the
in a subsequent study, these researchers found that students
national average for
who barely failed either the math or ELA high school MCAS
exam on their initial attempt were less likely to attend college both Latinx (18% gap
than those who barely passed the exam.32 These findings are in MA) and African-
consistent with studies of high-stakes tests in other states.
American students
High-stakes tests also can have other unintended negative (12% gap in MA).
consequences for underserved students.33 Kruger and
colleagues found that MA ELs who repeatedly failed the
high school MCAS reported that failing had adverse effects on their motivation, emotions,
career goals, and self-perceptions.34 Other research has found that high-stakes testing led
to African American students reporting increased apathy, more punitive discipline policies,
and lack of meaningful education.35
Although the high school graduation rates of MA students, including underserved
students, have improved during the last two decades36, MA’s graduation gaps in the
2017-18 school year were larger than the national average for both Latinx (18% gap in
MA) and African-American students (12% gap in MA).37 Furthermore, the MA high school
graduation rate for Latinx students is seven percent lower than the national average; for
MA African-Americans it is only one percent higher than the national average. Only nine
states had a lower high school graduation rate for Latinx students than MA.
Papay and colleagues also found large gaps in the college completion rate among
MA EL, African-American, Latinx, and low-income students when compared to other
students in MA. These college completion gaps existed even for students with identical
MCAS scores. Both the high school and college graduation gaps have widened
between ELs and non-ELs in MA over time.38
Citizens for Public Schools 96
Money matters, not high-stakes standardized
testing, particularly for students who are low-
income, of color, and ELs. Yet, MA has among
the widest gaps between lowest and highest
spending districts in the nation.
Money in public education does indeed matter, particularly for districts with high percentages
of low-income, Black, Latinx, and EL students. A Texas study found that schools with the
highest achievement for ELs spent considerably more per pupil than schools with the
lowest EL achievement.39 A second Texas study found that academic performance in low-
income districts that received more funds through the Texas Wealth Equalization Program
made modest improvements.40 Yet another study found that increased per pupil spending
is positively associated with improved student outcomes, particularly for low-income
students.41 All of these studies found that how money is spent matters too. Money has the
greatest positive impact when spent on instructional services for all students as well as on
teacher compensation.
As noted above, Massachusetts was close to the top of the NAEP standings before MERA
passed, most likely because of its relatively high levels of parent income and education
compared with other states. The state’s NAEP scores rose further during the first years of MERA
implementation than in later years, with the exception of eighth grade math. Those increases
coincided with the massive infusion of funding, especially to low-income communities. The
high-stakes MCAS graduation requirement took effect after those score increases. Except
for increases in 8th grade math, there has been little or no improvement in scores since then.
Yet, over the years, Massachusetts has fallen woefully short in holding up its end of the
“grand bargain,” while school districts have done their best to embrace standards-based
curriculum and instruction. According to the U.S. Digest of Education Statistics, in 1993,
the year MERA was passed by the legislature, the state ranked 45th out of 49 states in
the percent of state contribution to local public education spending (contributing 32.7% of
the state’s total public education spending as opposed to the national average of 45.6%).
Essentially, the state contributed among the smallest percent of any states of the total
amount needed to support the state’s public education system. While the state, due to
MERA, slowly increased its contributions to reach the middle of the pack of states by 2006
(25th), the lack of adjustment to the state’s Foundation Budget led to backtracking. By 2014,
MA was once again near the bottom of the rankings in its spending on public education. It
ranked 43rd (contributing 37.8% of the state’s total public education spending as opposed
to the national average of 47%).42
This failure of the state to adequately fund public education resulted in overreliance on local
property taxes to fund public education, the primary source of local community contributions
to public education. Given the wealth disparity by community in the state, since 2004 (earliest
10 MCAS is the Wrong Answer: Six Ways High-Stakes Testing Has Failed Students and What to Do Nowdata available) Massachusetts has ranked from 4th- 8th of states with the largest spending
gaps between the districts at the 5th percentile of spending and those at the 95th percentile.43
Consider the following district per pupil expenditures in FY 2019 as compared to the
district’s enrollment of EL, low-income, Black, and Latinx students:
% ENGLISH PER PUPIL
DISTRICT % LATINX % BLACK % LOW-INCOME
LEARNER EXPENDITURE
Chelsea 88 4 64 24 $16,162
Lowell 34 8 24 58 $14,862
Weston 6 7 5 3 $25,846
Wellesley 5 4 5 2 $21,016
Essentially, we still have a state education funding system in which more White, affluent
districts which serve students who need fewer resources spend substantially more per pupil
than districts with the highest percent of historically underserved students. Imagine the impact
on student learning progress and school quality if Lowell and Chelsea had approximately
$11,000 and $9,700 more per pupil, respectively, to equal Weston’s per pupil expenditures.
Massachusetts doesn’t have a so-called achievement gap; it has a very wide opportunity
to learn gap. The COVID-19 pandemic has further exacerbated the racial, economic, and
language opportunity to learn inequities that already exist in our state’s public education
system, created in large part due to the state’s systemic, inequitable funding system.
While some would argue that these data are offset by the fact that Massachusetts has one
of the highest per pupil spending averages in the nation (ranking from 5th- 9th among states
over the years), it is important to note that the state also has one of the highest costs of
living in the country. When adjusted for relative cost of living, Massachusetts ranks 16th in
per pupil spending, more towards the middle of the pack than the front.44
To summarize, Massachusetts has historically contributed to the inequities in public
education through its funding system, and it should be contributing more to public education
funding than it currently does. While the passage of the Student Opportunity Act in 2019
brings hope that Massachusetts will at the very least reach the national average of state
funding for public education relative to local funding, the recent pandemic raises concerns
about whether the legislature and governor will fulfill this commitment.
These findings call into question the state’s reliance upon a single high-stakes standardized
test. There are alternatives.
Massachusetts is one of only eleven states in the nation that doggedly hangs onto passing
statewide standardized tests as a requirement for high school graduation. Yet, there is little
evidence that this requirement has raised test scores, and research has found that high-
stakes exit exams have the largest negative impact on graduation rates of students of color
Citizens for Public Schools 11and ELs, particularly those from low-income homes. Most states have realized the harm
caused by high-stakes tests and abandoned them.
We hear from state officials that we need a high-stakes standardized test to hold schools
and districts accountable for educating all students. Yet there are viable alternatives to five-
year contracts worth $151 million to test-makers and countless millions more spent by local
districts on test preparation and administration. We need to refocus our state back on what
matters most – engaging students in meaningful learning that best prepares them for future
college, career, and civic life in a multicultural, global, and technological world. The state’s
current accountability system is outdated and needs a wholesale replacement.
Examples exist of what a different accountability system could look like. New Hampshire has
a federal waiver to enable a pilot set of districts to demonstrate student academic proficiency
and school progress through a set of common and local performance assessments. A
set of California districts, through the California Office to Reform Education (CORE), has
developed a School Quality Improvement System, representing “a holistic approach to
school improvement and accountability that focuses on academic preparedness, social-
emotional skills, the culture and climate of a school, collaborative learning … and supporting
effective instruction.” The New York Performance Standards Consortium, consisting of 38
high schools, has a long-standing waiver from the NY Department of Education to forego all
Regents graduation exams except for English language arts. These schools make student
competency determinations based on a Consortium-defined set of performance tasks in
English, math, science, and social studies.
Here in Massachusetts, another example is the Massachusetts Consortium for Innovative
Education Assessment (MCIEA). This consortium of eight school districts, representing
about 10% of the students in the state, recognizes that school quality and student learning
are too complex to be captured by any single test score. The consortium is pioneering an
assessment and accountability model that measures what our communities most value
and that prepares students with the skills, knowledge, and mindsets to achieve their varied
goals. MCIEA’s accountability system focuses on a School Quality Measures data dashboard
for every school. The dashboard includes multiple measures of student engagement,
student achievement, and school environment, and emphasizes teacher-generated, vetted
performance assessments as the primary means of assessing student learning. The goal is to
demonstrate that student learning and school progress can be measured in valid and reliable
ways that support meaningful student learning and community-wide school improvement.
With MCAS suspended this spring, teachers in Georgetown, MA, had a taste of the freedom
that could come if they were freed from the high-stakes MCAS. “I used to teach current
events every Friday as a science teacher, which I felt was time very well spent, but once
the MCAS [Massachusetts Comprehensive Assessment System] standards landed, it
became the overriding factor, and teachers had to make sure students were prepared for
that exam,” says Cerise Cauthron, science department chair of Georgetown Middle/High
School in Georgetown Public Schools. “The lockdown lifted an enormous weight off our
shoulders in a strange way by allowing us to go back to what we were doing before these
state standards and offer tailor-made activities for our students. It has been phenomenally
freeing in many ways.”
12 MCAS is the Wrong Answer: Six Ways High-Stakes Testing Has Failed Students and What to Do NowConclusion and Recommendations
During the last quarter century, Massachusetts school districts have worked diligently
to adapt to and embrace standards-based reform based on Massachusetts curriculum
standards. In 1993, the state made good on its initial promise to create a more equitable
state education funding formula, pressed by a state judicial system that had found the
state’s education funding system unconstitutional. However, the state once again slipped
in its financial commitment until community pressure forced the passage of the Student
Opportunity Act.
In the early years of MERA, increased funding contributed to raising Massachusetts from near
the top on NAEP scores to the top, except in eighth grade math. In later years of MCAS, NAEP
eighth grade math scores climbed to the top of the nation as well.
Unfortunately, MCAS and the state accountability system have made little if any progress
over 25 years in eliminating test score gaps by student groups. In particular, the gaps for EL
and Latinx students, the groups with the largest percentage growth in enrollment during this
period, have grown even larger, while the gaps for Black, low-income, and disabled students
have remained statistically the same. No student group has statistically closed the gap with
White students during the last 16 years of MCAS and the current accountability system.
The probable reasons for this failure are twofold: (1) the state’s failure to maintain an
adequate level of state funding, weighted toward districts serving the highest percentages
of low-income, Black, Latinx, and EL students, and (2) an outdated and punitive testing and
accountability system that has historical roots in racism and corporatization. The widely
accepted narrative about the positive role of a high-stakes standardized test is just plain
wrong. High stakes testing discriminates against and disadvantages underserved students.
This is both a social and racial justice issue. Our Black, Latinx, low-income, EL, and disabled
students suffer from a wide gap in opportunity to learn, exacerbated by a standardized test
accountability system.
The COVID pandemic crisis has only underscored and exacerbated inequities in students’
opportunity to learn. Research has indicated that online learning does not result in academic
outcomes commensurate with in-class instruction.45 As a result of school closures and
reliance on online learning, a recent study projected that most students will enter the fall
with only about two-thirds of the learning gains in reading made in the average school year,
and only half or less of the learning gains in math.46 The negative effects will likely be even
larger for EL, Black, Latinx, and low-income students because of inequities in access to
technology and the Internet.
Under these conditions, the large and longstanding test score and educational attainment
gaps for underserved students will likely increase. One mathematical model projects that
Citizens for Public Schools 13the COVID pandemic could result in test score gaps widening in the U.S. by 15-20%.47 In this
environment, it would be both punitive and counterproductive to continue to evaluate the
academic progress of underserved students and the schools they attend by means of a high-
stakes, standardized test. If appropriate action is not taken, the COVID crisis has the potential
to exacerbate the existing unintended negative effects of MCAS on our most underserved
students. Administering MCAS when we know that disparities are only going to get worse
will lead to renewed calls from the state for receivership and other punitive accountability
measures that take away local control, particularly in communities of color.
For these reasons, Citizens for Public Schools makes the following
recommendations for changing our state’s education accountability system:
Enact state legislation that provides for (a) a four-year moratorium on the high-stakes
MCAS graduation requirement and the use of MCAS for any purpose of evaluating
districts, schools, and educators, (b) a formal written request to the United States
Department of Education for a four-year waiver from state testing while new
alternatives are explored and established, (c) a commission, with participation
stipulated to ensure broad, diverse racial-ethnic, and community representation,
to explore and recommend to the legislature a next-generation state assessment
and accountability system, (d) a requirement for local districts to conduct annual
diagnostic testing, locally selected or derived, on students and report the results to
DESE, and (e) a state grant program for districts and consortia of districts to explore
and pilot new assessment and improvement systems.
Develop a new state education assessment and accountability system that embraces
a more complete, holistic set of indicators and weights for assessing school quality
and student learning that incorporates school culture, social and emotional wellness,
family engagement, student support, professional development, opportunity to
learn, and academic learning. Expand the definition of academic learning to include
habits of learning such as creativity, self-direction, communication, collaboration,
problem-solving, and evaluation in addition to content knowledge. Assess student
learning locally through multiple means, including curriculum-embedded, teacher-
generated performance assessments and student portfolios.
Limit state-level student assessment to diagnostic testing, removing any high-stakes
nature attached to the assessment. Return high school graduation determinations to
the local level where they belong. Doing so would enable matrix sampling student
assessment, similar to NAEP testing, in which the testing burden on students is
significantly reduced by having to only take a portion of the larger assessment.
Assess schools and districts on the basis of multiple measures of school quality
and student growth rather than absolute level of test scores, which reflect race
and class more than anything that happens in a student’s current school. Eliminate
ranking or leveling of schools and districts, which only serves to undermine schools
and districts serving high percentages of English Learner, low-income, Black, Latinx,
and disabled students.
14 MCAS is the Wrong Answer: Six Ways High-Stakes Testing Has Failed Students and What to Do NowEnsure full and timely funding of the Student Opportunity Act (SOA). We can’t let the
negative financial impact of the COVID pandemic lessen our commitment to a more
just and equitable state education finance formula.
Fund the MA Budget and Policy Center to track the impact of SOA education funding
to ensure that MA’s state percent of contributions to total state education spending
attains and maintains at minimum the national average, and the gap between the
highest and lowest spending districts lessens over time. Annual reports should be
submitted to the state legislature.
Use the money saved from the moratorium on MCAS testing to fund additional
support for underserved students who are at most risk for falling further behind
academically because of the COVID crisis.
Citizens for Public Schools 15Endnotes
1 Massachusetts Department of Elementary and Secondary Education (2014). Building on 20
years of education reform. Malden, MA. Retrieved from http://www.doe.mass.edu/commissioner/
BuildingOnReform.pdf, p. 2.
2 Amrein, A. L. & Berliner, D. C. (2002). High-stakes testing, uncertainty, and student learning. Edu-
cation Policy Analysis Archives, 10 (18). Retrieved on March 27, 2002 from http://epaa.asu.asu.edu/
epaa/v10n18;
3 Charlesworth, R.; Fleege, P.; & Weitman, C. (1994) Research on the effects of group standardized
testing on instruction, pupils, and teacher.s: New directions for policy. Early Education and Devel-
opment, 5:3, 195-212, DOI: 10.1207/s15566935eed0503_2
4 Conley, D. (2012). A complete definition of college and career readiness. Educational Policy Im-
provement Center. Downloaded at http://www.avid.org/dl/eve_natcon/nc12_four_keys_ hand-
out2.pdf.
5 Hart Research Associates (2013). It takes more than a major: employer priorities for college learn-
ing and student success. Washington, DC: Association of American Colleges and Universities.
Downloaded at https://www.aacu.org/sites/default/files/files/LEAP/2013_ EmployerSurvey.pdf.
6 Deming, D. (2017). The growing importance of social skills in the labor market. The Quarterly Jour-
nal of Economics, 132(4), 1593-1640.
7 Papay, J.P., Mantil, A., Murnane, R.J., An, L., Donohue, K., & McDonough, A. (2020). Lifting all boats?
Accomplishments and challenges from 20 years of education reform in Massachusetts. Provi-
dence, RI: Educational Opportunity in MA, Brown University. Retrieved from https://annenberg.
brown.edu/sites/default/files/LiftingAllBoats_FINAL.pdf
8 Nichols-Barrer, I., Place, K., Dillon, E., & Gill, B. (2016). Testing college readiness. Education Next, 16(3),
70-76.
9 Bowen, W.G., Chingos, M.M., & McPherson, M.S. (2009) Crossing the Finish Line: Completing Col-
lege at America’s Public Universities. Princeton, N.J.: Princeton University; Roderick, M., Nagaoka,
J., Allensworth, E., Coca, V., Correa, M., & Stoker, G. (2006) From high school to the future: A first
look at Chicago Public Schools graduates’ college enrollment, college preparation, and gradu-
ation from four-year colleges. Chicago, IL: University of Chicago Consortium on Chicago School
Research; Allensworth, E., & Clark, K. (2020). High school GPAs and ACT scores as predictors of
college completion: examining assumptions about consistency across high schools. Educational
Researcher, 49(3), 198-211.
10 Papay, J.P., Mantil, A., Murnane, R.J., An, L., Donohue, K., & McDonough, A. (2020). Lifting all
boats? Accomplishments and challenges from 20 years of education reform in Massachusetts.
Providence, RI: Educational Opportunity in MA, Brown University. Retrieved from https://annen-
berg.brown.edu/sites/default/files/LiftingAllBoats_FINAL.pdf
11 French, M., Homer, J., Popovici, I., & Robins, P. (2015). What you do in high school matters: High
school GPA, educational attainment, and labor market earnings as a young adult. Eastern Econom-
ic Journal, 41(3), 370-386.
12 Easton, J.; Johnson, E.; & Sartain, L. (2017) The predictive power of ninth grade GPA. University of
Chicago Consortium on School Research, Chicago, IL.
13 PDK International. (2017) The 49th annual PDK poll of the public’s attitudes toward the public
schools. Retrieved from https://pdkpoll.org/timeline/2017/.
16 MCAS is the Wrong Answer: Six Ways High-Stakes Testing Has Failed Students and What to Do Now14 PDK International. (2019) PDK poll of the public’s attitudes toward the public schools. Retrieved
from https://pdkpoll.org/.
15 Schantz, A. (2004). Valedictorian speech at the Hudson, MA High School graduation ceremony
(untitled, unpublished).
16 Kendi, I. (2016) Why the academic achievement gap is a racist idea. Black Perspectives. African
American Intellectual History Society.
17 Steele, C. (1999). Thin ice: “Stereotype threat” and black college students. The Atlantic Monthly,
Vol. 284, No. 2, pp. 44-54.
18 Kendi, I. (2016) Why the academic achievement gap is a racist idea. Black Perspectives. African
American Intellectual History Society.
19 Noble, T., Rosebery, A., Suarez, C., Warren, B., & O’Connor, M. C. (2014). Science assessments and
English language learners: Validity evidence based on response processes. Applied Measure-
ment in Education, 27(4), 248–260. doi:10.1080/08957347.2014.944309
20 National Center for Education Statistics (2010) The Condition of Education 2010. United States
Department of Education, retrieved from https://nces.ed.gov/pubs2010/2010028.pdf.
21 Sommeiller, E., & Price, M. (2018). The new gilded age income inequality in the U.S. by state,
metropolitan area, and country. Economic Policy Institute. Retrieved from https://www.epi.
org/publication/the-new-gilded-age-income-inequalityin- the-u-s-by-state-metropolitan-area-
and-county.
22 Knoester, M. & Au, W. (2015) Standardized testing and school segregation: Like tinderfor fire?
Race, Ethnicity, & Education. DOI: 10.1080/13613324.2015.1121474
23 Education Week (20019), Quality Counts. Retrieved from https://secure.edweek.org/media/qc-
2019-grading-summary-resource-pdf.pdf.
24 National Center for Education Statistics (2020). The condition of education: English language
learners in public schools. Retrieved from https://nces.ed.gov/programs/coe/indicator_cgf.asp
25 Koretz, D. 2005. Alignment, High Stakes, and the Inflation of Test Scores. CSE Report 655. Re-
trieved from https://files.eric.ed.gov/fulltext/ED488711.pdf
26 Massachusetts Department of Elementary and Secondary Education. (2014). 2014 MCAS and
MCAS-Alt technical report. Retrieved from http://www.mcasservicecenter.com/documents/MA
27 National Assessment of Educational Progress. Data retrieved from https://www.nationsreportcard.
gov/ndecore/xplore/NDE
28 Massachusetts Department of Elementary and Secondary Education (2020). Retrieved from http://
profiles.doe.mass.edu/.
29 Education Week (20019), Quality Counts. Retrieved from https://secure.edweek.org/media/qc-
2019-grading-summary-resource-pdf.pdf.
30 National Center for Education Statistics (2020). The condition of education: English language
learners in public schools. Retrieved from https://nces.ed.gov/programs/coe/indicator_cgf.asp
31 Papay, J. P., Murnane, R. J., & Willett, J. B. (2010). The consequences of high school exit examina-
tions for low-performing urban students: Evidence from Massachusetts. Educational Evaluation
and Policy Analysis, 32(1), 5–23.
32 Papay, J. P. Murnane, R. J. & Willett, J. B. (2014) High-School Exit Examinations and the Schooling
Decisions of Teenagers: Evidence From Regression-Discontinuity Approaches, Journal of Re-
search on Educational Effectiveness, 7:1, 1-27, DOI: 10.1080/19345747.2013.819398
Citizens for Public Schools 1733 Holme, J. Richards, M. Jimerson, J. & Cohen, R. (2010) Assessing the effects of high
school exit examinations. Review of Educational Research, 80 (4), pp. 476–526. DOI:
10.3102/0034654310383147.
34 Kruger, L. J., Li, C., Kimble, E., Ruah, R., Stoianov, D. & Krishnan, K. (2016). Impact of repeatedly fail-
ing a high school exit exam: Voices of English Language Learners. Urban Review, 48 (3) 463-483.
35 Thompson, G. & Allen, T. (2012) The effects of the high stakes testing movement on African Ameri-
can K-12 students, The Journal of Negro Education, 81(3), pp. 218-227.
36 Papay, J.P., Mantil, A., Murnane, R.J., An, L., Donohue, K., & McDonough, A. (2020). Lifting all boats?
Accomplishments and challenges from 20 years of education reform in Massachusetts. Provi-
dence, RI: Educational Opportunity in MA, Brown University. Retrieved from https://annenberg.
brown.edu/sites/default/files/LiftingAllBoats_FINAL.pdf
37 National Center for Education Statistics (2020). Public High School Graduation Rates. https://nces.
ed.gov/programs/coe/pdf/coe_coi.pdf
38 Papay, J.P., Mantil, A., Murnane, R.J., An, L., Donohue, K., & McDonough, A. (2020). Lifting all
boats? Accomplishments and challenges from 20 years of education reform in Massachusetts.
Providence, RI: Educational Opportunity in MA, Brown University. Retrieved from https://annen-
berg.brown.edu/sites/default/files/LiftingAllBoats_FINAL.pdf
39 Jiménez-Castellanos, O. & García, D. (2017) School expenditures and academic achievement dif-
ferences between high-ELL-performing and low-ELL-performing high schools, Bilingual Research
Journal, 40:3, 318-330, DOI: 10.1080/15235882.2017.1342717
40 Tajalli, H. (2019) The impact of Texas “wealth equalization” program on the academic perfor-
mance of poor and wealthy schools, The Urban Review 51:404–423 https://doi.org/10.1007/
s11256-018-0490-9
41 Baker, B. (2016) Does money matter in education? Second Edition, Albert Shanker Institute.
42 National Center for Education Statistics (1995-2018) Digest for Education Statistics. Institute of
Education Sciences, U.S. Department of Education. Retrieved from https://nces.ed.gov/programs/
digest/.
43 Education Week (2001-2018), Quality Counts. Retrieved from https://www.edweek.org/ew/qc/in-
dex.html.
44 Edbuild. (2020) Power In Numbers, Cost-Adjusted Revenue 2020, retrieved from http://viz.ed-
build.org/maps/2016/cola/states/#state-table.
45 Ahn, J. & McEachin, A. (2017). student enrollment patterns and achievement in Ohio’s online
charter schools. Educational Researcher, 46(1), 44–57.
46 Kuhfeld, M., Soland, J. Tarasawa, B. Johnson, A. Ruzek, E. & Liu, J. (2020). Projecting the potential
impacts of COVID -19 school closures on academic achievement. (EdWorkingPaper: 20-226).
Retrieved from Annenberg Institute at Brown University: https://doi.org/10.26300/cdrv-yw05
47 Dorn, E., Hancock, B., Sarakatsannis, J. & Viruleg, E. (2020). COVID-19 and student learning in
the United States: The hurt could last a lifetime. McKinsey and Co. Retrieved from https://www.
mckinsey.com/industries/public-sector/our-insights/covid-19-and-student-learning-in-the-united-
states-the-hurt-could-last-a-lifetime
18 MCAS is the Wrong Answer: Six Ways High-Stakes Testing Has Failed Students and What to Do Now11 Beacon Street, Suite 722
Boston, MA 02108
617-227-3000 Ext. 17
www.citizensforpublicschools.orgYou can also read