Measurement of Innovation Efficiency in China's Electronics and Communication Equipment Manufacturing Industry-Based on Dynamic Network SBM Model
←
→
Page content transcription
If your browser does not render page correctly, please read the page content below
sustainability

Article
Measurement of Innovation Efficiency in China’s Electronics
and Communication Equipment Manufacturing Industry-Based
on Dynamic Network SBM Model
Jinfa Li, Ruijie Qin and Hongbing Jiang *

                                          School of Management Engineering, Zhengzhou University, Zhengzhou 450001, China; lijinfa@zzu.edu.cn (J.L.);
                                          qinruijie1998@163.com (R.Q.)
                                          * Correspondence: jhbymx@foxmail.com

                                          Abstract: In recent years, China’s electronics and communication equipment manufacturing (ECEM)
                                          industry has overgrown, and the government should assess the innovation performance of the
                                          industry for its sustainable development. However, most previous studies on the innovation efficiency
                                          of the ECEM industry have ignored the link and carry-over variables. This paper uses the number
                                          of patent applications as a link variable to consider the stage of innovation activities. It divides
                                          the innovation activities of the electronics industry into two stages: technology development and
                                          results in transformation. To consider the dynamics of innovation activities, this paper uses capital
                                          stock as a period carry-over variable and evaluates the change of innovation efficiency over time. In
                                          this paper, the DNSBM model is used to measure the innovation efficiency of the ECEM industry
                                          in 26 Chinese provinces from 2013–2019. This model includes both stage link variables and period
                                          carry-over variables, thus allowing for overall efficiency and stage efficiency and period efficiency.
                                          The results show that the overall innovation efficiency values in the Chinese ECEM industry are low,

                                   there are considerable differences between the two-stage efficiency values in the east, central and
Citation: Li, J.; Qin, R.; Jiang, H.      western regions, and the overall efficiency values show a slow upward trend.
Measurement of Innovation
Efficiency in China’s Electronics and     Keywords: electronic and communications equipment manufacturing; innovation efficiency;
Communication Equipment                   DNSBM model
Manufacturing Industry-Based on
Dynamic Network SBM Model.
Sustainability 2022, 14, 1227.
https://doi.org/10.3390/su14031227        1. Introduction
Academic Editor: Michele Grimaldi              In recent years, with the development of globalization, China’s economy has made
                                          remarkable progress. China’s economy ranks second in the world. Still, the innovation
Received: 3 December 2021
                                          level of China’s manufacturing industry is relatively backward, which is not conducive
Accepted: 19 January 2022
                                          to the sustainable and healthy development of the economy [1]. To improve the innova-
Published: 21 January 2022
                                          tion efficiency of China’s manufacturing industry, the government has also introduced a
Publisher’s Note: MDPI stays neutral      series of policies. Made in China 2025 points out that China should enhance the ability
with regard to jurisdictional claims in   of independent innovation and realize the high-quality development of manufacturing
published maps and institutional affil-   industry, which should ensure both the speed of manufacturing development and the
iations.                                  quality of development. The high quality development of manufacturing industry can not
                                          only promote the development of economy, but also promote the sustainable development
                                          of society.
                                               As a representative of the advanced manufacturing industry, the ECEM industry has
Copyright: © 2022 by the authors.
                                          become an important symbol of the country’s informatization level [2]. In China’s economic
Licensee MDPI, Basel, Switzerland.
                                          development from factor-driven to innovation-driven, the innovation efficiency of this
This article is an open access article
distributed under the terms and
                                          industry, as technology and knowledge-intensive sector, will affect the overall innovation
conditions of the Creative Commons
                                          capacity of the manufacturing industry, which will affect the development of China’s
Attribution (CC BY) license (https://     economy. However, this industry still has many problems: the issue of “large but not
creativecommons.org/licenses/by/          strong” remains prominent, with few independent, innovative products and technologies,
4.0/).                                    and the core technology is restricted and heavily dependent on imports. Relevant data

Sustainability 2022, 14, 1227. https://doi.org/10.3390/su14031227                                     https://www.mdpi.com/journal/sustainability
Sustainability 2022, 14, 1227                                                                                            2 of 18

                                show that China’s ECEM industry has more than 60% foreign technology dependence. On
                                the other hand, China’s ECEM industry is in the middle and low end of the industrial chain,
                                and the products are mainly exported for processing. Engaging in simple work also means
                                that compared with developed countries, the profits of Chinese electronics enterprises are
                                lower. At the same time, along with the increase in China’s labor costs, the ECEM industry
                                profits face shrinkage, seeking the road to industrial upgrading has also become one of
                                the significant challenges facing the government and enterprises. To achieve sustainable
                                development, promoting the industry’s innovation is necessary.
                                      The innovation efficiency of the ECEM industry needs to be improved, so what do we
                                need to do? Relevant studies have shown that scientific assessment of innovation efficiency
                                is of great significance to the improvement of independent innovation capability [3–5]:
                                a scientific assessment of innovation efficiency is helpful for policymakers to correctly un-
                                derstand the current level of innovation so that they can target policies based on innovation
                                efficiency to promote the improvement of innovation capability. Therefore, the current
                                innovation level should be reasonably evaluated first to encourage innovation development.
                                Hence, it is crucial to select objective and fair indicators to assess the innovation efficiency
                                of the ECEM industry.
                                      There are two shortcomings in previous studies on innovation efficiency in the ECEM
                                industry: researchers have mainly considered the innovation process as a whole, based
                                on which an overall innovation efficiency value is obtained. However, according to the
                                innovation value chain theory [6], the innovation process is a multi-stage process that
                                includes idea generation and transformation. In the actual innovation process, innovation
                                activities are formed by two stages: science and technology research and development and
                                transformation of results. The science and technology research stage includes research and
                                development activities mainly carried out by the cooperation of schools, enterprises, and
                                R&D institutions. The transformation stage mainly refers to transforming scientific and
                                technological achievements into economic benefits, and enterprises mainly do this stage.
                                These two phases are not completely separated either. Intermediate products connect them.
                                For example, for innovation activities in the ECEM industry, the output of the research
                                phase of science and technology (e.g., the number of patent applications) can be used
                                to input the transformation phase. Therefore, it is inappropriate to ignore intermediate
                                products’ influence and analyze innovation efficiency by considering innovation activities
                                as a black box. Another shortcoming is that most of the current studies on e-innovation
                                efficiency have focused on static efficiency values at a specific time (e.g., 10 years). The
                                efficiency values measured in this way are measured separately in each period. However,
                                in actual innovation investment activities, innovation activities in one period are not
                                entirely independent from the next period; there is an interdependence between innovation
                                activities in adjacent periods [7]. Period carry-over variables connect this dependence. For
                                innovation activities in the ECEM industry, capital is cumulative in nature. The capital
                                stock of the previous year’s R&D phase can be the source of the next year’s R&D capital,
                                which is a carry-over variable. Therefore, it is not appropriate to ignore the effect of capital
                                stock to study the innovation efficiency of the ECEM industry.
                                      Based on the above analysis, the main research question of this paper is: What is the
                                overall innovation efficiency of the current Chinese ECEM industry after considering inter-
                                mediate link variables and period carry-over variables? What is the innovation efficiency
                                of each stage? How does the innovation efficiency change over time? To address these
                                questions, this paper measures the overall innovation efficiency, the innovation efficiency of
                                each stage, and the innovation efficiency of the period in the ECEM industry using the dy-
                                namic network SBM model to have a more accurate assessment of the innovation capability
                                of the ECEM industry. The contribution of this study lies in the following aspects. First,
                                this paper finds not only the overall efficiency, but also the divisional efficiency and period
                                efficiency on this basis; second, previous studies mostly use the traditional DEA model and
                                SBM model, this paper compares the efficiency gap between the DNSBM model and the
                                SBM model and analyzes the reasons; third, no previous studies on the ECEM industry
Sustainability 2022, 14, 1227 3 of 18
have used the DNSBM model, and previous studies often ignore the link and carry-over
variables. In this paper, we consider both link and carry-over variables and calculate the
efficiency loss values to provide a reference for measuring efficiency values. The rest of this
paper is organized as follows. The second section presents the related literature review. The
third section introduces the SBM model and the dynamic network SBM model. The fourth
section presents the index selection, calculation results, and analysis results. Conclusions
and recommendations are given in the Section 5.
2. Literature Review
2.1. The Measurement of Innovation Efficiency
Innovation efficiency is an essential indicator of innovation capability, which has
attracted much attention from scholars in recent years [8,9]. Innovation efficiency refers
explicitly to the relative ability of the evaluated unit to achieve innovation output with a
given innovation input. By combing through the relevant literature, it can be found that
the current research on innovation efficiency is mainly focused on two aspects: regional
and high technology industries. Among them, the research on regional efficiency studies
the level of efficiency among various regions explicitly, and on this basis, the reasons for
the differences in efficiency values are studied [10].
In the studies of innovation efficiency of high-tech industries, it is easy to find that
most of the existing studies focus on the innovation efficiency of high-tech industries as a
whole, but few analyze the sub-industries. Li et al. [11] proposes a new framework based
on the combination of the dynamic DEA to study the innovation efficiency of China’s
high-tech industries, and the results show that the eastern region leads and the central
and western regions are relatively lagging behind. In recent years, Haschka et al. used
the Bayesian stochastic frontier approach to measure the innovation efficiency values of
European high-tech industries [12]. Chen et al. [13] used the DEA method to measure the
innovation efficiency of Chinese high-tech industries. The results showed that the inno-
vation efficiency of high-tech industries was low. All of the above studies take high-tech
industries as the research object, and the suggestions made are directed to high-tech indus-
tries as a whole. The high-tech industries include five industries: aerospace and aircraft
manufacturing, the ECEM, electronic computer and office equipment manufacturing, phar-
maceutical manufacturing, and medical equipment and instrumentation manufacturing.
These industries develop at different rates and have other characteristics, so studying their
innovation efficiency and taking targeted measures is necessary. Hong et al. [14] used the
stochastic frontier model to analyze the impact of government grants on the innovation
efficiency of high-tech industries. They found differences in the impact of government
grants on their five different sub-industries. Wang et al. [15] constructed a two-stage DEA
to study the innovation efficiency of high-tech industries and compared the efficiency of
their sub-industries. The results showed that the difference in innovation efficiency of the
five sub-industries was obvious. The ECEM industry occupies an important position in
the high-tech industry: the primary business income and total profit in 2019 accounted for
63% and 50% of the corresponding indicators of the whole high-tech industry, respectively.
Therefore, for the characteristics of the electronics industry, selecting a suitable index system
to study its innovation efficiency can help improve the overall innovation capacity of the
high-tech industry and thus promote the development of the economy.
In previous studies on innovation efficiency measurement, most scholars focused on
high-tech industries as a whole, and fewer studies were conducted for the ECEM industry.
Among the published studies on the innovation efficiency of the electronics industry, most
of the findings indicate that the innovation efficiency of China’s ECEM industry is generally
low, and the efficiency values vary significantly among regions. In addition, most of the
past studies treat the innovation process of the electronics industry as a whole and measure
its innovation efficiency from a static perspective. This is not in line with the stage and
dynamic characteristics of innovation activities; therefore, it is necessary to select a suitable
method to assess the innovation efficiency of the ECEM industry.Sustainability 2022, 14, 1227 4 of 18
2.2. Research on Innovation Efficiency Methods
The main methods used to measure the efficiency of innovations containing mul-
tiple variables are Stochastic Frontier Analysis (SFA) and Data Envelopment Analysis
(DEA) [16,17]. The SFA method is a parametric method that can only deal with multiple
inputs and single outputs. It needs to set the production function in advance, and if it is
not set correctly, it will lead to inaccurate calculation results [18]. On the other hand, the
DEA method can simultaneously handle multiple inputs and outputs. It does not need to
set the production function in advance and does not need to select the indicator weights
subjectively, thus avoiding the influence of human factors on the results [19–22]. Given
the above advantages of the DEA method and the fact that the index system containing
multiple inputs and multiple outputs is selected in this paper, the DEA method is chosen
to study the innovation efficiency of the ECEM industry.
Among the studies that have used the DEA approach to measure innovation efficiency,
there are mainly divided into single-stage and multi-stage approaches. When using the
single-stage system, early scholars considered the innovation process as a whole and used
the traditional DEA method to measure innovation efficiency. The conventional DEA
methods include the CCR (Charnes, Cooper, and Rhodes) model and the BCC (Banker,
Charnes, and Cooper) model, radial models that consider the input-output variables
equally proportional fail to take slack variables into account. In addition, ignoring the
slack variables is not realistic and can cause bias in the measurement results, affecting
the decision unit’s evaluation [23]. To solve this problem, Tone K [24] proposed a slack
variable-based DEA model (SBM model), which considers the effects of input-output slack
variables and is superior to the traditional DEA model. Then the SBM model was widely
used to measure innovation efficiency. For example, Li and Zeng [25] used the SBM model
and Tobit model to analyze the green innovation of 21 intensive pollution industries’ sub-
sectors in China, and the results showed that there were significant disparities between
industries and most of them did not reach DEA validity. Liu et al. [10] used the SBM model
to measure the innovation efficiency of Chinese science and technology enterprises. They
concluded that the overall innovation efficiency of enterprises was a low conclusion. The
above case of considering the innovation process as a whole ignores the internal activities
of the innovation system. In contrast, according to the innovation value chain theory
proposed by Hansen and Birkinshaw [6], the innovation activities include two stages of
science and technology R&D and result in transformation. Therefore, it is necessary to
measure innovation efficiency in stages. This helps assess the innovation transformation
capability at each stage so that targeted measures can be taken.
To measure the efficiency values of each stage, Färe and Grosskopf [26] proposed a
network DEA model (NDEA) based on single-stage DEA by considering the link variables
between stages in the computational equation. The NDEA model captures the efficiency
values of the decision unit as a whole and the efficiency values of each stage. Based on this,
Tone and Tsutsui [27] considered the slack values of inputs, outputs, and link variables,
and they proposed a slacks-based measure called network SBM (NSBM). In this way, the
efficiency values of each stage can be evaluated, but the different proportional changes of
the variables are considered, which makes it more realistic.
In addition to this, for the evaluated unit to be developed in the long term, it is usually
necessary to assess the innovation capacity of the evaluated unit over a certain period
(e.g., 10 years), which necessitates the consideration of carry-over variables for adjacent
periods [28]. To solve this problem and consider slack variables on this basis, Tone and
Tsutsui constructed a slacks-based measure called dynamic SBM (DSBM) [29]. DSBM not
only considers the dynamics of innovation activities but also slack variables, which makes
it more realistic.
To consider both the efficiency values and the changes of efficiency values over time
in both phases of innovation activities, Tone and Tsutsui [30] constructed a dynamic DEA
model with a network structure model (DNSBM) by adding link variables and carry-over
variables to the computational equation. Using the DNSBM model, the overall efficiency,Sustainability 2022, 14, 1227 5 of 18
divisional efficiency, and period efficiency can be obtained. The DNSBM model has been
used for efficiency measurements in several fields, such as the efficiency of electric power
systems, the efficiency of banks, China’s innovation during industry-university-research
institute’s collaboration process [31–33].
2.3. Literature Review Summary
By combing through the existing literature, it can be seen that there is very little current
literature that measures the efficiency of innovation in the ECEM industry. In addition, the
articles that do measure it have two shortcomings: on the one hand, most of the current
studies consider innovation activities as a whole [14–16], and few measure the research
and development phases separately. Innovation is a continuous process, and some of
the outputs of the R&D phase can be directly used as inputs in the transformation phase.
Therefore, it is too idealistic to consider the innovation process as a “black box,” which is
not in line with the actual situation. On the other hand, most of the current studies treat
each year of innovation activity as a separate unit [17,18], without considering the period
carry-over variables. Innovation activities are dynamic as they accumulate over time, and
separating each year’s innovation activities from each other does not meet the requirements
of sustainable capital development. Based on this, the DNSBM model is applied in this
paper. Vertically, the innovation efficiency of the ECEM industry is measured in stages, and
the innovation levels in the stages of research and development are assessed separately. On
this basis, the country is divided into east, middle, and west regions, and the efficiency
values of the two stages in each area are compared, respectively. Cross-sectionally, the
dynamic changes of the innovation efficiency of the electronics industry in the country
and the east, middle and west regions from 2013 to 2019 are evaluated. Finally, this paper
makes relevant suggestions in the context of efficiency measurement.
3. Materials and Methods
3.1. Model
3.1.1. SBM Model
The SBM model treats the decision unit as a whole and does not consider either the
internal network structure of the decision unit or the association between periods. The
SBM model is non-radial and can deal directly with the slack in the input and output
variables. The SBM model assumes that the system has n decision units, each with x inputs
and y outputs. The objective function of the SBM model is shown in Equation (1), and the
constraints are shown in Equation (2).
1− 1 m
m ∑ i =1 si− /xik
ρ∗ = min q (1)
1+ 1
q ∑ r =1 sr+ /yrk
s.t.Xλ + s− = xk
Yλ − s+ = yk (2)
λ, s+ , s− >0
where ρ∗ is the target efficiency value, xik and yrk are the input and output variables of
decision unit k, respectively, m and q are the number of inputs and outputs, si− and sr+ are
the corresponding slack values, and λ is the indicator weight. ρ∗ takes values in the range
(0,1), and when ρ∗ = 1, it means the decision unit is in the production frontier plane, and
when 0 ≤ ρ∗ ≤ 1, it means that the efficiency value needs to be improved.
3.1.2. DNSBM Model
According to the DNSBM model [30], the overall efficiency is:Sustainability 2022, 14, 1227 6 of 18
" " (t,t+1)
!##
t
linkin so(kh) in
t−
m s nbad sok bad
∑tT Wt ∑kK=1 wk 1− 1
mk +linkink +nbadk ∑i=k1 xiok
t + ∑(kh) =k 1 zt l + ∑k =1k (t,tl +1)
l
iok l o (kh) in
l
zok bad
θo∗ = min " "
t
l
(t,t+1)
!## (3)
linkout so(kh) out ngood sok good
t+
r srok
∑tT W t ∑kK=1 wk 1 + 1
rk +linkoutk +ngoodk ∑rk=1 t
yrok
+ ∑(kh) =1k zt l + ∑k =1 k (t,tl +1)
l
l o (kh) out
l
z ok l good
The division efficiency is:
" (t,t+1)
!#
t
linkin so(kh) in
t−
m s nbad sok bad
∑tT=1 wt 1− 1
mk +linkink +nbadk ∑i=k1 xiok
t + ∑(kh) =k 1 zt l + ∑k =1k (t,tl +1)
l
iok l o (kh) inl
zok bad
∗ l
δok = "
t (t,t+1)
!# (∀k) (4)
linkout so(kh) out ngood sok good
t+
r srok
∑tT=1 wt 1+ 1
rk +linkoutk +ngoodk ∑rk=1 t
yrok
+ ∑(kh) =1k zt l + ∑k =1 k (t,tl +1)
l
l o (kh) outl
z ok l good
The period efficiency:
(t,t+1)
!
t
linkin so(kh) in
t−
1 m s nbad sok bad
1− mk +linkink +nbadk ∑i=k1 xiok
t + ∑(kh) =k 1 zt l + ∑k =1k (t,tl +1)
l
iok l o (kh) in
l
zok bad
ρtok∗ = t
l
(t,t+1)
! (∀k; ∀t) (5)
linkoutk so(kh)l out ngood sok good
t+
1 r srok
1+ rk +linkoutk +ngoodk ∑rk=1 t
yrok
+∑ (kh)l =1 zto(kh) out
+ ∑k =1 k (t,tl +1)
l
l
zok good
l
The DNSBM model assumes that there are n decision-making units (DMUj, j = 1, . . . , n)
with K departments (k = 1, . . . , K), and innovation activities involve T periods (t = 1, . . . , T).
The input-output variables satisfy the following equations:
t = X t λt + st− (∀ k, ∀ t )
xok k k ko
ytok = Ykt λtk − stko+ (∀k, ∀t)
(6)
eλtk = 1(∀k, ∀t)
λtk ≥ 0, stko−1 ≥ 0, stko+ ≥ 0, (∀k, ∀t)
The DNSBM model assumes that sectors are not independent of each other, and that
there are four forms of link variables: free, fixed, as-input, and as-output. The link variables
satisfy the following equations:
Z(t kh) f ree λth = Z(t kh) f ree λtk (∀(k, h) f ree, ∀t)
Zot (kh) f ix = Z(t kh) f ix λth (∀(k, h) f ix, ∀t)
Zot (kh) f ix = Z(t kh) f ix λtk (∀(k, h) f ix, ∀t) (7)
Zot (kh)in = Z(t kh)in λtk + Sot (kh)in ((kh)in = 1, . . . , linkin k )
Zot (kh)out = Z(t kh)out λtk − Sot (kh)out ((kh)out = 1, . . . , linkout k )
The DNSBM model assumes that activities in the preceding period have an impact on
the later period, and there are also four forms of carry-over variables: good, bad, free, and
fixed. The carry-over variables satisfy the following equations:
(t,t+1) (t,t+1) (t,t+1)
Zok good = ∑nj=1 Zjk good λtjk − Sok good (k l = 1, . . . , ngoodk ; ∀k; ∀t)
l l l
(t,t+1) (t,t+1) (t,t+1)
Zok bad = ∑nj=1 Zjk bad λtjk + Sok bad (k l = 1, . . . , nbadk ; ∀k; ∀t)
l l l
(t,t+1) (t,t+1) t (t,t+1)
Zok = ∑nj=1 Zjk λ jk + Sok f ree (k l = 1, . . . , n f reek ; ∀k; ∀t) (8)
l f ree l f ree l
(t,t+1) n (t,t+1) t
Zok f ix
l
= ∑ j=1 Zjkl f ix λ jk (k l = 1, . . . , n f ixk ; ∀k; ∀t)
(t,t+1) (t,t+1) (t,t+1)
Sok good ≥ 0, Sok bad ≥ 0 and Sok f ree : f ree(∀k; ∀t)
l l lSustainability 2022, 14, 1227 7 of 18
The optimal value of overall efficiency θo∗ can be uniquely determined by Equation (3)
and constraints (6)–(8). In the case of period efficiency and division efficiency, there are
cases where the solutions are not unique. Next, based on finding θo∗ , the efficiency value
is obtained starting from the Tth period, and then in the reverse order of T −1, T −2, T −3,
. . . , 3, 2, the previously found solutions and Equations (1)–(8) are used as constraints until
the efficiency value at t = 2 is obtained. This paper summarizes symbolic notations and
explanations in Table 1.
Table 1. Symbolic notations and their explanations to be used in DNSBM model.
Symbolic Notations Explanation
t
xijk Input i to DMUj for division k at period t
t
yrjk Output r to DMUj for division k at period t
ztj(kh)l Link of DMUj from division k to division h at period t
(t,t+1) Carry-over of DMUj at division k from period t to period t + 1
z jkl
t− Slack of input I to DMUj for division k at period t
siok
t+ Slack of output r to DMUj for division k at period t
siok
sto(kh) Slack of link (kh) of DMUj at period t
(t,t+1) Slack of carry-over of DMUj at division k from period t to period t + 1
sokl
λtjk The intensity of DMUj corresponding to division k at period t
In addition to the ability to derive overall, division, and period efficiency values, the
DNSBM model, as discussed earlier, has the advantage of being able to relate different
sectors vertically through link variables and horizontally through carry-over variables
to different periods. This means that a major advantage of the DNSBM model over past
models (e.g., the SBM model) is that it can calculate efficiency loss values for both the link
variables and the carry-over variables, providing a benchmark and direction for improving
efficiency. This is one of the contributions of this paper: the ability to measure the efficiency
loss values of the link and carry-over variables for the ECEM industry.
The efficiency loss of the link variables and the efficiency loss of the carry-over vari-
ables can be found by linear programming and are calculated as follows:
zt(kh) − P(tkh)
ω(t mk) = (9)
P(tkh)
(t,t+1) (t,t+1)
(t,t+1) zm − Pm
ωm = (t,t+1)
(10)
Pm
(t,t+1)
where zt(kh) and zm represent the current values of the link variables and carry-over
(t,t+1)
variables, respectively, and P(tkh) and Pm represent the target values of the link variables
and carry-over variables, respectively. When the value of ω(t mk) is both 0, it indicates that
the link variable is fully valid, neither too much nor too short. When its value is not equal
to 0, it indicates room for improvement. Specifically, when its value is greater than 0, it
means that the link variable is excessive—namely, the connection among divisions is strong;
(t,t+1)
when its value is less than 0, it means a weak connection. ωm is the same as ω(t mk) .
3.2. Indicators Selection
Our data include 26 regions, due to the serious lack of data in Tibet, Ningxia, Xinjiang,
Qinghai, and Inner Mongolia, these five regions were excluded. In this paper, they are
divided into east, middle, and west regions according to their geographical locations, as
shown in Table 2.Sustainability 2022, 14, 1227 8 of 18
Table 2. Eastern, central and western regions within China.
Areas Regions
Eastern region Beijing, Tianjin, Shanghai, Liaoning, Hebei, Shandong, Jiangsu, Zhejiang, Fujian, Guangdong, Hainan
Central region Heilongjiang, Jilin, Henan, Shanxi, Anhui, Hubei, Hunan, Jiangxi, Guangxi
Western region Chongqing, Sichuan, Shaanxi, Yunnan, Gansu, Guizhou
3.2.1. Input and Output Indicators of the Research Stage
In the new product research and development phase, we can learn from the valuable
research results of related studies on the selection of indicators [2,15]. From the perspective
of human and financial resources, the investment indicators select research funding and
R&D personnel. Among them, the research funding is characterized by the indicator of
internal expenditure of R&D expenses, and R&D personnel is characterized by the indicator
of the full-time equivalent of R&D personnel. Since there is no full-time equivalent of
R&D personnel in each of the two divisions in the statistical yearbook, we converted the
full-time equivalent of R&D personnel to the two stages of new product development
and achievement conversion according to a certain proportion. The output indicators in
this stage should reflect the results of R&D [7]. We consider that patents are the primary
manifestation of R&D results. They are the direct output of R&D activities and are widely
used to measure innovation output. Therefore, this thesis chooses the number of patent
applications and the number of valid invention patents as the output indicators.
3.2.2. Input and Output Indicators of the Development Stage
In the product transformation phase, in addition to human and financial resources, we
also consider the number of patent applications, which is an output indicator of the new
product research and development phase, can also be used as an input indicator for the
product transformation phase [34], so the input variables include development funding,
R&D number of personnel and patent applications. R&D personnel uses the index of the
full-time equivalent of R&D personnel in the stage of product transformation. The output
indicator at this stage is the final output indicator. The result of the commercialization stage
is finally reflected in the sales of new products [2,15], so the output indicator is the sales
revenue of new products.
3.2.3. The Link Variables
The link variables should have the nature of intermediate products, which should be
one of the output indicators of the previous sector and one of the input indicators of the
next sector. The number of patent applications has this nature [34,35]. The study shows
that patents are closely related to innovation activities [36]. The use of patent indicators
better reflects the originality of innovation activities in the research department than other
indicators [37,38]. Patent applications mainly include the number of patent applications
and the number of valid invention patents. The difference between the two is that the
number of valid invention patents is the patents that have been granted. The number of
valid invention patents is more subject to human interference and takes longer to be granted.
Wang et al. [39] pointed out that even if a company’s patent application is not approved, it
still reflects that the company is actively carrying out scientific and technological research
and development work, which will positively impact its later work. The number of patent
applications better reflects the contribution of the research sector to the development sector,
as it takes into account the portion of patents that are not granted but still have a significant
economic and social effect. The number of valid invention patents, on the other hand,
focuses on the quality and results of innovation in the research sector and is more suitable
for analysis of the direct output of the research sector. Given the above considerations, this
paper selected the number of patent applications as the link variable, consistent with the
variables selected in many existing studies [40–43].Sustainability 2022, 14, 1227 9 of 18
3.2.4. The Carry-Over Variables
In the ECEM industry, a portion of the research funds invested in the first period is
used to purchase instruments and equipment. The tools and equipment purchased are still
available in later periods. We combine with the indicators selected in the relevant literature.
This part of the research funding has a lagging and cumulative effect on the technological
innovation efficiency of high-tech industries [29]. Therefore, we calculate the capital stock
for the costs used to purchase apparatus and equipment and use the computed capital
stock as the carry-over variable.
The above indicator system is shown in Table 3.
Table 3. Indicator system of innovation efficiency evaluation.
Departments Categories Indicators
Research stage Input Research funding
Number of R&D in the research phase
Output Number of valid invention patents
Carry-over Capital stock
Link Number of patent applications
Development stage Input Development funding
Number of R&D in the development phase
Output Sales revenue
The relationship of the input-output variables is shown in Figure 1.
Figure 1. Structural diagram of the DNSBM model.
3.3. Sample Selection and Data Processing
The samples in this article are the ECEM industry of various provinces in China. All
the data in this article come from the China High-tech Industry Statistical Yearbook and
China Science and Technology Statistical Yearbook for 2014–2020. The individual missing
data are supplemented by linear interpolation. In terms of data processing, considering the
short R&D cycle of the electronics and communication equipment manufacturing industry
and the rapid rate of renewal, it is assumed that there is no lag between the input items
and the corresponding output items.
Regarding the deflation of R&D expenditures, to eliminate the impact of price changes,
combined with relevant literature, there are research results [32], R&D internal expenditures,
new product development expenditures, and new product sales revenue are, respectively,
based on R&D expenditures price index and household consumption. The price index
and the ex-factory price index of industrial producers are deflated. The capital stock isSustainability 2022, 14, 1227 10 of 18
calculated using the perpetual inventory method [29]. The year involved in each indicator
is 2013–2019, and each year’s data are converted using 2013 as the base period.
4. Analysis of Innovation Efficiency in the ECEM Industry
This paper uses MAXDEA software (8 ultra, Beijing Ruivomedi Software Co., Beijing,
China) to calculate the panel data of the ECEM industry in China’s 26 provinces from 2013
to 2019. Then we obtained the overall efficiency, divisional efficiency, and period efficiency
of the innovation activities of various provinces’ ECEM industries.
4.1. Analysis of Overall Efficiency
Through calculation, we can acquire the overall efficiency of each province. The
calculation results of the DNSBM model and are shown in Table 4. In addition to calculating
the efficiency value, the efficiency value is also sorted in Table 4.
Table 4. Efficiency values of DNSBM model.
Province Efficiency Rank Province Efficiency Rank
Beijing 1.00 1 Henan 0.74 18
Tianjin 0.85 10 Hubei 0.66 21
Hebei 0.52 24 Hunan 0.51 25
Shanxi 0.52 23 Guangdong 1.00 1
Liaoning 0.71 19 Guangxi 0.84 11
Jilin 0.89 8 Hainan 0.86 9
Heilongjiang 0.92 7 Chongqing 0.76 16
Shanghai 0.95 4 Sichuan 0.84 12
Jiangsu 0.93 5 Guizhou 0.70 20
Zhejiang 0.93 6 Yunnan 0.82 14
Anhui 0.98 3 Shaanxi 0.43 26
Fujian 0.65 22 Gansu 0.75 17
Jiangxi 0.81 15 Average 0.78
Shandong 0.82 13
Regarding the innovation efficiency of China’s ECEM industry, by analyzing the
efficiency values of the DNSBM model, we can see that Beijing and Guangdong are at
the frontier of efficiency, and their efficiency values are both 1. Anhui, Shanghai, Jiangsu,
Zhejiang, and Heilongjiang have relatively high innovation efficiency, their innovation
efficiency values located between 0.9 and 1. Beijing, Guangdong, Shanghai, Jiangsu,
and Zhejiang are at the forefront of China’s economic development. By observing the
investment in R&D-related indicators over the years, it can be found that these provinces
have a relatively significant investment based on their excellent geographical location and
economic status. Therefore, their innovation efficiency is relatively high. Heilongjiang and
Anhui have relatively weak industrial foundations and limited industrial development
levels. However, the investment in R&D-related indicators has also increased year by year.
Their resource utilization rates are also high, so their innovation efficiency is relatively
high. The provinces with efficiency values between 0.78 and 0.9 are Tianjin, Jilin, Jiangxi,
Shandong, Guangxi, Hainan, Sichuan, and Yunnan. The efficiency values of these provinces
are higher than the average and lower than those with relatively higher efficiency values.
The efficiency values of the remaining provinces are all lower than the average. Among
them, the efficiency values of Hebei, Shanxi, Hunan, and Shaanxi are lower than 0.55. The
overall efficiency of the ECEM industries in these provinces is low.
4.2. Analysis of Divisional Efficiency
To more intuitively compare the efficiency differences of each sector in the east, middle
and west regions of mainland China, this paper divides each sector according to three major
areas based on the measured efficiency averages of each province. It calculates the efficiency
averages of each sector in each of the three major regions. This paper uses bar charts toSustainability 2022, 14, 1227 11 of 18
compare the efficiency differences between the three major regions. The comparison result
is shown in Figure 2. The figure shows that the Eastern region is the most efficient in the
research and development divisions, followed by the central region, and the western region
is the least efficient. This shows that the eastern region’s product development and product
transformation efficiency is relatively the highest.
Figure 2. Comparison of the efficiency values of the two sectors in the three regions.
Figures 3–5 describe the differences in the efficiency of research and development
stages in different provinces under different regions. It can be seen from the figure that in
the eastern region, the efficiencies of the two divisions in Beijing, Guangdong, Shanghai,
Jiangsu, and Zhejiang are all equal to or close to 1. It shows that the ECEM industry in these
provinces has sufficient inputs under the existing conditions. The output of scientific and
technological achievements can be almost all converted into productivity. The innovation
capacity of these provinces is good. The research efficiency of Hainan and Tianjin are
both 1, which is significantly higher than the development efficiency. This shows that only
part of the output of scientific and technological achievements in the ECEM industry is
converted into productivity. Hebei, Liaoning, Shandong, and Fujian are all low in efficiency,
indicating that their resource utilization and technological transformation capabilities are
relatively low. In the central region, as shown in Figure 4, the efficiency of the development
division in Anhui is 1. The efficiency of the research division is close to 1, so the innovation
ability is good. While the efficiency of the development division in Henan province is 1,
the efficiency of the research division is only 0.49, indicating that there is still much room
for improvement in the efficiency of its product development. The efficiency of Jilin and
Heilongjiang is relatively considerable, while that of Shanxi and Hubei is relatively low.
In the western region, as shown in Figure 5, the efficiency of the two divisions in each
province is generally low, and the difference is slight. However, it is not difficult to find
that Yunnan province has the highest efficiency in the two divisions in the western region.
Except for Yunnan province, the research efficiency of other provinces is higher than the
corresponding development efficiency.Sustainability 2022, 14, 1227 12 of 18
Figure 3. The divisional efficiencies of the two stages in the Eastern region.
Figure 4. The divisional efficiencies of the two stages in the Central region.
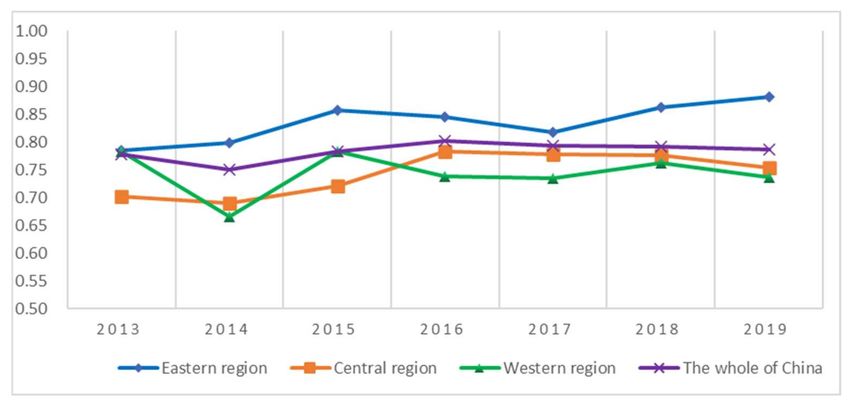
4.3. Analysis of Period Efficiency
The period efficiency can reflect the change of efficiency value with the period, and
the period efficiency calculated by using software in this paper is shown in Figure 6.
Figure 6 shows the changes in the period efficiency for the three major regions from
2013 to 2019. The trend of the folding line shows that in 2013–2014, the overall national
efficiency values are on a downward trend. After 2014, the efficiency value of various
regions across the country began to increase, inseparable from a series of related policies
issued by China. In 2014 and 2015, China successively introduced the “Broadband China”
particular action and “Made in China 2025”. The purpose is to improve informatization and
promote the development of the country’s manufacturing industry as one of the five major
industries in China’s high-tech industries. The electronics and communication equipment
manufacturing industry has gradually improved its innovation efficiency under policies.
Therefore, the innovation efficiency of the electronic and communication equipment manu-
facturing industry in all country regions improved substantially in 2014–2016. In recentSustainability 2022, 14, 1227 13 of 18
years, the national innovation efficiency has stabilized. From the perspective of various
regions, there are differences in the efficiency values of the eastern, central, and western
regions. The innovation efficiency of the east region is higher than the national average, and
the efficiency value is rising steadily. This is related to the superior geographical location
and the denser industries in the high-tech zone. The innovation efficiency of the central
and western regions is lower than the national average. There has been a steady or even a
slight downward trend in recent years. This shows that although the state has introduced
a series of supportive policies, the central and western regions have fewer innovation
opportunities and resources than the eastern regions, so its innovation efficiency cannot
increase substantially.
Figure 5. The divisional efficiencies of the two stages in the Western region.
Figure 6. The period efficiencies in 2013–2019 under different regions.
4.4. Comparison Analysis with SBM Model Efficiency Values
In contrast to the DNSBM model, the SBM model does not consider link and carry-
over variables. However, in actual innovation activities, the link variables and carry-
over variables is not perfect, and there will be underutilization. The number of patent
applications and capital stock are also too much or too little in the innovation activities of
the ECEM industry. Among innovation sectors, a high volume of patent applications in
the research sector can lead to an underutilization of patents in the development sector,Sustainability 2022, 14, 1227 14 of 18
which is a waste of innovation results; conversely, if the volume of innovation output in
the research sector does not meet the needs of the development sector, it can also affect the
progress of the innovation process. The same is true for carry-over variables. During the
innovation time period, the capital stock of the previous period, if properly invested, will
neither cause a waste nor an oversupply of innovation assets. Both of these variables can
lead to a loss of efficiency value in excess or deficiency, so ignoring the loss of efficiency in
the number of patent applications and capital stock can lead to an overestimation of the
overall efficiency value.
The DNSBM model can measure the efficiency loss values of link and carry-over
variables by Equations (9) and (10) to determine the articulation of innovation activities
between sectors and adjacent periods by analyzing efficiency loss of links and carry-overs.
This paper calculates the link efficiency loss from research to development stage
by Equation (9) and calculates the carry-over efficiency loss from period T to T + 1 by
Equation (10). The calculation results are shown in Table 5.
Table 5. Average efficiencies loss of the link and carry-over variable.
Link Carry-Over Link Carry-Over
Province Number of Patent Province Number of Patent
Capital Stock Capital Stock
Applications Applications
Beijing 0 0 Shandong 0.0203 0.0015
Tianjin 0.0321 0 Henan 0 0.4013
Hebei 0 0.0440 Hubei 0 0.0238
Shanxi 0 0.5009 Hunan 0 0.0443
Liaoning 0.0023 0 Guangdong 0 0.0368
Jilin 0 0.0019 Guangxi 0.1434 0.0010
Heilongjiang 0 0.5218 Hainan 0.0194 0.5856
Shanghai 0.0052 0 Chongqing 0 0.2202
Jiangsu 0 0.5375 Sichuan 0 0.1622
Zhejiang 0 0.4701 Guizhou 0 0.2320
Anhui 0.0232 0 Yunnan 0 0
Fujian 0 0.4510 Shaanxi 0 0
Jiangxi 0 0.1189 Gansu 0 0.3785
Regarding the link efficiency loss, the study results show that the research sector and
the development sector are closely related, with 19 out of 26 provinces having an efficiency
loss value of 0, which proves that there is a positive relationship between the research
and the development sector. In other words, the research results provided by the research
sector are equal to the demand for research results from the development sector. The link
efficiency loss in Tianjin, Liaoning, Shanghai, Anhui, Shandong, Guangxi, Hainan, and
Shaanxi are all greater than 0, indicating that the research results provided by the research
department exceed the demand for research results from the development department.
Further, patent applications cannot be fully converted into new product sales revenue.
For the carry-over efficiency loss, Table 5 shows that 19 provinces have efficiency loss
values greater than 0. This indicates that these provinces invest too much capital in the
early period but do not use it efficiently in the later period. The accumulation of capital
early exceeds the actual demand in the later period, which leads to the waste of capital.
The other seven provinces have an efficiency loss value of 0, indicating that the capital
accumulated in the first period can be well used in the later innovation activities.
From the above analysis, it can be seen that there is some room for improvement in
the innovation efficiency of the Chinese ECEM industry. Specifically, the development
sectors in Tianjin, Liaoning, Shanghai, Anhui, Shandong, Guangxi, and Hainan provinces
underutilize research results; most provinces have excessive upfront capital investment,
resulting in wasted resources. This leads to an overestimation of the efficiency of the
decision unit when using models that do not consider link and carry-over variables (e.g.,Sustainability 2022, 14, 1227 15 of 18
SBM models). To do a comparative analysis, this paper chooses the input-oriented linear
programming, sets variable returns-to-scale, calculates the efficiency value of each DMU by
the SBM model. Then we compare it with the efficiency value calculated by the DNSBM
model. The calculation results of the DNSBM model and the SBM model are shown in
Figure 7.
Figure 7. Comparison chart of DNSBM model and SBM model efficiency.
By comparing the efficiency of the DNSBM model and the SBM model, we can see a
distinct difference between the efficiency values of the two models regarding the innovation
efficiency of the Chinese ECEM industry. It is evident from Figure 7 that the efficiency
values calculated by the SBM model are overall higher than those calculated by the DNSBM
model: the average efficiency of the former is 0.78, while the average efficiency of the latter
is 0.84, which confirms the previous analysis of this paper. This is because the SBM model
ignores the efficiencies loss of the link and carry-over variable and therefore overestimates
the efficiency of each decision unit. As can be seen from Table 5, except for Beijing, Yunnan,
and Shaanxi, where there is no efficiencies loss of both the link and carry-over variables,
all other provinces have efficiencies loss, which leads to overestimating of their efficiency
values. The DNSBM model, as an improved model of the SBM model, can acquire not only
the overall efficiency but also the divisional efficiency and period efficiency. Therefore, the
reasons for the low efficiency can be seen. DNSBM model provides a more realistic view of
what is going on within the supply chain. More targeted suggestions and improvement
programs can be put forward.
5. Conclusions and Implications
From the perspective of improving China’s innovation efficiency, this paper constructs
a DNSBM model to measure the innovation efficiency of Chinese provinces and regions
to achieve the sustainable development of innovation activities. Compared with previous
studies, the DNSBM model used in this paper is more generalizable: it introduces the
number of patent applications and capital stock as link and carry-over variables, both of
which take into account the internal connectivity of innovation activities and the dynamics
of sustainable innovation, providing a new perspective for evaluating innovation efficiency.
In terms of model application, this paper measures the innovation efficiency of China’s
ECEM industry using the DNSBM model, yielding overall efficiency, divisional efficiency,Sustainability 2022, 14, 1227 16 of 18
and period efficiency. In terms of overall efficiency, the overall efficiency value of China’s
ECEM industry is low; in terms of divisional efficiency, there are differences in innovation
efficiency among the three regions. Whether it is the research stage or the development
stage, the eastern region has the largest efficiency value, the central region is the second, and
the western region is the smallest; from the perspective of period efficiency, the innovation
efficiency of the eastern, central, and western regions differs over time: the eastern region
shows a slow upward trend, the central region’s efficiency first rises and then slowly
declines, and the western region’s innovation efficiency has a more zigzag trend over time,
and a decreasing trend in recent years.
This paper puts forward the following policy recommendations based on the above
analysis: 1. Promote technological innovation and encourage innovation-driven develop-
ment. Innovation can drive economic development, and encouraging sustainable innova-
tion is vital to achieving sustainable economic development. 2. Different policies should
be designated for different regions. The eastern region should further exert its location
and innovation advantages, strengthen exchanges and cooperation with the central and
western regions, and actively drive and influence the innovation efficiency of the ECEM
industry in the central and western regions under the premise of ensuring its innovation
efficiency. The central and western regions should also take advantage of their resource
endowments, combine their characteristics, grasp relevant national policies, and respond
to the national call to proactively improve innovation efficiency. 3. China should further
improve the innovation environment and guide the research and development sectors to
interface effectively. The government should encourage the research sector to engage in
research output actively and call on it to pay attention to the commercialization of research
output. 4. Innovation actors should consider the sustainability of innovation activities and
measure innovation capital investment from a long-term perspective. It should not only
look at the immediate benefits without considering the future development of innovation.
However, this paper has some shortcomings, which are the focus of our future research.
Firstly, the construction of an innovation indicator system is a complex task. Although the
indicators selected in this paper are based on previous studies, human subjective factors
also influence them. It is worth exploring other input-output indicators in future studies.
Second, the research in this paper takes the Chinese ECEM industry as the research object,
and the innovation efficiency of other industries can be studied in the future. The scope
of the study can also be expanded in the future to compare the innovation efficiency of
more countries.
Author Contributions: Conceptualization, J.L.; methodology, J.L. and R.Q.; formal analysis, J.L.; data
curation, R.Q.; writing—original draft preparation, J.L.; writing—review and editing, J.L. and R.Q.;
Funding acquisition, H.J.; visualization, R.Q.; supervision, H.J. All authors have read and agreed to
the published version of the manuscript.
Funding: This research was funded by National Natural Science Foundation of China (Project no.
71801195).
Institutional Review Board Statement: Not applicable.
Informed Consent Statement: Not applicable.
Data Availability Statement: Not applicable.
Acknowledgments: The authors would like to thank the editors and anonymous reviewers for their
insightful comments and suggestions.
Conflicts of Interest: The authors declare no conflict of interest.
References
1. Qu, Y.; Yu, Y.; Appolloni, A.; Li, M.; Liu, Y. Measuring Green Growth Efficiency for Chinese Manufacturing Industries.
Sustainability 2017, 9, 637. [CrossRef]
2. Wang, Y.; Pan, J.F.; Pei, R.M.; Yi, B.W.; Yang, G.L. Assessing the technological innovation efficiency of China’s high-tech industries
with a two-stage network DEA approach. Socio-Econ. Plan. Sci. 2020, 71, 100810. [CrossRef]Sustainability 2022, 14, 1227 17 of 18
3. Zhang, R.; Sun, K.; Delgado, M.S.; Kumbhakar, S.C. Productivity in China’s high technology industry: Regional heterogeneity
and R&D. Technol. Forecast. Soc. Change 2012, 79, 127–141.
4. Guo, X.; Deng, C.; Wang, D.; Du, X.; Li, J.; Wan, B. International Comparison of the Efficiency of Agricultural Science, Technology,
and Innovation: A Case Study of G20 Countries. Sustainability 2021, 13, 2769. [CrossRef]
5. Im, C.H.; Cho, K.T. Comparing and Identifying Influential Factors of Technological Innovation Efficiency in Manufacturing and
Service Industries Using DEA: A Study of SMEs in South Korea. Sustainability 2021, 13, 12945. [CrossRef]
6. Hansen, M.T.; Birkinshaw, J. The innovation value chain. Harv. Bus. Rev. 2007, 85, 121.
7. An, Q.; Meng, F.; Xiong, B.; Wang, Z.; Chen, X. Assessing the relative efficiency of Chinese high-tech industries: A dynamic
network data envelopment analysis approach. Ann. Oper. Res. 2020, 290, 707–729. [CrossRef]
8. Luo, Q.; Miao, C.; Sun, L.; Meng, X.; Duan, M. Efficiency evaluation of green technology innovation of China’s strategic emerging
industries: An empirical analysis based on Malmquist-data envelopment analysis index. J. Clean. Prod. 2019, 238, 117782.
[CrossRef]
9. Zhao, X.; Ding, X.; Li, L. Research on environmental regulation, technological innovation and green transformation of manufac-
turing industry in the Yangtze River Economic Belt. Sustainability 2021, 13, 10005. [CrossRef]
10. Liu, L.; Hou, Y.; Zhan, X.; Wang, Z. Innovation efficiency of high-tech SMEs listed in China: Its measurement and antecedents.
Discrete Dyn. Nat. Soc. 2020, 2020, 8821950. [CrossRef]
11. Li, L.B.; Liu, B.L.; Liu, W.L.; Chiu, Y.H. Efficiency evaluation of the regional high-tech industry in China: A new framework based
on meta-frontier dynamic DEA analysis. Socio-Econ. Plan. Sci. 2017, 60, 24–33. [CrossRef]
12. Haschka, R.E.; Herwartz, H. Innovation efficiency in European high-tech industries: Evidence from a Bayesian stochastic frontier
approach. Res. Policy 2020, 49, 104054. [CrossRef]
13. Chen, H.; He, P.; Zhang, C.X.; Liu, Q. Efficiency of technological innovation in China’s high tech industry based on DEA method.
J. Interdiscip. Math. 2017, 20, 1493–1496. [CrossRef]
14. Hong, J.; Feng, B.; Wu, Y.; Wang, L. Do government grants promote innovation efficiency in Chinaa’s high-tech industries?
Technovation 2016, 57, 4–13. [CrossRef]
15. Wang, Q.; Hang, Y.; Sun, L.; Zhao, Z. Two-stage innovation efficiency of new energy enterprises in China: A non-radial DEA
approach. Technol. Forecast. Soc. Change 2016, 112, 254–261. [CrossRef]
16. Danna, S.; Yan, L. Analysis on Innovation Efficiency of China Meteorological Science and Technology and Its Influencing Factors.
Am. J. Manag. Sci. Eng. 2019, 4, 32–38. [CrossRef]
17. Sun, H.; Edziah, B.K.; Sun, C.; Kporsu, A.K. Institutional quality, green innovation and energy efficiency. Energ. Policy 2019, 135,
111002. [CrossRef]
18. El Mehdi, R.; Hafner, C.M. Erratum: Erratum to“Inference in stochastic frontier analysis with dependent error terms”.
Math. Comput. Simulat. 2014, 105, 160. [CrossRef]
19. Huang, F.; Du, Y.; Hu, D.; Zhang, B. Sustainable Performance Analysis of Power Supply Chain System from the Perspective of
Technology and Management. Sustainability 2021, 13, 5972. [CrossRef]
20. Krivonozhko, V.E.; Førsund, F.R.; Lychev, A.V. On comparison of different sets of units used for improving the frontier in DEA
models. Ann. Oper. Res. 2017, 250, 5–20. [CrossRef]
21. Wu, C.; Li, Y.; Liu, Q.; Wang, K. A stochastic DEA model considering undesirable outputs with weak disposability. Math. Comput.
Model. 2013, 58, 980–989. [CrossRef]
22. Wu, J.; Yu, Y.; Zhu, Q.; An, Q.; Liang, L. Closest target for the orientation-free context-dependent DEA under variable returns to
scale. J. Oper. Res. Soc. 2018, 69, 1819–1833. [CrossRef]
23. Zhang, N.; Choi, Y. Environmental energy efficiency of China’s regional economies: A non-oriented slacks-based measure
analysis. Soc. Sci. J. 2013, 50, 225–234. [CrossRef]
24. Tone, K. A slacks-based measure of efficiency in data envelopment analysis. Eur. J. Oper. Res. 2001, 130, 498–509. [CrossRef]
25. Li, D.; Zeng, T. Are China’s intensive pollution industries greening? An analysis based on green innovation efficiency. J. Clean.
Prod. 2020, 259, 120901. [CrossRef]
26. Färe, R.; Grosskopf, S.; Whittaker, G. Network DEA: Modeling Data Irregularities and Structural Complexities in Data Envelopment
Analysis; Springer: Berlin/Heidelberg, Germany, 2007.
27. Tone, K.; Tsutsui, M. Network DEA: A slacks-based measure approach. Eur. J. Oper. Res. 2009, 197, 243–252. [CrossRef]
28. Chen, K.; Kou, M.; Fu, X. Evaluation of multi-period regional R&D efficiency: An application of dynamic DEA to China’s regional
R&D systems. Omega 2018, 74, 103–114.
29. Tone, K.; Tsutsui, M. Dynamic DEA: A slacks-based measure approach. Omega 2010, 38, 145–156. [CrossRef]
30. Tone, K.; Tsutsui, M. Dynamic DEA with network structure: A slacks-based measure approach. Omega 2014, 42, 124–131.
[CrossRef]
31. She, Z.Y.; Meng, G.; Xie, B.C.; O’Neill, E. The effectiveness of the unbundling reform in China’s power system from a dynamic
efficiency perspective. Appl. Energ. 2020, 264, 114717. [CrossRef]
32. Zha, Y.; Liang, N.; Wu, M.; Bian, Y. Efficiency evaluation of banks in China: A dynamic two-stage slacks-based measure approach.
Omega 2016, 60, 60–72. [CrossRef]
33. Bai, X.J.; Li, Z.Y.; Zeng, J. Performance evaluation of China’s innovation during the industry-university-research collaboration
process—An analysis basis on the dynamic network slacks-based measurement model. Technol. Soc. 2020, 62, 101310. [CrossRef]You can also read