MEASURING GENDER EQUITY IN CITIES - AN INTERSECTIONAL SET OF PROPOSED INDICATORS CITY CLIENT
←
→
Page content transcription
If your browser does not render page correctly, please read the page content below

MEASURING GENDER
       EQUITY IN CITIES
                An Intersectional Set of
                  Proposed Indicators

CITY CLIENT                                 CHANGE MEMBERS
Erin Brominghim, Angela Kim, Tanya Pineda   Barcelona, Freetown
Office of Los Angeles Mayor Eric Garcetti   London, Los Angeles
                                            Mexico City, and Tokyo

                                                                     1
CHANGE:
City Hub & Network for Gender Equity

{
        MISSION
        “To empower women in all their diversity, the City Hub and Network for
        Gender Equity (CHANGE) harnesses the collective power of cities to transform
        government services and systems to the benefit of all. Member cities create
        systemic change by identifying disparities, implementing initiatives to address
        needs across city operations, and tracking measures for success. CHANGE
        believes that to be successful, our work must explicitly recognize and address
        intersecting inequalities predicated upon race, religion, ethnic origin, disability,
        sexual orientation, and gender identity or expression.”

RESEARCHERS
Maya Angulo
Rachael Barich
Madeleine Henry
Stella Hong
Valentyna Koudelkova
Emily Livingstone
Lauren Long
Nina Morse
Nicole Schwyn
Olivia Shinners
Oli Vorster
Talia White

ADVISED BY:
Professor Madeline Baer
Occidental College

                                                                                               2
CONTENT
EXECUTIVE SUMMARY                       4

KEY TERMS                               8

INTRODUCTION                            10

LITERATURE REVIEW: LANDSCAPE ANALYSIS   8

METHDOLOGY                              14

THEMATIC AREAS                          23

 HEALTH & RELATED SERVICES              24

 ECONOMICS, LABOR & WELL-BEING          30

 SCHOOLING & EDUCATION                  34

 GENDER-BASED VIOLENCE & SECURITY       40

 GOVERNANCE & PUBLIC LIFE               45

 BUILT ENVIRONMENT                      49

CONCLUSION                              59

GLOSSARY                                60

APPENDIX                                66

                                             3
EXECUTIVE SUMMARY
MEASURING GENDER EQUITY IN CITIES:
An Intersectional Set of Proposed Indicators

INTRODUCTION
This Report is created in partnership with the Mayor's Office of the City of Los Angeles to provide
a foundation for cities to measure progress on gender equity within the City Hub and Network
for Gender Equity (CHANGE). This Report proposes thematic sets of critical indicators with
accompanying detailed justifications all aimed at tracking progress on gender equity in cities
around the world. The data collected from these indicators can inform cities on their progress
toward gender equity, giving cities the ability to identify disparities and implement initiatives across
city operations. The proposed indicators seek to localize the broader goals of The Convention
on the Elimination of all Forms of Discrimination Against Women (CEDAW) and Sustainable
Development Goal 5 by providing cities with tools to assess, address, and track systems of gender
equity - moving beyond the gender binary to promote gender inclusivity and create change in the
best interest of all. This report acknowledges and incorporates an intersectional lens - meaning
one that considers the interconnected nature of social categorization (e.g. race, gender, class) that
creates overlapping and interdependent systems of discrimination and disadvantage. For this
reason, indicator data is intended/encouraged to be disaggregated across social categorization as
well as Sexual Orientation, Gender Identity + Expression, and Sex Charactersistics (SOGIESC). Each
indicator focuses on areas of gender-based disparities within six thematic areas of city-life where
gender equity issues manifest:

                                                                                                           4
METHODOLOGY
With the guiding values of gender inclusivity and intersectionality, we built our six thematic
areas and collected indicators from commonalities in existing global gender equity indices,
human rights organizations, and relevant academic literature. We then researched CHANGE
cities to inform the language, applicability, and proper localization of the indicators.

REVIEW OF EXISTING GENDER EQUITY INDICES
     Index          UN Minimum             EIGE Index    LGBTI Inclusion      OECD Gender
                       Gender                                Index            Equality Data
                     Indicators
   Thematic       Economic            Work, Money,       Health,            Employment,
     Areas        Structures,         Knowledge,         Education, Civil   Education,
                  Education,          Power, Time,       and Political      Entrepreneurship,
                  Health and          Health, Violence   Participation,     Health,
                  Related Services,   Against Women,     Economic Well-     Development,
                  Public Life and     Intersecting       being, Security    Governance
                  Decision Making,    Inequalities       and Violence
                  Human Rights of
                  Women and Girl
                  Children
 Intersectional   No                  Yes*               Yes                No
      Lens
     Rejects      No                  No                 Yes                No
 Gender Binary
    Total # of    63                  31                 51                 34
   Indicators
 Specific Focus   N/A                 N/A                LGBTI Inclusion    Economic
                                                                            Development

* This index has an intersectional lens but excludes non-gender binary conforming individuals
and other identities like race.

Acronym Guide:
EIGE: European Institute for Gender Equality
LGBTI: Lebian, Gay, Bisexual, Transgender and Intersex
OECD: Organization for European Cooperation and Development

                                                                                                 5
PRIORITIZATION
In order to consolidate the initial 250+ indicators into the Report’s final selection of 52
indicators, the following prioritization criteria were utilized:

  1. References: Is the topic referenced in other indices, SDGs, and/or CHANGE cities’ work?
  2. City Jurisdiction: Are there potential policy interventions at the city level?
  3. Data: Is the indicator measurable? Are the data available?
  4. Outcome Oriented: Is there a clear, systemic outcome that is clearly related to gender
     equity?
  5. Applicability: Is the indicator flexible across various cultural contexts?

SAMPLE INDICATORS
The following 18 sample indicators serve to introduce the scope and focus of each
thematic area.

Health & Related Services
(1.1) Percentage of population who report their health to be fair to poor, disaggregated by
SOGIESC, race, and age
(1.2) Percentage of population diagnosed with HIV/AIDS, disaggregated by SOGIESC and age
(1.5) Percentage of population with a reliable, affordable source of ongoing care,
disaggregated by SOGIESC, race, and socioeconomic status

Economics, Labor & Well-being
(2.1) Percentage of labor force that is unemployed, disaggregated by SOGIESC and age
(2.7) Percentage of salaried vs. hourly wage workers, disaggregated by SOGIESC
(2.9) Proportion of adults with an account at a bank or other financial institutions or with a
mobile-money service provider disaggregated by SOGIESC

Schooling & Education

(3.3) Percentage of population in a given age group achieving at least a fixed level of
proficiency in functional (a) literacy and (b) numeracy skills, disaggregated by SOGIESC
(3.4) Proportion of educational institutions with a Lived Named Policy, disaggregated by
educational level
(3.8) Percentage of population in non-formal education and training sponsored by city
government, disaggregated by SOGIESC

                                                                                                 6
Gender-Based Violence & Security

(4.1) Proportion of persons subjected to physical, sexual or psychological violence by a current
or former intimate partner, or by persons other than an intimate partner, respectively [in the
last year] and/or [at least once in their lifetime], disaggregated by SOGIESC
(4.4) Existence of anonymous reporting systems for sexual assault or harassment within city
government
(4.6) Existence of mandatory training programs that incorporate training on human rights
and protection from violence concerning SOGIESC. [Cluster Options1: judicial officials, law-
enforcement officials, correctional officials, city government and operations teams, city
administrative teams]

Governance & Public Life
(5.1) Existence of city government statistical reporting systems that disaggregate data by
SOGIESC, allow calculation of statistics on health, education, economic outcomes, violence,
and political participation, and is publicly available
(5.4) Rate that candidates for elective office get elected compared to men, disaggregated by
SOGIESC
(5.5) Existence of an intentional gender perspective in city planning/policy making [Cluster
Options: budgetary programmes, strategic plans, street light planning, city resilience planning]

Built Environment
(6.1b) Existence of laws that require security infrastructure at public transit stops and transit
buildings disaggregated by location
(6.1d) Whether or not public buildings are required to have gender-inclusive menstruation
product disposal areas in toilet facilities disaggregated by building type
(6.3.d) Percentage of population in government sponsored housing projects or low income
housing, disaggregated by SOGIESC

CONCLUSION
The aim of this Report is to propose a set of indicators that cities can use to measure gender
equity. By using an intersectional lens and specifically calling for data collection that is
disaggregated by SOGIESC, we have addressed the limitation of simply measuring along
the gender binary in order to make other gender identities, as well as LGBTI populations,
more visible. Overall, the 52 top priority indicators proposed in this Report aim to be clearly
outcome-oriented in relation to gender equity, with the ultimate goal of creating systemic
change in both small and large cities, across different cultural contexts.

1 A cluster is an intentionally broad, thematic indicator that provides examples of data points that cities can report back
on depending on local context and available data.
                                                                                                                              7
KEY TERMS
            Gender                                      Gender
                                                        Equality
A social construct which places           The equal valuing of all individuals
cultural and social expectations          in society whereby everyone enjoys
on individuals based on their             equal rights, responsibilities, and
assigned sex at birth (usually male       opportunities. This term does
or female), which changes over            not always take into account
time and varies by cultural context       an individual’s ability-levels and
(see also, “Gender Norms” in the          environmental factors, and can
Glossary). Gender is hierarchical         still produce dramatically different
in most societies and produces            outcomes based on gender and other
inequalities that intersect with          intersecting identities.
other social and economic
inequalities (see “Intersectionality”).

                Gender                                  Gender
                Binary                                  Equity
The classification of gender              Fairness in treatment for all people
into two categories of male and           according to their respective needs.
female, which suggests that a             This may include equal treatment,
person’s gender must be either            as well as treatment that is different
of the two. This simplification of        but considered equivalent in terms
gender excluded individuals whose         of rights, opportunities, outcomes,
identities fall outside of these          and benefits.
two categories, and the systemic
exclusion creates psychological
harm, stress, and/or issues
pertaining to identity.

                                                                                   8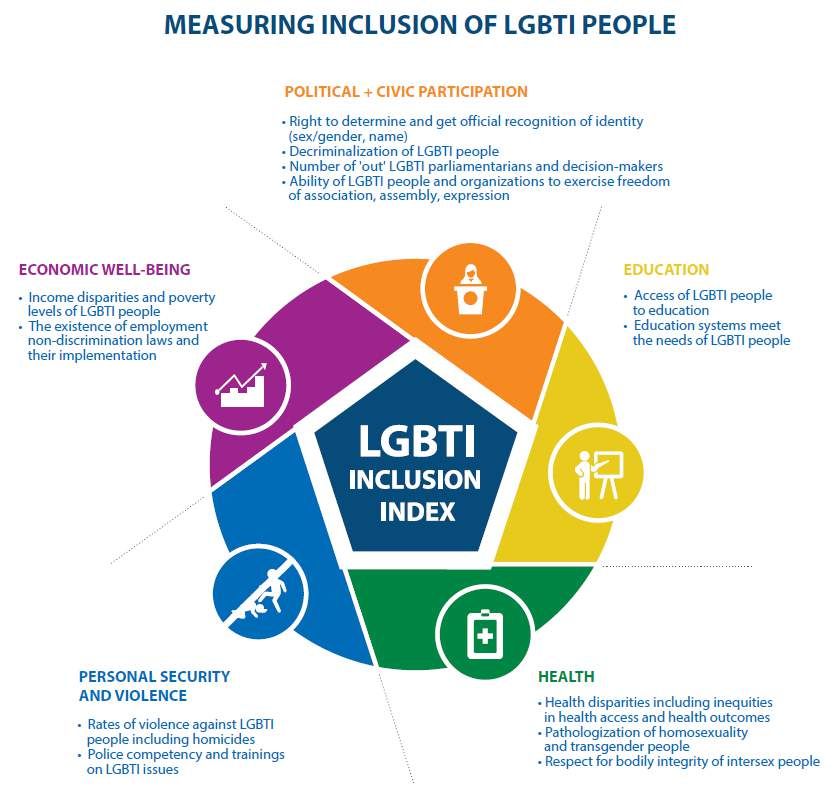
Gender
                Identity                                  SOGIESC
  Expressed and understood by
  looking at inward emotions as well         Acronym for sexual orientation,
  as how individuals perceive and            gender identity, gender expression,
  label themselves (including male,          and sex characteristics (see
  female, neither, or a blend of both).      individual definitions below)
  It is important to note that one’s
  gender identity does not have to be
  what they were assigned at birth.

                Gender                                 Sex
              Expression                          Characteristics

  The external appearance of              Physical attributes indicative of
  one’s gender identity, mostly           an individual’s biological sex.
  demonstrated through an                 [Note: Also referred to as sexual
  individual’s behavior, clothing,        characteristics.]
  speaking style, etc.

        Intersectionality                              Sexual
                                                     Orientation
Term first coined by Kimberlé
Crenshaw to explain the                   This term refers to the sex(es) and
interconnected nature of social           gender(s) an individual is attracted
categorization (i.e. race, class,         to romantically, emotionally, and
gender) which create overlapping          sexually.
and interdependent systems of
discrimination and disadvantage.

                                                                                   9
INTRODUCTION
GOAL & SCOPE
This Report is created in partnership with the Mayor’s Office of the City of Los Angeles to provide
a foundation to measure gender equity within the City Hub and Network for Gender Equity’s
(CHANGE) international cities. CHANGE’s mission is to empower women in all their diversity by
creating systemic change that transforms government services and systems to benefit all. This
Report proposes thematic sets of critical indicators with accompanying detailed justifications all
aimed at tracking progress on gender equity in cities around the world. The data collected from
these indicators can inform cities on their progress toward gender equity, giving cities the ability
to identify disparities and implement initiatives across city operations. The proposed indicators
provide cities with tools to assess, address, and track systems of gender equity - moving beyond the
gender binary to create change in the best interest of all.

Included in this Report is a series of top priority indicators, as well as an appendix of additional
indicators to consider. Each indicator focuses on areas of gender-based disparities within six
thematic areas of city-life where gender equity issues manifest. The thematic areas are as follows:
Health & Related Services; Economics, Labor & Well-being; Schooling & Education; Gender-Based
Violence & Security; Governance & Public Life; and Built Environment. The conceptual framework for
each thematic area will be further explained within their dedicated section of the Report.

ALIGNMENT WITH SDG 5
& CHANGE NETWORK
The top priority indicators proposed within this
Report seek to localize the broader goals of
Sustainable Development Goal 5: Achieve gender
equality and empower all women and girls, within the
context of the CHANGE of global cities. This Report
is also heavily influenced by the United Nations’
Convention on the Elimination of All Forms of
Discrimination Against Women (CEDAW).

Achieving gender equality is the foundational
principle of the CHANGE; therefore, each indicator
proposed within this Report aims to expand upon
city-level practices and policies proposed by the Sustainable Development Goals (SDGs) and
CEDAW. Gender equality has traditionally been referred to as the equal rights, responsibilities,
and opportunities of people of all genders.1 Our team has chosen to expand the concept of
gender equality to the more inclusive term of gender equity, which provides the framework
to achieve equality. As such, we define gender equity as fairness in treatment for all people
according to their respective needs. This may include equal treatment, as well as treatment

1 “OSAGI Gender Mainstreaming - Concepts and Definitions.” United Nations Entity for Gender Equality and the
Empowerment of Women, United Nations, www.un.org/womenwatch/osagi/conceptsandefinitions.htm.

                                                                                                               10
that is different but considered equivalent in terms of rights, opportunities, outcomes, and
benefits.2
The alignment with the SDGs and CEDAW allows us to communicate local, city-based impacts
on a global scale. CHANGE indicators harness the collective power of cities, identifying gender-
based disparities and creating a level playing field to ensure equal access to opportunities and
services, regardless of gender. These indicators illuminate opportunities and areas of focus for
city-lead initiatives that will improve services and care across city operations. Within this work,
CHANGE indicators explicitly recognize and address intersecting inequalities predicated upon
race, religion, ethnic origin, disability, sexual orientation, and gender identity and expression.
Cities may wish to consider other aspects of identities based on their local context.
WHAT IS AN INDICATOR?
The indicators proposed within this Report aim to
provide cities with data that can be used to analyze
the state of gender equity within various contexts.
Indicators themselves are created to categorize and
target pertinent issues—in this case gender equity—
within a society.3 Through the use of indicators, the
complexities of gender inequity can be distilled down
to issues of data. In utilizing this indicator-driven data,
cities are better able to identify and combat issues of
gender inequity.4
To further organize the data collection process, this
Report groups indicators of similar themes and
outcomes into clusters. A cluster is an intentionally
broad, thematic indicator group that provides several
options of indicators from which cities can choose.
This flexibility acknowledges the diverse contexts and
differing data collection processes of cities within the
CHANGE network. This arrangement allows cities the
ability to measure processes in ways that best fit their local contexts.
Beyond the organization of data into clusters and indicators, it is essential to remember
that these indicators address intricate social issues that should be interpreted through an
intersectional lens. To avoid an oversimplification of the issues at hand, the indicators within
this Report are often disaggregated by SOGIESC: an acronym for sexual orientation, gender
identity, gender expression, and sex characteristics. This Task Force found SOGIESC - which
is more thoroughly defined in the Key Terms section of this Report - to be one of the most
2 “Gender Equity Vs. Gender Equality: What’s the Distinction?” Pipeline Equity, 5 Feb. 2018, www.pipelineequity.com/
voices-for-equity/gender-equity-vs-gender-equality/.
3 Merry, Sally Engle. “The Seductions of Quantification: Measuring Human Rights, Gender Violence, and Sex Trafficking.”
In The Seductions of Quantification: Measuring Human Rights, Gender Violence, and Sex Trafficking, 1–26. Chicago, IL: The
University of Chicago Press, 2016.
4 Ibid.
11inclusive gender-based methods for disaggregation. In practice, disaggregating by SOGIESC
invovles data collection in the critical areas of sexual orientation, gender identity, gender
expression, and sex characteristics - all of which may interesect. Although the tools do not
yet exist to disaggregate data in this manner, one of the aims of this Report is to look beyond
what is currently available, and provide cities with the foundation upon which gender equity
can become more intersectional.
Dangers of Indices & Data Collection
In creating this Report, we acknowledge the dangers of data collection and the potential harm
that index-based Reports can create. In this section, we focus on three potential areas of
harm: the myth of objectivity, expertise inertia, and harm to marginalized communities.
Myth of Objectivity
Index-based projects (including this Report), are typically viewed as unbiased and nonpolitical
both by their creators and users. In reality, indicators are deeply shaped by the institutions
and resources from which they are proposed. Indicators are built on a “string of interpretive
decisions” which are neither unbiased nor nonpolitical.5 When indicators are removed
from the institutional context in which they are created, they risk losing vital background
information and compromises made during the creation, justification, and/or collection
processes. This myth of objectivity can lead to potentially harmful impacts on the groups that
the indicators aim to serve. Furthermore, when data and its collection methods are viewed
as completely objective, it overlooks the biases inherently embedded into the indicator
creation process. As a result, conclusions drawn from data can be used to perpetuate harmful
stereotypes, practices, and stigmas against the groups studied. 6
Expertise Inertia
Individuals who have a say in proposing indicators are typically of the same social, economic,
and ethnic background. Therefore, the final product can overlook inclusive measurements
and individual experiences. The phenomenon of wealthy and educated elites driving the
production of indicators meant to protect those less fortunate is known as “expertise
inertia”.7Expertise inertia highlights the complexity of data representation when someone’s
identity or experience does not fall into a specific one-dimensional-identifying box. When data
is not disaggregated, it is likely that many populations will be excluded from the indicators and
protective policies which come out of that data collection process. If, for example, an indicator
finds that the literacy rates of schoolchildren are improving but does not disaggregate by
socioeconomic status, it could be possible that the improvements of wealthier children with
greater access to resources are skewing the data and hiding the needs of children who are
lower income. For these reasons, it is extremely important for indicators to align with the
experiences of all populations, not just those of privileged policymakers and researchers.8
5 Merry, Sally Engle. “The Seductions of Quantification.”
6 Inga Winkler & Margaret Satterthwaite, “Leaving no one behind? Persistent inequalities in the SDGs,” The International
Journal of Human Rights 21, no. 8 (2017).
7 Merry, Sally Engle. “The Seductions of Quantififcation.”
8 Merry, Sally Engle. “The Seductions of Quantififcation.”
12Marginalized Communities
Inclusive data collection is essential to the success of any project; however, the challenges
inherent in research processes have the potential to further harm targeted groups.9 Data
collection on these groups can reinforce stigmas and unequal power relations within
societies, and conversely influence marginalized communities against participation in data
collection efforts. Fear of further discrimination and harms by data collection can also
dissuade individuals from self-identifying in research studies, making it nearly impossible
for researchers to adequately measure and respond to issues unique to certain identities.
In order to address these power dynamics, it is critical that more robust support and
information dissemination is provided to marginalized communities.10 Researchers must work
to overcome historical structures of oppression and injustice, and move toward practices that
honor community and result in shared power between all.11
POSITIONALITY STATEMENT
We recognize that the process of creating indicators is not unbiased and is shaped by social
processes - including power relations. This positionality statement serves as an intentional,
self-reflective, and critical space to consider the way in which our identities, values, and
personal experiences inform the creation of this Report and subsequent indicators therein.
This Report has been crafted by a twelve-member student task force from Occidental College,
a private undergraduate academic institution located in Los Angeles, CA. As such, many of
us come to the project with a research and academic-biased lens that has historically been
built on the exploitation of “research subjects” for the benefit of the researcher and research
institution. We seek to remedy this by informing ourselves on the dangers of research and
data collection on local communities, and dedicate a section of our Report to these findings.
We also seek to maintain “Do No Harm” principles throughout our research and report writing
process, but concede that despite our best attempts to minimize harm by tuning into concepts
such as intersectionality (Kimberlé Crenshaw’s idea of the interconnecting and compounding
way forms of oppression interact), harm may inadvertently occur.
Furthermore, we acknowledge that many task force members are not full-time residents
of CHANGE network cities and all are primarily based in the United States. While our
methodology includes investigating the work of current and prospective CHANGE network
city-members, we remain aware that due to a lack of lived experiences in these cities (save
for Los Angeles, in which Occidental College is based), our understanding of the current
progress, barriers, and opportunities will be limited to that of our research findings. We
hope this Report will provide a foundation on which cities can begin to expand the scope of
gender equity measures, and find innovative ways to recognize, center, and cater to various
intersecting identities.
9 Sevelius, Jae M., et al. “Research with Marginalized Communities: Challenges to Continuity During the COVID-19
Pandemic.” AIDS and Behavior, vol. 24, no. 7, 2020, pp. 2009–2012., doi:10.1007/s10461-020-02920-3.
10 Ibid.
11 Wallerstein, Nina, et al. “Power Dynamics in Community-Based Participatory Research: A Multiple–Case Study
Analysis of Partnering Contexts, Histories, and Practices.” Health Education & Behavior, vol. 46, no. 1_suppl, 2019,
doi:10.1177/1090198119852998.
13ANALYSIS OF EXISTING
GENDER EQUITY INDICES
Various international groups have created indices intended to produce data that can
measure gender equity to some extent. These include the UN Minimum Set of Gender
Indicators, the European Institute for Gender Equality Index, the UN Development
Programme LGBTI Inclusion Index, and the Orgganization for Economic Cooperation
and Development (OECD) Gender Data Portal. This section is dedicated to reviewing
these four indices and their alignment with SDG 5 on Gender Equality. These indices
informed the formation of the thematic areas and many of the indicators in this Report.
Through conducting this analysis of existing indices, we were able to identify gap areas
that this Report aims to fill. Mainly, we identified a lack of consistent commitment
to intersectionality and a failure to measure gender beyond the binary. Additionally,
although not a fault of these indices, they all aim to measure gender equity at the
international level. Emerging from these observations and subsequent research are
this Report’s proposed indicators, which aim to encourage an intersectional approach to
measuring gender equity in local contexts, specifically in cities.
REVIEW OF EXISTING GENDER EQUITY INDICES
Index UN Minimum EIGE Index LGBTI OECD Gender
Gender Indicators Inclusion Index Equality Data
Thematic Economic Work, Money, Health, Employment, Ed-
Areas Structures, Knowledge, Education, Civil ucation, Entrepre-
Education, Health Power, Time, and Political neurship, Health,
and Related Health, Violence Participation, Development,
Services, Public Against Women, Economic Well- Governance
Life and Decision Intersecting being, Security
Making, Human Inequalities and Violence
Rights of Women
and Girl Children
Intersectional No Yes* Yes No
Lens
Rejects No No Yes No
Gender Binary
Total # of 63 31 51 34
Indicators
Specific Focus N/A N/A LGBTI Inclusion Economic Devel-
opment
* This index has an intersectional lens but excludes non-gender binary conforming individuals
and other identities like race.
14EIGE GENDER EQUALITY INDEX
The Gender Equality Index was produced in 2013
by the European Institute for Gender Equality (EIGE)
in order to strengthen gender equality across the
European Union.1 With this index, EIGE is able to
inform and support policy makers as they seek to
design more effective gender equality measures. The
Gender Equality Index includes six core domains, two
additional domains, and 31 indicators. The six core
domains include: work, money, knowledge, power,
time, and health, with the additional two domains
being violence against women and intersecting
inequalities.
The main strength of the Gender Equality Index is
its focus on intersecting inequalities. Specifically, the
index examines how “disability, age, level of education,
country of birth, and family type,” intersect with gender to affect people differently.2 However,
they failed to include race as an intersection. The inclusion of race is vital to any intersectional
analysis of equity. Other identities to consider are migratory/citizenship status, religion, and
class. The main limitation of the EIGE’s index is its adherence to the gender binary. Due to
this, other gender identities and sexual orientations are excluded from the indicators and
data. The index also does not disclose whether people with gender identities beyond men
and women were included in the comparisons, thus obscuring the experience of people who
identify outside the gender binary. Additionally, the index relies on parity as a goal. Parity is
often conflated with equality, ignoring differing opportunities and ultimate outcomes. For
example, while women might outpace men in college graduation rates, that doesn’t mean
they occupy more high paying or degree-oriented industries. The indicators proposed later
in this Report aim to avoid a reliance on parity, recognizing that systemic change prioritizes
equity, considering not only outcomes but also opportunity.
LGBTI INCLUSION INDEX
The LGBTI Inclusion index was published in 2019 by the United Nations Development
Programme (UNDP) in collaboration with the World Bank, as well as various LGBTI rights
organizations, experts from human rights and development agencies, businesses, academia,
and civil society members.3 The LGBTI Inclusion Index aims to “measure development
outcomes for LGBTI people and inform policies, programmes and investments for
1 European Institute for Gender Equality, “Gender Equality Index,” https://eige.europa.eu/gender-equality-index/2020,
accessed April 2, 2021.
2 European Institute for Gender Equality, “Gender Equality Index: Intersecting Inequalities,” https://eige.europa.eu/
gender-equality-index/2020/domain/intersecting-inequalities, accessed April 2, 2021.
3 United Nations Development Programme, “LGBTI Index,” https://www.undp.org/content/undp/en/home/librarypage/
hiv-aids/lgbti-index.html, accessed April 2, 2021.
15strengthening LGBTI inclusion and rights.”4 The index includes 51 indicators “in line with the
SDG global indicator framework,” and separated into the thematic areas of health, education,
civil and political participation, economic well-being, and security and violence.5 The index
prioritizes the following: (1) comparing the overall degree of inclusion across countries; (2)
measuring progress toward inclusion over time within countries, regions, or globally; (3)
setting benchmarks for countries to achieve new levels of inclusion; and, (4) demonstrating
where resources are most needed to support sustainable human development for LGBTI
people.6 They emphasize the importance of each indicator being clearly related to an
opportunity or outcome that is relevant to the dimension it measures.
(LGBTI Inclusion Index Thematic Areas)
A strength of LGBTI Inclusion Index was its creation in collaboration with civil society actors
and sectoral group experts, which allowed for confirmation of its viability and applicability
towards relevant SOGIESC issues. A second strength of the index is its differentiation between
“opportunity measures” and “outcome measures.”7 These measures highlight the difference
between the existence of a law or policy that allows LGBTI persons to enjoy human rights,
and the de facto individual achievement of a level of health, education, economic well-being,
safety, and political and civic participation that is consistent with human dignity, respectively.
Another strength of the index is its commitment to the use of common language and
4 Ibid.
5 Ibid.
6 Badgett, M.V.L., and Sell, R. “A Set of Proposed Indicators for the LGBTI Inclusion Index,” New York: UNDP, 2018, 5.
7 Ibid, 8.
16communication across borders, so that the indicators are culturally translatable over time
and place.8 The index also provides a list of abbreviations and definitions at the beginning
of the report, recognizes intersectionality and the need for disaggregation of data, and
acknowledges the need for agreed-upon guidelines of data collection for the safety of
subjects.
In terms of weaknesses, although the index encourages intersectionality, it fails to reference
pansexuality or indigenous gender expression variants. Additionally, the indicator data
table includes a section on the feasibility of measurement, despite acknowledging that,
“no country has data on a representative sample of the population or of LGBTI people that
can disaggregate outcomes by sexual orientation, gender identity & expression, and sex
characteristics.”9 Thus, the need to use data precedent could potentially lead to a narrower
scope of the data pooling and limit the index’s impact.
OECD GENDER EQUALITY DATA
The Organisation for European Cooperation and
Development’s (OECD) “Gender Equality” data
portal has 6 general thematic areas: employment,
education, entrepreneurship, health, development,
and governance.10 These categories feature 64
various indicators that compare data between
women and men, frequently disaggregated by age. All countries who make up the OECD
record data for each indicator and this data is grouped to compare not only women and men
within the country, but also for cross-country comparison.
The overall assumption that seems to drive OECD’s gender data portal is that the inclusion
of women in the economy will increase economic development for the entire country, thus
providing an incentive to be proactive on these measures. Benefits for the economy would
include better social security services, higher family incomes, and improved tax/benefit
policies. This focus may affect the data since gender equality is treated as a means to reach
economic development rather than treating gender equality itself as the desired outcome in
mind when creating the indicators.
OECD has mostly raw data on the site, which can be useful for countries as this minimizes bias
and manipulation in how the data is represented. However, it may lack the clarity regarding
the desired outcome of these indicators and thus how they should be used by policymakers.
An example of a database developed using OECD statistics that avoids this issue is the
Gender, Institutions and Development Database (GID-DB) 2019.11 This is a database that
provides “researchers and policymakers with key data on gender-based discrimination in
social institutions.”12 This data, “helps analyse women’s empowerment and understand gender
8 Ibid, 6.
9 Ibid, 7.
10 OECD, “Gender Equality,” https://www.oecd.org/gender/data/, accessed April 2, 2021
11 OECD.stat, https://stats.oecd.org/, accessed April 2, 2021.
12 Social Institutions & Gender Index, “Gender Statistics: Gender, Institutions and Development Database,” https://www.
genderindex.org/statistics/, accessed April 2, 2021.
17gaps in other key areas of development.”13
The main limitation of OECD’s Gender data portal is the data’s lack of intersectionality. This
is both because the indicators are based on binary understandings of gender (they only
compare men and women and do not make clear if this includes trans people), but also
because indicators are never disaggregated by other demographic characteristics (such as
race, or socio-economic status, or citizenship). Moreover, within the larger data set, gender is
not listed as its own thematic area. Instead, indicators regarding gender equality are dispersed
among some 23 larger thematic areas. This may hinder the ability of member countries
wanting to use these indicators to apply the data easily to gender-specific policy and thus
should be given more priority within the larger set of indicators.
UN MINIMUM SET OF GENDER INDICATORS
The UN Minimum Set of Gender Indicators were
created in 2013 to serve as a metric for one or more
of the Beijing Platform for Action’s critical areas of
concern.14 However, because of the unavailability
of data, clear concepts, or definitions, three of the
twelve total critical areas of concern from the Beijing
Platform are not covered in this set of indicators.15
The Interagency Expert Group on Gender Statistics
revised the indicators in 2018 to fully align them with
the Sustainable Development Goals, their related
indicator set, and corresponding custodian agency.
In total, there are 52 quantitative indicators and
11 qualitative indicators covering the following five
categories: (1) economic structures, participation
in productive activities and access to resources, (2)
education, (3) health and related services, (4) public
life and decision making, and (5) human rights of women and girl children.16 All categories are
measured quantitatively and the economic structure, public life, and decision making, and
human rights of women and girl children categories also have qualitative measuring elements.
A main strength of the UN Minimum Set of Gender Indicators is that the data collected is
constantly updated and clearly states the custodian agencies responsible for the collection
13 Ibid.
14 “The United Nations Minimum Set of Gender Indicators,” United Nations Statistics Division, April 30, 2019, https://
genderstats.un.org/files/Minimum%20Set%20indicators%202018.11.1%20web.pdf.
15 We recognize that the Beijing Declaration and Platform for Action was predicated on the Convention on the
Elimination of All Forms of Discrimination against Women (CEDAW), and that the Beijing Platform for Action subsequently
entrusted the CEDAW Committee with monitoring its implementation. Therefore, because the UN Minimum Gender
Indicators were developed in alignment with the Beijing Platform for Action, we found it unnecessary to include a full
analysis of CEDAW in this Literature Review.
16 “The United Nations Minimum Set of Gender Indicators,” United Nations Statistics Division, April 30, 2019, pp. 2,
https://genderstats.un.org/files/Minimum%20Set%20indicators%202018.11.1%20web.pdf
18and dissemination of such data. The rate at which information and data are collected and
analyzed on their website makes the data accessible and effective. The main limitation of this
data is that these 63 indicators do not explicitly state a goal. They must be applied directly
to the methods of the Beijing Platform for Action or the Sustainable Development Goals
in order to be useful. Because the indicators must be connected to these other projects,
the user needs to cross-reference multiple sources to understand the desired outcome of
the indicators, which negatively affects the political utility of the data. Another limitation of
these indicators is their reinforcement of the gender binary and lack of intersectionality.
Although the indicators are disaggregated by sex, age, and persons with disabilities, further
disaggregation (by race, ethnicity, or socioeconomic status for example) would improve the
data and its application.
CONCLUSION
The strengths of the indices include a focus on intersectional frameworks and disaggregation
(albeit inconsistent), and clear prioritization of indicators based on criteria such as feasibility
and adaptability. While the limitations of each index differ depending on its specific focus, an
overall limitation to the current landscape of gender equity indices is the lack of consistency in
commitment to intersectionality, and failure to measure beyond the gender binary. Although
we have attempted to replicate and localize the strengths of the existing indices where
possible, this project aims to fill observed gaps by suggesting indicators that can be applied to
city contexts, have the potential to create systemic change, move beyond the gender binary,
and are ultimately outcome-oriented in relation to gender equity.
19METHODOLOGY
The goal of this Report is to create a set of research-based indicators for measuring gender equity
across the CHANGE network’s cities. The data collected from these indicators can inform cities on
their progress toward gender equity, allowing for local governments to implement more inclusive
initiatives across city operations. Here, we outline our methodology for creating these indicators.
GUIDING VALUES
The following values of gender-inclusivity and intersectionality guided the manifestation and
prioritization of indicators recommended in this report. By choosing to disaggregate by using
SOGIESC, we aspire to encapsulate gender-inclusivity and intersectionality throughout all
indicators included in this report.
Gender-Inclusivity
Throughout our report, the team used a gender inclusive lens, employing language
that transcends the traditional gender binary that is still often the default approach in
public policy. We recognize that data has been collected in a binary fashion for years
and it will take time and dedication to progress past this limitation. When creating our
indicators, the task force attempted to advance gender-inclusive language in a way that
does not discriminate against a particular gender identity nor further perpetuate gender
stereotypes.1 Overall, we recognize that given the fundamental role of language in
framing social and cultural attitudes, using gender-inclusive language is an influential way
to promote gender equality and eradicate gender bias.
1 United Nations. n.d. “Guidelines for gender-inclusive language in English.” United Nations gender-inclusive
language. https://www.un.org/en/gender-inclusive-language/
Intersectionality
The Combahee River Collective’s “A Black Feminist Statement” (1977) articulated an
understanding of identity that is “multiply shaped by their shared social location as
African American women within interlocking systems of oppression.”2 This conception
of identity which recognizes how systemic oppressions such as racism, patriarchy and
capitalism interlock, informed Kimberlé Crenshaw’s coining of the term intersectionality.
Intersectionality explains the interconnected nature of social categorization (i.e. race,
gender, class) which creates overlapping and interdependent systems of discrimination
and disadvantage.3 Further disaggregation in data reporting is necessary to reflect
the intersectionality of social characteristics and how they impact lived realities for
diverse gender identities. Applying a lens of intersectionality is especially pertinent to
this work because although the proposed indicators are divided into thematic areas to
characterize topics and promote organization, the indicators are inherently related and
cannot function in isolation. To this point, we recommend looking at the indicators not in
isolation, but rather noting their synergies. In order to promote intersectionality, the Task
Force worked on a shared document to monitor overlap and ensure that the indicators
capture the breadth of identities people hold.
2 Patricia Hill Collins and Sirma Bilge, Intersectionality, 2nd Edition, Cambridge: Polity Press, 2020, pp. 169.
3 Columbia Law School. “Kimberlé Crenshaw on Intersectionality, More than Two Decades Later.” (See Glossary)
20GENERATION OF THEMATIC AREAS
Analysis of Existing Gender Equity Indices
The Task Force conducted an analysis of existing global gender indices with the purpose of
identifying major trends to frame the generation of our thematic areas. Through a critique
of these indices, we were able to further research how to generate, localize, and prioritize
indicators using a gender perspective.
Following a review of the aforementioned global indices and international conventions,
the Task Force compiled a list of thematic areas that best addressed gender equity. Here,
the group found significant overlap in the areas of “Education,” “Health,” and “Economic
Development and Well-being.” With these three thematic areas secured, the group then
consulted relevant academic literature, human rights organizations, and international indices
to consolidate the remaining categories into thematic areas. Through this process the Task
Force proposed “Gender Based Violence & Security” as well as “Governance and Public Life” as
two more thematic areas.
From here, the team began to refine pre-existing categories, as well as the language used in
our thematic areas. The ambiguity of certain terms such as “Well-being”4 directed the Task
Force to form our final thematic area. “Built Environment” includes housing, transportation,
access to greenspaces, environmental issues and homelessness. With this new thematic
area, we decided to rename “Economic Development and Well-being” to “Economic, Labor
and Well-being,” which would encompass work
and workplace culture, food security, water,
sanitation, hygiene, and other goods and services
that the city can provide. During this process,
the task force also identified Legal Protections
as a possible thematic area, but decided instead
to mainstream legal protections through the
thematic areas to reflect that legal protections are
necessary in all aspects of city life. Indicators of
legal nature are marked with a diamond symbol
(◊) before the indicator number.
Finally, the Task Force solidified 6 thematic areas
based on research on global indices. The areas
are as follows: Health and Related Services;
Economics, Labor, and Well-being; Schooling and
Education; Gender-based Violence & Security;
Governance & Public Life; and Built Environment.
4 The term ‘well-being’ could be applied to many issues outside of economic development such as transportation and
housing. Since ‘well-being’ is so similar to ‘quality of life,’ the category became too broad and required further synthesis.
The group then considered the possibility of framing well-being as its own indicator under each separate category, but
ultimately decided that a new, separate category would better encompass housing, transportation, and other urban
issues.
21Generation of Indicators
The task force compiled and consolidated data on potential indicators, assessing for ability
to localize indicators to CHANGE cities. We collected data through the application of existing
gender equity indices to specific thematic areas, conducting further research on other
literature and indices within the international arena, and researching CHANGE cities. This
informed the language, applicability of indicators within the network, and proper localization.
Localization
Throughout the localization process, the Task Force thought about the proposed indicators
in regard to what they meant for cities. Given that these indicators are created for CHANGE’s
international cities, it was important to adapt language to fit city jurisdiction, and use terms
that were applicable to as many city contexts as possible. This is one reason for the inclusion
of terms such as SOGIESC, that are able to include many diverse identities and be used across
city, state, and national lines.
Prioritization
During the prioritization process, the Task Force created a comprehensive set of prioritization
criteria to sort the indicators between Priority One and Two. The criteria are as follows:
Prioritization Criteria:
1. References: Is the topic referenced in other indices, SDGs, and/or CHANGE cities’ work?
2. City Jurisdiction: Are there potential policy interventions at the city level?
3. Data: Is the indicator measurable? Are the data available?
4. Outcome Oriented: Is there a clear, systemic outcome that is clearly related to gender
equity?
5. Applicability: Is the indicator flexible across various cultural contexts?
Prioritization One Prioritization Two
Prioritization One includes Indicators listed as Prioritization
indicators that meet all or most Two did not meet critical aspects
of the criteria listed above. These of the team’s prioritization criteria,
indicators are measurable within but have potential for further
the scope of CHANGE, outcome workshopping and improvements.
oriented with a potential for Indicators in this category will only
addressing gender disparities, and be included in the final appendix
can be localized to create systemic table of the Report.
change in various city contexts.
These are the indicators captured
in the below discussion.
22THEMATIC AREAS
AND INDICATORS
INTRODUCTION
The following 52 indicators were created to encompass and highlight data-driven ways to
measure gender disparities within the local context while providing appropriate outcome
oriented pathways towards the creation of gender equity at the city level, which includes, but
is not limited to, impacts on city infrastructure, public policy, presence of women and LGBTI
people in places of leadership, and equitable access to resources. The indicators encompass
a variety of thematic areas relating to gender equity, including Health, Economics & Well-
being, Education, Gender-based Violence & Security, Governance & Public Life, and Built
Environment. Many of the 52 indicators are qualitative, requiring cities to report on simply
the existence of certain policies, protections, etc. Because the aim of this Report is to provide
cities with indicators that can measure gender equity beyond the gender binary, and the
reality that data on sexual oritentation, gender identity, and sex characteristics is not widely
available, we hope that the number of qualitative indicators can serve as a bridge for cities
to report on what they can in pursuit of eventually collecting SOGIESC-disaggregated data.
23RELATED SERVICES
HEALTH &
HEALTH &
RELATED SERVICES
Within the thematic area of Health and Related Services,
there are many systemic barriers that make health an
essential area of focus when measuring gender equity. In
connection to the Convention on the Elimination of All Forms of Discrimination Against
Women and Sustainable Development Goals 3 and 5.6, Health and Related Services
is a category that encapsulates individual outcomes, household decision-making, and
overall opportunities available in cities.
These indicators aim to address the distinct needs of women and gender non-
conforming individuals by identifying the structural barriers to inclusive and accessible
health-related services, and presenting opportunities for intervention. In order to
measure and address the structural barriers to health equity, most indicators are
framed around access to health services, with the desired response being policy
to remove barriers and increase access for all. Accessibility to health and wellness
resources serves as a large avenue for empowerment.
Indicators of legal nature
are marked with
a diamond symbol
(◊) before
the indicator number.
24Self-Perceived Health
(1.1) Percentage of population
who report their health to be
fair to poor, disaggregated by
SOGIESC, race, and age
Self-perceived health has been
used as a proxy to illustrate a
respondent’s overall satisfaction
with their healthcare.1 How a
person perceives their health can
tell us more about broader systems’
efficacy.2 Additionally, self-perceived
health functions as a good proxy for
quality of life and objective health.3
Overall, women consistently self-
report worse health, and that gender
gap increases with age.4 Also according to the American Public Health Association, “in
comparison with cisgender individuals, transgender individuals had a higher prevalence of
poor general health”5 making this relevant focus of gender equity in health.
Relevant References: EIGE Gender Equality Index, Barcelona Health Indicators6
1 Pavitra Paul, Mihran Hakobyan, and Hannu Valtonen, “The Association between Self-Perceived Health Status and
Satisfaction with Healthcare Services: Evidence from Armenia,” BMC Health Services Research 16, no. 1 (February 19,
2016): 67, https://doi.org/10.1186/s12913-016-1309-6.
2 Thompson, Terry, Jamie A. Mitchell, Vicki Johnson-Lawrence, Daphne C. Watkins, and Charles S. Modlin. “Self-Rated
Health and Health Care Access Associated With African American Men’s Health Self-Efficacy.” American Journal of
Men’s Health 11, no. 5 (September 1, 2017): 1385–87. https://doi.org/10.1177/1557988315598555.
3 Bjorner JB, Fayers P, Idler E. Self-rated health. In: Fayers P, Hays R, editors. Assessing Quality of Life in Clinical Trials.
Oxford: Oxford University Press; (2005). p. 309–23 [Google Scholar]
4 “Self-Perceived Health Statistics - Statistics Explained,” Eurostat, December 17, 2020, https://ec.europa.eu/eurostat/
statistics-explained/index.php/Self-perceived_health_statistics#Self-perceived_health.
5 Meyer, Ilan H et al. “Demographic Characteristics and Health Status of Transgender Adults in Select US Regions:
Behavioral Risk Factor Surveillance System, 2014.” American journal of public health vol. 107,4 (2017): 582-589.
doi:10.2105/AJPH.2016.303648.
6 Observatori de Salut i Impacte de Polítiques. “Mala Salut Percebuda.” Accessed April 5, 2021. https://ajuntament.
barcelona.cat/observatorisalut/estat-de-salut/indicadors/mala-salut-percebuda.
25Sexual and Reproductive Health
(1.2) Percentage of population diagnosed with HIV/AIDs, disaggregated by
SOGIESC and age
Lowered access to information, tools of prevention and
barriers to the negoitation of
safer sex are all structural barriers
that illustrate how HIV/AIDs is a
gender equity issue.7 Additionally,
HIV is a distinct concern for LBTI
communities, as transgender
women are 49x more at risk for HIV
compared to the general population,
and “while transgender men are
less likely to be HIV positive than
transgender women, their rates of
infection are still higher than that
of the general population.”8 Overall,
HIV rates can reflect systemic
factors of gender inequalities such
as: harmful gender norms, violence
based on SOGIESC, barriers in
access to services, the burden of
care, stigmas and discrimination,
the lack of economic security and
the lack of education.9
Relevant References: LGBTI Inclusion Index, UN Minimum
Set of Gender Indicators
(1.3) Pregnancy/Delivery, or Maternal Mortality Ratio (MMR), disaggregated by
SOGIESC, race, and age
Tracking MMR is important because it indicates the quality of care during delivery and
pregnancy. This is an important systemic assessment, since “most maternal deaths are
preventable, as the health-care solutions to prevent or manage complications are well
known,” and the presence of a high MMR itself is an intersectional manifestation of
disparities in health care.10 Furthermore addressing high MMR “requires the elimination of
7 UN Women. “What We Do: HIV and AIDS.” Accessed March 12, 2021. https://www.unwomen.org/what-we-do/hiv-and-
aids.
8 HRC. “Transgender People and HIV: What We Know.” Accessed March 1, 2021. https://www.hrc.org/resources/
transgender-people-and-hiv-what-we-know.
9 “Technical Guidance for Global Fund HIV Proposals Cross-Cutting Issues Addressing Gender Inequalities: Addressing
Gender Inequalities: Strengthening HIV/AIDS Programming for Women and Girls.” WHO, n.d. Accessed March 2, 2021.
10 WHO. “Maternal Mortality,” September 19, 2019. https://www.who.int/news-room/fact-sheets/detail/maternal-
mortality.
26discrimination and violence against women -- in short it is a matter of human rights.”11 This
indicator aims to parallel the goals and methodology of MMR measurement by LA County,
Sierra Leone and the UN Minimum Set of Gender Indicators, but has adjusted the title to
pregnancy/delivery mortality ratio to be inclusive of parents who don’t align with “maternal”
or mother.
Relevant References: UN Minimum Set of Gender Indicators, LA County Health Indicators
for Women, The Sierra Leone National survey,12 SDG 3.1.1
Access to Wellness and Health Resources
(1.4) Number of vendors/ grocery stores selling fresh fruit and vegetables within
walking distance
Typically, nutrition is assessed through malnutrition
and obesity indicators, but this indicator pivots to
focus on the systemic issue of access to nutritious
and affordable food. The ability to find nutritious
foods, particularly fresh fruits and vegetables, is
often directly influenced by one’s socioeconomic
status and the neighborhood resources their
community attracts. As such, this indicator
allows for the discussion of “food deserts”13
and the inequitable distributions of resources
based on race and class. In connection to gender
equity initiatives, this indicator recognizes that
women and gender non-conforming people are
more likely to be impoverished, and thus face
food insecurity or access to low-quality food at
higher rates. Furthermore, the responsibility of
collecting and preparing food is heavily influenced
by gender roles, and therefore, the distance
and inaccessibility of food exacerbates existing
disparities of unpaid labor across gender.
Relevant References: Building Research Establishment’s International Healthy Cities
Indices (BRE HCI)
11 Women’s Rights and Gender Section, OHCHR Research and Right to Development Division and Rule of Law,
Equality and Non-Discrimination Branch. “Maternal Mortality and Morbidity and Human Rights.” Office of the High
Commissioner for Human Rights The United Nations, August 2013. https://www.ohchr.org/Documents/Issues/Women/
WRGS/OnePagers/Maternal_mortality_morbidity.pdf.
12 “Sierra Leone Demographic and Health Survey 2019.” Sierra Leone Ministry of Health and Sanitation, 2019. https://
dhsprogram.com/pubs/pdf/PR122/PR122.pdf.
13 A food desert is an area where it is difficult to access affordable, nutritious, fresh foods. These areas are
traditionally found in urban settings of lower socioeconomic status.
27You can also read