Measuring the Economic Significance of the U.S. Potato Industry - William Knudson & Steven R. Miller

Page created by Yvonne Bennett
 
CONTINUE READING
Measuring the Economic Significance of the U.S. Potato Industry - William Knudson & Steven R. Miller
Measuring the Economic
Significance of the U.S.
    Potato Industry

                P R E PA R E D BY
    William Knudson & Steven R. Miller
              February 2023

               Measuring the Economic Significance of the U.S. Potato Industry | 1
Measuring the Economic Significance of the U.S. Potato Industry - William Knudson & Steven R. Miller
Letter from our President
                                                                                                                                                                           On behalf of the National Potato Council (NPC) and the
                                                                                                                                                                           growers we represent, I’m pleased to offer this exciting
                                                                                                                                                                           and impactful insight into the U.S. potato industry and its
                                                                                                                                                                           contributions throughout the American economy.

                                                                                                                                                                           This analysis marks the first time any organization has
                                                                                                                                                                           measured and reported on the national economic impact
                                                                                                                                                                           of America’s favorite vegetable.

                                                                                                                                                                           Given its prominence in our diet and wellbeing, potatoes
                                                                                                                                                                           provide a significant contribution to America’s economic
                                                                                                                                                                           activity, including direct activity (growth, processing,
                                                                                                                                                                           wholesaling, and retail) and job creation—making

Contents
                                                                                                                                                                           potatoes an essential component of our prosperity as
                                                                                                                                                                           a nation built and sustained by potato growers who
                                                                                                                                                                           indirectly put people to work in every city and town
                                                                                                                                                                           across our great country.

Letter from our President............................................................................................3           The U.S. potato sector is vital to America’s economic lifeblood, generating an estimated $100.9
                                                                                                                                 billion in economic activity in 2021 alone. Our sector is responsible for supporting an estimated
Executive Summary.....................................................................................................4
                                                                                                                                 714,000 domestic jobs and providing wages of $34.1 billion annually to those employed along
I. Introduction..............................................................................................................7   our supply chain. An impressive 0.4% of the entire U.S. workforce relies on our industry for their
II. The Supply Chain for Potatoes................................................................................9               livelihoods, contributing $53 billion towards annual GDP growth.

III. International Trade...............................................................................................14        I want to thank the economists and researchers at Michigan State University for this analysis.
IV. Data and Methods for Estimating Economic Contributions..................................17                                   The staggering results of this study are reinforced by the fact that potatoes are the number one
                                                                                                                                 consumed vegetable by U.S. consumers annually and are a beneficial source of vitamins and
V. Economic Contribution Estimates.........................................................................22
                                                                                                                                 minerals in all diets.
VI. Summary and Conclusion....................................................................................23
                                                                                                                                 Thanks to U.S. potato growers, our partners and workers up and down the supply chain, and the
References................................................................................................................26
                                                                                                                                 consumers who love our products, America is indeed a spud nation.

                                                                                                                                 Sincerely,

                                                                                                                                 RJ Andrus
                                                                                                                                 TBR Farms, Idaho Falls, Idaho
                                                                                                                                 President, National Potato Council

                                                                                                                                                                         Measuring the Economic Significance of the U.S. Potato Industry | 3
Measuring the Economic Significance of the U.S. Potato Industry - William Knudson & Steven R. Miller
Executive Summary                                                                                       The 2021 total economic contribution of the potato sector is estimated to be

                                                                                                              $100,900,000,000+

    This analysis assesses the national economic          businesses. These jobs command about $34.1
    contribution of the potato sector on the United       billion in wages and salaries per year and
    States. It also analyzes the supply chain for         contribute $53.5 billion to the annual gross
    potatoes and the level of exports and imports         domestic product (GDP) of the United States.
    of potatoes and potato products. The 2021             To place these findings into context, about 0.4
    total economic contribution of the potato             percent of the U.S. domestic workforce
    sector is estimated to be $100.9 billion. The         is supported by the domestic potato industry
    contribution stemming from farm production            supply chain.
    makes up about $10.8 billion. These estimated
                                                          The potato industry entails a wide spectrum of
    economic contribution estimates entail $37.2                                                                                The U.S. potato sector is responsible
                                                          activity, from agricultural production, through                           for generating an estimated
    billion direct economic activity arising from

                                                                                                                               714,000+
                                                          wholesaling and processing and distribution
    growing, processing, wholesaling, and retailing
                                                          ending with consumer purchases of final
    potatoes and potato products. The remaining
                                                          products through retail channels or through
    $63.7 billion is made up of indirect activity
                                                          food service providers. Farms and businesses
    from affected industries and expenditures from

                                                                                                                                       domestic jobs
                                                          producing, processing, and distributing potato
    household consumption that can be traced back
                                                          and potato products can be found in all parts of
    to activity generated by the potato sector.
                                                          the U.S. and accordingly, the potato industry is
    Total employment generated by the potato              present throughout the nation.                               which provide                                   and contribute
    sector is estimated to be in excess of 714,000

                                                                                                              $34.1 Billion                                $53.5 Billion
                                                          The U.S. is the world’s fifth largest producer,
    domestic jobs, of which approximately
                                                          and potatoes are the number one consumed
    405,000 are directly employed along the
                                                          vegetable by U.S. consumers. Potatoes are a          annually in wages & salaries                 to the annual GDP of the U.S.
    potato supply chain and more than 309,000
                                                          remarkably versatile vegetable and have many
    are employed in related industries or other
                                                          desirable characteristics that make it a staple

4 | Measuring the Economic Significance of the U.S. Potato Industry                                                                        Measuring the Economic Significance of the U.S. Potato Industry | 5
Measuring the Economic Significance of the U.S. Potato Industry - William Knudson & Steven R. Miller
food. It is rich in antioxidants, potassium, and      One quarter of those were used for sales to
    potato skins are high in fiber (UC Davis 2022). It
    is also an inexpensive source of calories which
                                                          households; the rest were allocated to other
                                                          uses. Food service is an especially important         Introduction
    is very important in developing countries where       outlet for potatoes primarily in the form of fries.
    food security is an issue.
                                                          While most potatoes grown in the U.S. are
    In the U.S., the largest producing state of           consumed domestically, foreign trade is an            While native to South America, potatoes are            are also a common ingredient in soups and
    potatoes is Idaho, followed by Washington.            important outlet for potatoes. Approximately          grown around the world. This vegetable is so           salads. Industry statistics often break out
    Other major producing states include                  20 percent of the potatoes grown or                   adaptable and vital to human nutrition that            potato utilization into three categories: at-home
    Wisconsin, Oregon, North Dakota, Colorado,            processed in the U.S. are exported either as          it is now grown throughout the Americas, all           consumption, food service, and institutional
    Minnesota, Maine, Michigan, Nebraska                  fresh or processed potatoes, though the U.S.          of Europe, south and east Asia, Australia and          utilization. The latter entails consumption at
    and California. States tend to specialize in the      both imports and exports fresh, processed and         Africa (Monfreda, Ramankutty & Foley 2008).            public institutions like schools and hospitals.
    variety categories grown, though all varieties        products derived from potatoes. Canada and            That is, potatoes are grown on six of the seven        Food service utilization makes up the largest
    are viable in every state. Many, if not most, of      Mexico are major markets for U.S. fresh and           continents.                                            use of U.S.-grown potatoes, and fries make up
    the potatoes grown in the U.S. are produced           dehydrated potatoes and Japan and South Korea                                                                the largest portion of food service uses. An
    under contract (Source Trace Systems 2020).           are major markets for U.S. frozen potatoes.           Prior to the war in Ukraine, the four largest global
                                                                                                                                                                       additional category of utilization is animal feed,
    Contracts are most pervasive for processing           Canada is a leading source of imports for             producers of potatoes were China, India, Russia,
                                                                                                                                                                       which is usually made up of grower stocks with
    potatoes, especially for potatoes grown for fries     potatoes used in processing. These Canadian           and Ukraine (USDA: Agricultural Marketing
                                                                                                                                                                       blemishes or size characteristics that make
    and chips.                                            imported potatoes may be subsequently                 Resource Center 2021). The U.S. is the world’s
                                                                                                                                                                       them less fit for human food markets.
                                                          exported as processed potatoes or in potato-          fifth-largest producer. Potatoes are a remarkably
    More than two thirds of the potatoes sold in                                                                versatile vegetable and have many desirable            Potatoes are grown throughout the United
                                                          derived products.
    the U.S. were used for processing in 2018.                                                                  characteristics that make it a staple food. It         States. The largest producing state of potatoes
                                                                                                                is rich in antioxidants, potassium, and potato         is Idaho, followed by Washington. Other major
                                                                                                                skins are high in fiber (UC Davis 2022). It is also    producing states include Wisconsin, Oregon,
                                                                                                                an inexpensive source of calories which is very        North Dakota, Colorado, Minnesota, Maine,
                                                                                                                important for food-insecure consumers..                Michigan, Nebraska and California. States tend
                                                                                                                                                                       to specialize in the variety categories grown. For
                                                                                                                Potatoes are the most consumed vegetable in
                                                                                                                                                                       example, Idaho is an important source of Russet
                                                                                                                the United States (Kantor & Blazejczyk 2020)
                                                                                                                                                                       potatoes (Idaho Potato Commission 2023),
                                                                                                                and are the only vegetable whose level of
                                                                                                                                                                       Michigan is the largest producer of potatoes for
                                                                                                                consumption is consistent with U.S. Department
                                                                                                                                                                       chips (Michigan Potato Industry Commission
                                                                                                                of Agriculture (USDA) dietary guidelines (Guthrie
                                                                                                                                                                       2022), and 80 percent of Washington’s potato
                                                                                                                et al., 2013). In addition to being cooked and
                                                                                                                                                                       crop goes to fry production (Steury 2023).
                                                                                                                eaten whole, they can be processed into a wide
                                                                                                                                                                       Regardless, all categories are viable in every
                                                                                                                variety of value-added products. Over one-third
                                                                                                                                                                       state.
                                                                                                                of U.S.-grown potatoes are processed as frozen
                                                                                                                potatoes (USDA: NASS 2022) and about 93                This analysis assesses the national economic
                                                                                                                percent of those are utilized as fries (USDA:          contribution of the potato sector for the year
                                                                                                                NASS 2022; Lucier, 2020). Fresh table-stock            2021. It also analyzes the supply chain for
                                                                                                                and potatoes for potato chips represent about          potatoes and the level of exports and imports
                                                                                                                25 and 23 percent of U.S. potato utilization,          of potatoes and potato products. The total
                                                                                                                respectively (Potatoes USA, 2021d). Potatoes           economic contribution of the potato sector

6 | Measuring the Economic Significance of the U.S. Potato Industry                                                                                        Measuring the Economic Significance of the U.S. Potato Industry | 7
Measuring the Economic Significance of the U.S. Potato Industry - William Knudson & Steven R. Miller
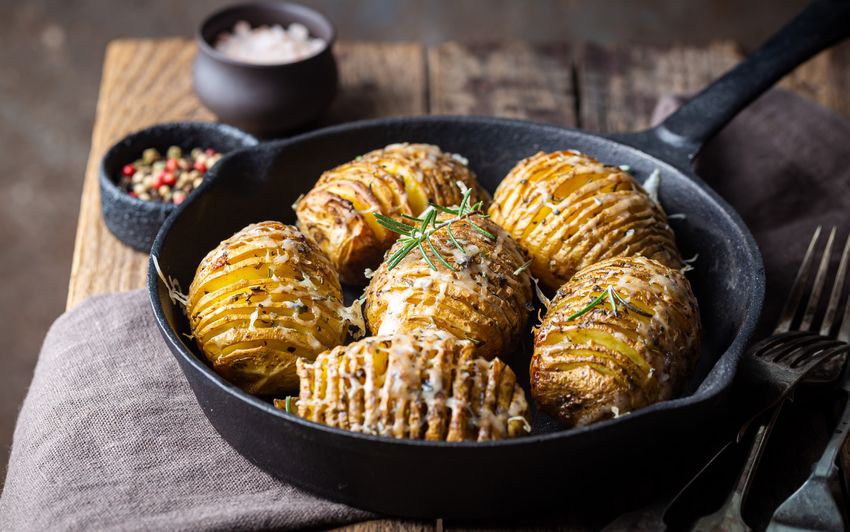
The Supply Chain of Potatoes
                                                                                                              Table 1 shows U.S. domestic production of                 restaurants from COVID-19 closures, have likely
                                                                                                              potatoes from 2009 to 2021. The data shows                placed added upward pressure on potato prices.
                                                                                                              a long-term trend of growth in U.S. domestic
                                                                                                                                                                        Table 1 further shows that farm use makes up
                                                                                                              potato production that has experienced a recent
                                                                                                                                                                        about one percent of total production. About
                                                                                                              reversal since 2019, primarily due to adverse
                                                                                                                                                                        5.5 percent of total production is used for seed
                                                                                                              weather conditions. The decline in production
                                                                                                                                                                        and approximately another 5.5 percent of output
                                                                                                              is one reason why the average farm gate
                                                                                                                                                                        is lost due to shrinkage and other factors.
                                                                                                              price of potatoes has increased from $8.90 a
                                                                                                                                                                        Potatoes remain one of the most abundantly
                                                                                                              hundredweight in 2018 to $10.20 in 2021; an
                                                                                                                                                                        available vegetable crops for U.S. consumers,
                                                                                                              increase of 14.6 percent (USDA: NASS 2022).
                                                                                                                                                                        as approximately 49.4 pounds of potatoes were
                                                                                                              The onset of war in Ukraine, the general pace of
                                                                                                                                                                        available per person in the U.S. in 2019 (Kantor
                                                                                                              U.S. and global inflation, and the re-opening of
                                                                                                                                                                        & Blazejczyk 2020).

                                                                                                              TABLE 1     U.S. Potato Production 2009-2021
                                                                                                                                Production                                              Shrinkage and
                                                                                                                   Year                               Seed (Cwt.)    Farm Use (Cwt.)                       Sold (Cwt.)
                                                                                                                                  (Cwt.)                                                 Loss (Cwt.)

                                                                                                                   2009         432,601,000           24,027,000        4,535,000        29,135,000        398,921,000

                                                                                                                   2010         404,549,000           25,100,000        4,227,000        24,996,000        375,326,000

                                                                                                                   2011         430,037,000           26,527,000        4,146,000        27,789,000        398,102,000

                                                                                                                   2012         464,970,000           25,656,000        4,850,000        28,505,000        431,615,000
    is estimated to be $100.9 billion, where farm         more than 309,000 are employed in related
                                                                                                                   2013         434,652,000           25,249,000        4,323,000        26,211,000        404,118,000
    production alone accounts for $10.8 billion.          industries or other businesses. The next section
    Estimates suggest that $37.2 billion of this          presents an overview of the U.S. domestic                2014         442,170,000           26,259,000        4,192,000        26,762,000        411,216,000
    contribution is direct economic activity resulting    supply of potatoes. The supply chain represents          2015         441,205,000           25,715,000        4,631,000        26,509,000        410,065,000
    from growing, processing, wholesaling, and            all the processes from raw material inputs to
                                                                                                                   2016         450,324,000           26,167,000        4,437,000        26,683,000        419,004,000
    retailing potatoes and potato products while          final products for human consumption. This is
    $63.7 billion is indirect activity from related       followed by a brief overview of the international        2017         450,921,000           24,673,000        4,410,000        25,139,000        421,372,000

    industries and household consumption resulting        trade of potatoes. The next section discusses            2018         450,020,000           24,973,000        4,047,000        25,526,000        420,447,000
    from activity generated along the potato sector.      the methods and data used for measuring the
                                                                                                                   2019         424,419,000           22,761,000        4,608,000        25,016,000        394,795,000
    Total employment generated by the entire              economic significance of the potato industry
    potato supply chain is estimated to be in excess      and the resulting estimates. The final section           2020         420,020,000           23,010,000        4,550,000        23,453,000        392,017,000

    of 714,000 of which approximately 405,000             summarizes the findings and concludes the                2021         409,829,000           22,158,000        3,579,000        23,367,000        382,883,000
    are directly employed in the potato sector and        report.
                                                                                                              Source: USDA, Agricultural Statistics

8 | Measuring the Economic Significance of the U.S. Potato Industry                                                                                         Measuring the Economic Significance of the U.S. Potato Industry | 9
Measuring the Economic Significance of the U.S. Potato Industry - William Knudson & Steven R. Miller
An expansive and specialized supply chain           a packing shed are washed, graded, and
                                                                                                               exists of inputs to produce potatoes. Machinery,    packaged (Madigan 2021). Potatoes that
                                                                                                               fertilizers, land, and management are common        move into storage are maintained in controlled
                                                                                                               inputs to all types of crop farming. Planting,      atmosphere facilities to preserve their quality so
                                                                                                               harvesting and processing activities require        they can be sold at a later date.
                                                                                                               specialized equipment with limited applications
                                                                                                                                                                   Potato growers often grow potatoes under
                                                                                                               for other crops. Processing and storage
                                                                                                                                                                   contract, especially potatoes grown for fries
                                                                                                               facilities are specialized for processing
                                                                                                                                                                   and chips (Source Trace Systems 2020). The
                                                                                                               potatoes and often designed to meet a variety
                                                                                                                                                                   utilization of potatoes is shown in Table 2. While
                                                                                                               of specifications for efficient processing.
                                                                                                                                                                   these figures are somewhat dated, they may be
                                                                                                               Potatoes grown for seed are particularly
                                                                                                                                                                   more reflective of the market of potatoes post-
                                                                                                               important for the potato industry and require
                                                                                                                                                                   COVID-19 than potato utilizations during the
                                                                                                               special consideration. In this, the U.S. has a
                                                                                                                                                                   pandemic.
                                                                                                               limited generation system that prevents a seed
                                                                                                               lot from being used for more than five years.       More than two-thirds of the potatoes sold in
                                                                                                               This limits the potential for disease build up      the U.S. were used for processing in 2018.
                                                                                                               (Potato USA 2022b).                                 One-quarter of those were used for sales to
                                                                                                                                                                   households; the rest were allocated to other
                                                                                                               After being harvested, potatoes either move
                                                                                                                                                                   uses. Table 3 further breaks down the processing
                                                                                                               into storage or are delivered directly to a
    While there exists a wide range of potato             Russet potatoes are popular for baking, mashed                                                           utilization of potatoes in 2016 and 2017.
                                                                                                               packing shed or processor. Those sent to
    varieties, commercial production of potatoes          potatoes, and fries. They are often purchased
    is largely focused upon a few key varieties.          by households as well as processors. Due
    Within each variety there may exist a number of       to their size, Russets are well suited for fry       TABLE 2    Potato Utilization in the U.S. 2017-2018
    sub-varieties. This is especially true for Russet     production because they have the potential to
                                                                                                                 Utilization (Cwt.)                                                      2017                   2018
    potatoes (Potato Association of America 2020).        be processed into long, thick fries (Potatoes
    Major potato variety classes, and their common        USA 2021a). Yellow potatoes are very versatile         Consumptive Sales
    uses are:                                             and are growing in popularity. They are often            Table Stock                                                    109,824,000            106,462,000
                                                          purchased by households, as are red potatoes.            Processing                                                     284,411,000            289,209,000
    • Russet potatoes: Baked or roasted, mashed,
                                                          Also, as is the case with heirloom tomatoes,           Other Sales
      fried, processing for fries and dehydrated
                                                          there appears to be a market for heirloom                Livestock Feed                                                    1,913,000               697,000
      potatoes
                                                          potato varieties, especially purple varieties.
    • Yellow potatoes: Grilled, baked or roasted,                                                                  Seed                                                            25,224,000             24,079,000
                                                          Varieties used for potato chips are round white
      mashed, salads                                                                                               Other Sales Total                                               27,137,000             24,776,000
                                                          varieties many of which are proprietary to the
    • Red potatoes: Baked or roasted, salads,                                                                    Total Sales                                                      421,372,000           420,447,000
                                                          potato chip processor or brand. The other
      soups, stews, grilled, steamed                                                                             Non-Sales
                                                          potato varieties are somewhat less popular but
    • White potatoes: Mashed, salads, steamed,
                                                          are representative of the vast varieties available       On Farm Seed                                                      3,526,000             3,491,000
      pan fried or sautéed, processing for potato
                                                          to consumers. Despite having a wide variety of           Household Use and on Farm Seed                                     884,000                556,000
      chips
                                                          options in the U.S., there are more than 5,000           Shrinkage and Loss                                              25,139,000             25,526,000
    • Purple potatoes: Baked or roasted, grilled,
                                                          additional varieties of potatoes grown in South        Total Non-Sales                                                   29,549,000             29,573,000
      salads
                                                          America (Madigan 2021), creating a potential
    • Fingerling potatoes: Pan fried or sautéed,                                                                 Total Production                                                 450,921,000           450,020,000
                                                          to further expand the varieties produced in the
      baked or roasted, salads                                                                                 Source: USDA, Agricultural Statistics
                                                          United States.

10 | Measuring the Economic Significance of the U.S. Potato Industry                                                                                   Measuring the Economic Significance of the U.S. Potato Industry | 11
Measuring the Economic Significance of the U.S. Potato Industry - William Knudson & Steven R. Miller
TABLE 3    Processing Utilization of Potatoes 2016 and 2017                                                 by retailers, food service firms, and institutions   are marketed through contracts, grading and
                                                                                                                such as schools and hospitals. The products are      sizing are important activities. Some potatoes
       Utilization (Cwt.)                                                      2016                    2017
                                                                                                                then bought or consumed by the final consumer.       destined for the fresh market go straight to
       Chips and Shoestrings                                              58,751,000             62,700,000
                                                                                                                A stylized depiction of the complete supply          potato wholesalers, and then go to either the
       All Dehydrated (including starch and flour)                        45,761,000             49,066,000     chain from farm input suppliers to consumers is      retail market or food service or institutional
       Frozen fries                                                     155,798,000             162,640,000     shown in Figure 1.                                   sales. Given the popularity of potatoes and
       Other Frozen Products                                              13,803,000             15,956,000                                                          their versatility, the supply chain for potatoes is
                                                                                                                Potato quality is important for both the fresh and
       Canned Potatoes                                                     1,152,000              1,113,000                                                          complex compared to many other agricultural
                                                                                                                processed potato markets. Since many potatoes
       Other Canned Products that use Potatoes                               703,000                758,000                                                          commodities.
       Other (fresh pack, potato salads, vodka, etc.)                      6,160,000              5,550,000
       Total                                                            282,128,000            297,783,000      FIGURE 1   The Supply Chain for Potatoes
    Source: USDA, Agricultural Statistics

    In 2017, more than one-third of all the potatoes      on lower sodium varieties, baked chips, and
    sold in the U.S. were used to produce fries.          chips with a lower oil content (Diment 2021).
    About 55 percent of potatoes (by weight) for
                                                          Processed potato production entails vast inputs
    processing were used for fries. The second
                                                          from producers in other agricultural production
    largest use of processed potatoes was for
                                                          sectors, as well as from other manufacturing
    chips and shoestring potatoes which accounted
                                                          sectors – particularly for packaging and
    for about 16.5 percent of all potatoes used for
                                                          processing. Processors use inputs to produce
    processing. The third largest use of potatoes
                                                          finished products. Examples of these are
    by volume was for dehydration. This includes
                                                          packaging, utilities, salt, breading, spices, other
    packaged starch, flour and packaged potato
                                                          agri-food inputs, cooking oil, and energy. The
    products like instant mashed potatoes,
                                                          types of inputs brought into the processed
    scalloped potatoes, and potatoes au gratin.
                                                          potato production process depend on the type
    Potatoes are increasingly being used as an
                                                          of product processed. To be sure, potatoes are
    input in other processed food products, such as
                                                          also inputs to other processed and packaged
    frozen meals, pot pies, and soups.
                                                          food products, where potatoes are secondary
    Some of the largest firms in the agri-food            components. For example, consider shepherd’s
    industry are involved in the processed potato         pie, where mashed potatoes constitute only
    industry. Collectively, the food service sector       one component of the necessary ingredients
    makes up the largest buyer segment for                to complete this traditional dish that is often
    processed potatoes. Fast food restaurants             marketed as a frozen meal.
    are the largest buyers of frozen potatoes for
                                                          Potatoes and processed potato products are
    use in fries, and PepsiCo and Campbell Soup
                                                          then handled by wholesalers (see Figure 1).
    Company, through their Frito-Lay and Snyder-
                                                          In some cases, large firms manage their own
    Lance divisions, are the largest producers of
                                                          warehouses, which means that they do not need
    chips. Current potato sales growth is largest in
                                                          to use wholesale services but carry out some of
    craft or specialty chip production. There is also
                                                          the activities that wholesalers do internally. The
    product innovation in the chip sector focusing
                                                          potatoes and potato products are then handled

12 | Measuring the Economic Significance of the U.S. Potato Industry                                                                                    Measuring the Economic Significance of the U.S. Potato Industry | 13
Measuring the Economic Significance of the U.S. Potato Industry - William Knudson & Steven R. Miller
TABLE 5    Top 10 U.S. Export Markets for Potatoes (2021 Calendar Year) • TOTAL

     International Trade                                                                                            TOTAL
                                                                                                                    Mexico
                                                                                                                                                                                      US Dollars

                                                                                                                                                                                    $393,693,595
                                                                                                                                                                                                    Fresh Weight Eq.
                                                                                                                                                                                                       (Metric Tons)
                                                                                                                                                                                                             759,955
                                                                                                                    Canada                                                          $324,144,942             739,042
                                                                                                                    Japan                                                           $357,882,548             651,251

     TABLE 4    U.S. Exports of Potatoes (Calendar Year)                                                            South Korea                                                     $123,703,766             194,472
                                                                                                                    Taiwan                                                           $79,807,784             124,937
                                            US Dollars                    Fresh Weight Equivalent (Metric tons)
                                                                                                                    Philippines                                                      $95,904,337             137,729
                                    2020                   2021                2020                2021
                                                                                                                    Malaysia                                                         $62,017,657               99,394
       Total Exports             $1,667,011,199          $1,875,477,595          3,063,054           3,377,961      China                                                            $39,405,783               68,219
       Frozen                    $1,021,182,588          $1,188,727,694          1,509,984           1,763,058      Guatemala                                                        $39,212,893               56,228
       Fresh                       $233,079,703           $262,967,809             483,470             570,472      Singapore                                                        $38,588,294               52,390

       Dehydrated                  $216,105,741           $213,548,916             865,170             819,234    Source: Potatoes USA 2022c
       Chips                       $186,409,856           $198,411,782             185,432             199,056
                                                                                                                  TABLE 6    Top 10 U.S. Export Markets for Potatoes (2021 Calendar Year) • FROZEN
       Seed                         $10,233,311            $12,821,394              18,998              26,141
                                                                                                                                                                                                      Fresh Weight Eq.
    Source: USDA, Agricultural Statistics                                                                           FROZEN                                                            US Dollars         (Metric Tons)
                                                                                                                    Japan                                                           $290,985,766             445,412

    Approximately 20 percent of the potatoes                 in volume. However, Japan was the second               Mexico                                                          $266,438,431             429,287

    grown in the U.S. are exported in either fresh           largest market in terms of sales. We should            South Korea                                                     $104,227,475             140,814

    or processed form, representing a combined               note that trade with Mexico and Canada is              Philippines                                                      $66,348,854             101,459

    $1.88 billion in sales (Potatoes USA 2022c).             often two-way. All three countries participate in      Canada                                                           $67,450,726               95,316
                                                                                                                    Taiwan                                                           $59,183,185               80,726
    Despite potatoes being grown and consumed                intermediate trade exports to one market may
                                                                                                                    Malaysia                                                         $51,888,205               75,460
    throughout the world, and despite the volume             be for processing for export to others, including
                                                                                                                    China                                                            $37,058,476              59,514
    of U.S. potato production and consumption, the           the country of origin.
                                                                                                                    Guatemala                                                        $34,643,181              47,751
    U.S. is neither a primary exporter nor an importer
                                                             Similarly, Table 6 shows the top 10 exports for        Hong Kong                                                        $30,643,992              43,819
    of potatoes in the aggregate.
                                                             frozen potatoes in 2021, indicating Japan as the     Source: Potatoes USA 2022c
    Total U.S. exports of potatoes generated $1.875          top importer of U.S. frozen potatoes. Mexico
    billion in sales in 2021 up from $1.667 billion          follows closely, while Canada is the fifth largest   TABLE 7    Top 10 U.S. Export Markets for Potatoes (2021 Calendar Year) • FRESH
    in 2020. The total volume of fresh potatoes              importer of frozen potatoes. Table 7 shows                                                                                               Fresh Weight Eq.
                                                                                                                    FRESH                                                             US Dollars         (Metric Tons)
    making up 2021 exports was just under 3.4                export sales and volume for fresh, or table-stock
                                                                                                                    Canada                                                          $100,901,646             263,516
    million metric tons (Table 4). Processed potato          potatoes. Consistent with the intermediate
                                                                                                                    Mexico                                                           $60,313,983             124,449
    shipments in the form of frozen was the most             trade of potatoes discussed above, Canada and
                                                                                                                    Japan                                                            $25,104,798               54,001
    common form, followed by fresh, dehydrated,              Mexico are the top export markets for fresh U.S.
                                                                                                                    Taiwan                                                           $17,551,595               34,709
    chips and seed, respectively. While fresh was            potatoes. By weight, Canada imported more
                                                                                                                    South Korea                                                       $8,752,828               15,311
    the most second most common form of exports              than twice that of Mexico, but in dollar terms
                                                                                                                    Dominican Republic                                                $9,063,409               14,066
    by sale value, dehydrated was the second most            Mexico exports command a relatively higher
                                                                                                                    Honduras                                                          $7,572,872               12,013
    common form exported by volume.                          sale price.
                                                                                                                    Philippines                                                       $6,751,720              11,692

    Table 5 shows that Mexico and Canada were the            Table 8 shows the top ten export markets for           Malaysia                                                          $5,345,801                9,781

    largest export markets for all potato products           U.S. dehydrated potatoes. Often an intermediate        Singapore                                                         $3,123,217                4,536
                                                                                                                  Source: Potatoes USA 2022c

                                                                                                                                                                                        Source: Potatoes USA 2022c
14 | Measuring the Economic Significance of the U.S. Potato Industry                                                                                  Measuring the Economic Significance of the U.S. Potato Industry | 15
Measuring the Economic Significance of the U.S. Potato Industry - William Knudson & Steven R. Miller
TABLE 8     Top 10 U.S. Export Markets for Potatoes (2021 Calendar Year) • DEHYDRATED

       DEHYDRATED                                                            US Dollars
                                                                                            Fresh Weight Eq.
                                                                                               (Metric Tons)   Data and Methods for Estimating
       Canada
       Mexico
                                                                            $93,988,140
                                                                            $34,721,153
                                                                                                   312,423
                                                                                                   144,983
                                                                                                               Economic Contributions
       Japan                                                                $33,068,320            142,487
       United Kingdom                                                       $10,786,017              52,020
       South Korea                                                           $7,161,889              34,028    Like all industries in the U.S., the domestic supply   economic impact assessment of the agricultural
       Australia                                                             $6,295,971              28,067    chain supporting the production of raw potatoes,       production of potatoes will also measure the
       Israel                                                                $3,985,592              15,067    processing them, and delivering them to                economic value of the sold potatoes and the
       Malaysia                                                              $3,305,343             13,221     consumers in fresh or processed form generates         associated input values. However, it will go
       Indonesia                                                             $2,368,549               8,860    economic activities that exceed the direct value       further to recognize the lost revenues of the
       Taiwan                                                                $1,895,573               8,125    of the final products sold for consumption. This       likely alternative crops that would be grown
    Source: Potatoes USA 2022c                                                                                 section traces the transactions involved in the        in the absence of potatoes. For instance, the
                                                                                                               production of potatoes from the agricultural           acres allocated to potatoes may supplant the
    TABLE 9     Top 10 U.S. Export Markets for Potatoes (2021 Calendar Year) • CHIPS                           inputs all the way to the distribution of final        sale and production values of corn on those
                                                                                            Fresh Weight Eq.   goods for consumption. The corresponding               same acres. Unfortunately, determining what
       CHIPS                                                                 US Dollars        (Metric Tons)
                                                                                                               economic contribution estimates recognize              production potatoes supplant can be challenging
       Mexico                                                               $32,220,028              61,236
                                                                                                               that directly associated transactions give rise to     as this counterfactual state of production does
       Canada                                                               $52,267,076              46,476
                                                                                                               secondary transactions as dollars are spent and        not exist and cannot be observed directly. An
       Philippines                                                          $20,965,683              17,408
                                                                                                               re-spent in the economy in a reciprocal fashion        economic contribution assessment does not
       United Arab Emirates                                                 $15,730,941               9,844
                                                                                                               not unlike the ripples on water created by a           require conjecturing the nature of agricultural
       Japan                                                                 $8,723,664               9,352
                                                                                                               tossed rock in an otherwise calm pound. That is,       production in the absence of potato production.
       Saudi Arabia                                                          $6,622,760               5,500
                                                                                                               the estimates entail what is commonly referred         In total, economic impact assessments impose
       Singapore                                                             $3,896,799               4,880
                                                                                                               to as an economic multiplier effect.                   significant barriers to estimation over that of
       Netherlands                                                           $4,354,309               3,220
                                                                                                                                                                      economic contribution assessments.
       South Korea                                                           $2,705,116               3,100    One should be careful to note that the estimation
       Qatar                                                                 $5,036,595               2,844    framework employed in this section reflects            One of the shortcomings of any economic
    Source: Potatoes USA 2022c                                                                                 an economic contribution, not an economic              contribution estimate, like that provided here,
                                                                                                               impact. Economic impact estimates follow               is that other supply chains can also be claimed
    processing product, dehydrated potatoes are           Finally, Table 9 shows the top ten markets           the same approach as economic contribution             for some associated economic activities. For
    increasingly found on grocery shelves around          for potato chip form of potatoes. Mexico and         assessments. However, economic impact                  example, the mashed potatoes that go into a
    the world. Once, again, Canada and Mexico are         Canada remain the dominant destinations. The         estimates must take into account all lost              frozen meal, like shepherd’s pie, are co-mingled
    top markets, where Canada makes up more               Canadian market is the top destination in sales,     economic activities supplanted by the industry         with other ingredients. Accordingly, the supply
    than twice the value of the Mexican market in         but Mexico is the top destination in terms of        in question, while economic contributions only         chain for minced beef or lamb can also assert
    both volume and sales. Unlike fresh, however,         volume, the difference indicating that Canadian      account for the economic value of activities           ownership to the same value attributed to
    the Canadian market pays a relative premium           markets pay a premium for chip-processed             directly and indirectly attributed to the industry     potatoes. While the estimates provided in
    for dehydrated potatoes relative to the Mexican       potatoes over Mexico.                                in question. For example, an economic                  this analysis shares out that portion of the
    market (determined by taking the ratio of dollars                                                          contribution assessment of the agricultural            finished good that can be attributed to potatoes,
    to weight).                                                                                                production of potatoes will measure the selling        the very nature of the economic simulation
                                                                                                               value of potatoes produced and the value of            model assures that if we were to measure the
                                                                                                               all the inputs required to make that output. An        economic contributions of all inputs into final

16 | Measuring the Economic Significance of the U.S. Potato Industry                                                                                    Measuring the Economic Significance of the U.S. Potato Industry | 17
Measuring the Economic Significance of the U.S. Potato Industry - William Knudson & Steven R. Miller
of economic research. It provides 544 distinct          activities, and internationally traded goods and
                                                                                                                industry detail, allowing for granular tracking         services. Because it becomes increasingly
                                                                                                                of transactions. Consistent with the economic           difficult to assign component contributions to
                                                                                                                theory underlying the model, the IMPLAN                 final value as we move down the supply chain
                                                                                                                simulation model is strictly backward-looking.          from raw inputs to retail and food service, the
                                                                                                                That is, modeling the economic transactions             most precise measure of the value of potato
                                                                                                                of agricultural output starts with the value of         production will be found at the farm gate. All
                                                                                                                agricultural production and traces all the inputs       value-added attributes beyond this point should
                                                                                                                required to make that output. It is mostly silent       be inferred based on the farm-gate values. We
                                                                                                                about what happens to that output after it leaves       use the USDA Food Dollar Series (described
                                                                                                                the farm. Similarly, if the analysis starts with        below) to project value added along each step of
                                                                                                                the value of wholesale activities, the analysis         the supply chain.
                                                                                                                will start with the value of wholesale sales of
                                                                                                                                                                        For estimating economic contribution along the
                                                                                                                potatoes and work backward, capturing the
                                                                                                                                                                        supply chain, we turn to the USDA, Economic
                                                                                                                value of agricultural production necessary
                                                                                                                                                                        Research Service’s Food Dollar Series (USDA:
                                                                                                                to supply the wholesale sales of potatoes.
                                                                                                                                                                        Economic Research Service 2022). The Food
                                                                                                                However, measuring potatoes’ share of value
                                                                                                                                                                        Dollar Series breaks consumer expenditures on
                                                                                                                becomes increasingly murky moving down the
                                                                                                                                                                        food into component parts based on the industry
                                                                                                                supply chain (Miller & Mann 2020), as potatoes
    products entailing potatoes, the total economic       reduces their ability to spend on other things, and                                                           groups. Each industry group represents the share
                                                                                                                are intermingled with other inputs, value-added
    contribution would entail excessive double-           when one sells potatoes, they make subsequent                                                                 of value of consumer dollar captured.
    counting of effects across the multiple inputs.       expenditures from those earnings. Businesses
                                                          take revenues from sales and pay for inputs           TABLE 10    Food Dollar Series – Industry group value added by factors
    The USDA National Agricultural Statistics Service
                                                          and services. Those firms supplying inputs and                                                                                        Property      Salary &
    (NASS) is the primary source of information for                                                               Industry group                  Total           Imports        Output taxes   income        benefits
                                                          services take these earnings and pay for inputs,                                       (cents)           (cents)         (cents)
    potato production, sales, and trade. This agency                                                                                                                                             (cents)      (cents)
                                                          inventory, and services. Firms also pay wages to
    also provides breakouts of commodity sales by                                                                 All industries                     100.0               5.1              5.1        39.4           50.3
                                                          workers and profits to shareholders, and these
    form (frozen, fresh, dehydrated, etc.). The USDA                                                              Agribusiness                          2.2              0.6              0.1          1.0           0.6
                                                          beneficiaries take these earnings and spend
    Agricultural Marketing Services (AMS) provides
                                                          them on household expenditures, setting off             Farm production                       7.4              1.0             -0.4          5.2           1.7
    in-depth coverage of trade flows of raw and
                                                          subsequent rounds of transactions that cease            Food processing                      15.2              1.2              0.6          5.8           7.7
    processed potatoes. The U.S. Department of
                                                          only to the extent that purchases are made for          Packaging                             2.9              1.0                0          0.8           1.2
    Commerce provides detailed transaction data
                                                          goods and services rendered outside the local
    called a social accounting matrix (SAM) that                                                                  Transportation                        3.6                  0              0          1.4           2.2
                                                          economy. These cycles continue indefinitely,
    allows measures of inputs into the agricultural                                                               Wholesale trade                      10.7             -0.3              1.7          4.2           5.1
                                                          mitigated only to the extent that individuals
    production process of growing potatoes, as well                                                               Retail trade                         12.7              0.3              1.9          3.9           6.7
                                                          and institutions save, rather than re-spend from
    as that of processing, wholesaling, and retailing.                                                            Food services                        33.6              0.6              0.7         12.2          20.1
                                                          earnings and the extent to which subsequent
    The SAM traces all purchases and subsequent                                                                   Energy                                3.2              0.4              0.3          1.6           1.0
                                                          purchases go to international suppliers.
    transactions along all supply chains and forks
                                                                                                                  Finance and insurance                 3.6              0.1              0.1          1.4           1.9
    in channels from raw material inputs to final         The IMPLAN economic simulation model is
                                                                                                                  Advertising                           3.0              0.2                0          1.5           1.3
    goods. As a social accounting construct, the          used to model transactions and subsequent
                                                                                                                  Legal and accounting                  1.8              0.1              0.1          0.7           1.1
    SAM is a system of double-entry accounting,           rounds of expenditures using the U.S. domestic
    where a receipt for one party is an expenditure       SAM. IMPLAN is a well-established economic            Note: Values may not add to totals due to rounding
    of another. One’s expenditure for potato inputs       simulation model developed on over 50 years           Source: USDA, Economic Research Service, Food Dollar Series, 2022

18 | Measuring the Economic Significance of the U.S. Potato Industry                                                                                       Measuring the Economic Significance of the U.S. Potato Industry | 19
The Food Dollar Series provides two key               discussed above, trade constitutes a significant   used in the IMPLAN model in simulating
    measures used in this contribution assessment.        component of U.S. domestic potato production       economic contributions. The columns in
    First, it provides an objective means of              and demand. While imports and exports can          Table 11 show the capture of primary factors
    measuring the value of final goods created            take place anywhere along the supply chain, for    of production – or the factor share of value
    by the agricultural production of potatoes.           simplicity we assume it takes place from the       created. With the total value of final domestic
    Accordingly, the Food Dollar Series suggests          farm gate and farm gate sales down by 0.34         goods of $55.76 billion and the industry group
    that 7.4¢ out of every food dollar is captured        percent in the final estimates. Accordingly, we    breakouts in Table 11, the economic contribution
    by the farm. The expected value of consumer           assert the final value of sales from domestic      of the domestic potato production supply chain
    goods purchased through retail or food service        potato production and processing is $55.76         can be simulated and estimated.
    channels can be estimated simply by taking            billion in 2021.
                                                                                                             Each industry group can be modeled in
    the ratio of farm gate sales to this farm gate
                                                          In addition to providing an estimate for the       isolation, netting out the simulation of other
    value. For instance, the USDA reports that farm
                                                          value of final goods produced with potatoes,       industry groups. Recall that the simulation
    gate sales of potatoes were $4.17 billion in
                                                          the Food Dollar Series also provides a means       model is backward-looking, such that all
    2021 (USDA: NASS 2022). Based on the Food
                                                          of breaking out value at each stage of the         inputs are accounted for in the simulation up
    Dollar Series, this suggests that the value of
                                                          supply chain. Table 11 reproduces the USDA         to the industry group being modeled. Hence,
    final goods for consumption would be $55.95
                                                          Economic Research Service Food Dollar Series       when modeling wholesale activities, for
    billion. This would be an objective measure
                                                          industry component estimates. These objective      example, food processing, farm production,
    if all domestic production was processed
                                                          measures should be consistent with the values      and agribusiness activities are automatically
    and consumed domestically. However, as
                                                                                                             built into the simulation. Not netting out these     used to gauge the value of economic activity.
                                                                                                             upstream activities will result in double counting   The first is the direct effects, which from an
                                                                                                             those activities. Hence, direct expenditures of      output perspective, is the value of transactions
                                                                                                             upstream activities are netted out in estimates      directly observed by the industry group tracked.
                                                                                                             for each leg along the supply chain.                 Secondary effects are the combined economic
                                                                                                                                                                  activities generated from secondary business-
                                                                                                             Finally, IMPLAN provides multiple measures
                                                                                                                                                                  to-business transactions or those transactions
                                                                                                             of economic effect. First, as established in the
                                                                                                                                                                  made by recipients of direct expenditures. As
                                                                                                             economic modeling literature, simulations are
                                                                                                                                                                  businesses spend from initial sale receipts and
                                                                                                             undertaken to track the value of transactions
                                                                                                                                                                  households spend from earnings garnered by
                                                                                                             – also called output. However, other measures
                                                                                                                                                                  expenditures along the supply chain, they set
                                                                                                             of economic activity can be reported. More
                                                                                                                                                                  into motion secondary transactions not made
                                                                                                             common measures of economic activity
                                                                                                                                                                  by the supply chain participants but rather in
                                                                                                             include employment, labor income and value-
                                                                                                                                                                  response to supply chain expenditures. That
                                                                                                             added. Each is estimated for each of the 544
                                                                                                                                                                  is, economic effects can be categorized as
                                                                                                             industries and simulated based on a fixed
                                                                                                                                                                  those arising from activities along the supply
                                                                                                             relation to the level of output. Hence, there are
                                                                                                                                                                  chain and those effects arising because of
                                                                                                             four measures of economic activity: output,
                                                                                                                                                                  activity along the supply chain. The total
                                                                                                             employment, labor income and value-added.
                                                                                                                                                                  economic effect is simply the sum of the direct
                                                                                                             Each measure moves in proportion to the level
                                                                                                                                                                  and secondary effects and is relevant for all
                                                                                                             of output by segment.
                                                                                                                                                                  measures of economic activity.
                                                                                                             Three metrics make up economic contribution
                                                                                                             estimates, regardless of which measure is

20 | Measuring the Economic Significance of the U.S. Potato Industry                                                                                 Measuring the Economic Significance of the U.S. Potato Industry | 21
Economic Contribution Estimates                                                                            Summary and Conclusion
                                                          of the Food Dollar Series allocation to each of      This report outlines the U.S. domestic supply          production, processing, and trade. Processed
                                                          the two channels. The resulting estimates are        chain of potatoes, recognizing the U.S. as             potatoes make up a significant component of
                                                          shown in Table 11, where the Total is the sum of     one of the largest potato-producing countries          international trade, as well, including frozen and
                                                          the estimated contributions by leg.                  in the world. Potatoes and potato products             dehydrated products, but also fresh potatoes.
                                                                                                               are an important component of the U.S. and             Potato production is expansive throughout
                                                          Accordingly, the estimates suggest that about
                                                                                                               global food systems. Accordingly, they also            the world, reflecting the relative hardiness
                                                          404,733 U.S. jobs can be directly linked to the
                                                                                                               make up a significant contribution to the U.S.         of potatoes relative to other agricultural
                                                          U.S. domestic supply chain for potatoes and
                                                                                                               economy, from raw materials, through farm              commodities. Profitably promoting international
                                                          potato products (Table 11). Once accounting
                                                          for secondary effects, the estimates show
                                                                                                               TABLE 11         Estimated Economic Contributions Along the Domestic Potato Supply Chain
                                                          that about 714,500 jobs are supported directly
                                                          or indirectly by the domestic potato products        Agriculture Production and Agribusiness Services

                                                          supply chain. Relative to the size of the labor       Impact Type                    Employment         Labor Income         Value Added                Output

                                                          force, this suggests that about 0.4 percent of all    Direct Effect                      29,023           $1,228 Mil.          $2,175 Mil.          $4,170 Mil.
                                                                                                                Secondary Effect                   37,581           $2,120 Mil.          $3,535 Mil.          $6,621 Mil.
                                                          U.S. jobs can be attributed directly or indirectly
    Estimating the economic contribution of                                                                     Total Effect                       66,604           $3,348 Mil.          $5,711 Mil.        $10,791 Mil.
                                                          to domestic potato production and marketing.
    the U.S. domestic potato supply chain
                                                          Breaking it down, about 66,000 of those jobs         Processing and Wholesale
    starts with sequentially simulating industry
                                                          can be tied directly or indirectly to agricultural    Impact Type                    Employment         Labor Income         Value Added                Output
    group transactions, netting out the direct
                                                          production and agribusiness services (Top level       Direct Effect                      55,392           $3,779 Mil.          $4,770 Mil.        $12,998 Mil.
    transactions of the previous industry group.
                                                          of Table 11), food processing and wholesaling         Secondary Effect                  118,951           $7,687 Mil.         $12,950 Mil.        $27,176 Mil.
    The first industry group modeled was farm
                                                          supports over 174,000 jobs, while just under          Total Effect                      174,343          $11,466 Mil.         $17,720 Mil.        $40,174 Mil.
    production and agribusiness, of which, the
                                                          500,000 retail and food services jobs can be         Retail
    prior value is established by USDA statistics.
                                                          linked to the domestic potato supply chain.           Impact Type                    Employment         Labor Income         Value Added                Output
    The second can be estimated as 2.2 percent
                                                                                                                Direct Effect                      73,082           $1,938 Mil.          $2,615 Mil.          $3,527 Mil.
    (See Table 11) of the value of final potato           These approximate 714,500 aggregate jobs are
                                                                                                                Secondary Effect                   28,097           $1,533 Mil.          $2,828 Mil.          $5,432 Mil.
    goods. Subsequently, wholesale and production         estimated to generate around $34.1 billion in
                                                                                                                Total Effect                      101,179           $3,471 Mil.          $5,443 Mil.          $8,959 Mil.
    activities are simulated and added to the             annual labor income and boost annual national
    economic contribution estimates of agricultural       income by $53.5 billion. These earnings are          Food Service
    production. However, to control for double            driven by around $100.9 billion in direct and         Impact Type                    Employment         Labor Income         Value Added                Output

    counting, direct expenditures of agricultural         secondary transactions, while $37 billion             Direct Effect                     247,235           $7,772 Mil.         $11,222 Mil.        $16,466 Mil.

    production and agribusiness are subtracted            in spending can be directly linked back to            Secondary Effect                  125,143           $8,051 Mil.         $13,439 Mil.        $24,519 Mil.

    from the wholesale economic effects. Retail           the potato supply chain. Collectively, when           Total Effect                      372,378          $15,823 Mil.         $24,662 Mil.        $40,985 Mil.

    and food service contributions were added –           accounting for all sources of earnings, the          Total
    once again netting out prior leg direct effects,      estimates anticipate that the domestic potato         Impact Type                    Employment         Labor Income         Value Added                Output
    where prior leg direct effects had to be split        supply chain boosts annual gross domestic             Direct Effect                     404,733          $14,717 Mil.        $20,782 Mil.         $37,161 Mil.
    between retail and food service channels. Prior       product by $53.5 billion a year.                      Secondary Effect                  309,771          $19,390 Mil.        $32,754 Mil.         $63,747 Mil.
    leg direct effects were split based on the share                                                            Total Effect                      714,504          $34,107 Mil.        $53,536 Mil.        $100,909 Mil.

22 | Measuring the Economic Significance of the U.S. Potato Industry                                                                                    Measuring the Economic Significance of the U.S. Potato Industry | 23
contribution of restaurant and institutional sales   11.2 percent of final value, in the aggregate.
                                                                                                              and utilization of potatoes. Collectively, these     The combined wholesaling and processing
                                                                                                              are shown as the third level in Figure 2. Using      activities account for around 35 percent, while
                                                                                                              the estimated values of direct expenditures          the distribution channels account for 53.8
                                                                                                              (output) in Table 11, the estimated share of         percent, where food service (food serving
                                                                                                              supply chain value is presented in percent form      establishments and institutions) make up the
                                                                                                              in Figure 2. Accordingly, agriculture production     largest component.
                                                                                                              and agribusiness services comprise roughly

                                                                                                              FIGURE 2   The Supply Chain for Potatoes

    trade initiatives may be challenging; however, for    attributed to the U.S. domestic supply chain of
    the space of potato-based products with value-        potatoes. These jobs command about $34.1
    added properties, like dehydration, frozen for        billion in labor income per year and contribute
    processing and finished consumer.                     $53.5 billion to annual gross domestic product.
                                                          To place these findings into context, about
    We use baseline industry statistics to
                                                          0.4 percent of the U.S. domestic workforce
    estimate the overall economic contribution,
                                                          is supported by the domestic potato industry
    or significance, of the U.S. potato supply
                                                          supply chain.
    chain. The supply chain represents all the
    legs of production from raw materials, like           Table 11 largely follows the hierarchy of Figure
    seed, fertilizer, and soil, to finished goods for     1. The output and employment numbers for
    consumption. Finished goods can be fresh and          production and agribusiness services are
    processed potatoes for home preparation, as           reflected in the input suppliers, potato farmers,
    well as prepared meals containing potatoes            and sizing grating and packing, as shown in
    for consumption at home. It also includes             the top-shaded area of Figure 2. In these steps,
    salty snacks made from potatoes, like potato          the form of the potato does not change. Table
    chips and shoestring potatoes. It also entails        11 estimates for processing and wholesaling
    processed and fresh potatoes used in food             reflect the economic contribution of processing
    services and the food service jobs supported          potatoes and wholesaling both fresh and
    by on-premise sales and preparation of meals          processed potatoes. This also includes the
    entailing potatoes. The estimates also entail         inputs used in processing and wholesaling, as
    all handling of potatoes and potato-related           reflected in the second level from the top in
    products from raw material to final purchase for      Figure 2. The economic contribution estimates
    consumption.                                          for retail capture the economic contribution
                                                          of retailing potatoes to consumers. This
    The estimates suggest that about 714,500
                                                          includes fresh and processed potatoes. The
    domestic jobs can be directly or indirectly
                                                          numbers for food service capture the economic

24 | Measuring the Economic Significance of the U.S. Potato Industry                                                                                  Measuring the Economic Significance of the U.S. Potato Industry | 25
References
                                                                                                           Potatoes USA (2022b). Potato Products: U.S. Seed Potatoes.

                                                                                                           Potatoes USA (2022c). United States Statistical Summary for Potato Commodities.

                                                                                                           Source Trace Systems (2020). Understand the Farm to Factory Model of the Potato Supply Chain,
                                                                                                                https://www.sourcetrace.com/blog/understand.
     Diment, D. (2021). Potato Chip Production, IBISWorld Report OD5713.
                                                                                                           Steury, T. (2023). Washington Potatoes. Washington State Magazine. Retrieved from https://
     Guthrie, J., B.H. Lin, A. Okrent, and R. Volpe. (2013). Americans’ Food Choices at Home and Away:          magazine.wsu.edu/2009/07/30/washington-potatoes/ on January 2, 2023.
          How Do They Compare with Recommendations?, U.S. Department of Agriculture, Economic
          Research Service.                                                                                University of California Davis (UC Davis) (2022). Potato health benefits and why you should eat more
                                                                                                                spuds.
     Idaho Potato Commission. (2023). The Difference Between Idaho® Potatoes and Russet. Ask Dr.
          Potato. Retrieved from https://idahopotato.com/dr-potato/the-difference-between-idaho-           USDA: Agricultural Marketing Resource Center. 2021. Potatoes. Retrieved from https://www.agmrc.
          potatoes-and-russet on January 2, 2023.                                                              org/commodities-products/vegetables/potatoes on December 28, 2022.

     Kantor, L. & A. Blazejczyk. (2020). Potatoes and tomatoes are the most commonly consumed              USDA: Economic Research Service. (2022). Food Dollar Series. Retrieve from https://www.ers.usda.
          vegetables. Retrieved from https://www.ers.usda.gov/data-products/chart-gallery/gallery/             gov/data-products/food-dollar-series/documentation.aspx#:~:text=A%20food%20dollar%20
          chart-detail/?chartId=58340 on December 27, 2022.                                                    represents%20a,sales%20in%20the%20U.S.%20market on December 28, 2022.

     Lucier, G. (2020). A third of U.S.-grown potatoes become frozen French fries used mostly by food      USDA: NASS (2022). Agricultural Statistics 2021.
           service, U.S. Department of Agriculture, Economic Research Service.                             USDA: NASS. (2022). Quick Stats. Retrieved from https://quickstats.nass.usda.gov/
     Madigan, J. (2021). Potato Farming, IBISWorld Report OD6043.                                              results/1B7624B5-2C13-3D4F-BAA3-00E5F8B5EF63 on December 27, 2022.

     Michigan Potato Industry Commission. (2022). Potatoes 101. Michigan Potatoes. Retrieved from          USDA: NASS. (2021). Press Release: Combined value of all potatoes sold in 2020 for Idaho, Oregon,
          https://www.mipotato.com/potatoes-101 on January 2, 2023.                                            and Washington is $1.82 Billion. September 29, 2021.

     Miller, S., and J. Mann. (2020). “Measuring the importance of local food in the Chicago foodshed.”    WebstaurantStore.com (2022). Types of Potatoes, w
            Journal of Agriculture, Food Systems, and Community Development. 9 (2):101-122.

     Monfreda, C., N. Ramankutty, and J.A. Foley. (2008). Farming the planet: 2. Geographic distribution
         of crop areas, yields, physiological types, and net primary production in the year 2000. Global
         Biogeochemical Cycles. 22: GB1022.

     The Potato Association of America. (2020). Russet Potato Varieties. Retrieved from https://
          potatoassociation.org/varieties/russet-potato-varieties/ on December 27, 2022.

     Potatoes USA (2021a). July 2020–June 2021 U.S. Potato Sales and Utilization Report. Retrieved
          from https://potatoesusa.com/wp-content/uploads/2021/09/Sales-and-Utilization-
          Report-2021.pdf on December 2022.

     Potatoes USA (2021b). U.S. Imports of Potato Products Summary.

     Potatoes USA (2021d). Potato imports to U.S. continue to rise, May 18, 2021.

     Potatoes USA (2022a). U.S. Potato Exports Show Continued Signs of Recovery.

26 | Measuring the Economic Significance of the U.S. Potato Industry                                                                              Measuring the Economic Significance of the U.S. Potato Industry | 27
National Potato Council.org
You can also read