2020 PROPTECH GLOBAL TRENDS - ANNUAL BAROMETER - BUSINESS ...
←
→
Page content transcription
If your browser does not render page correctly, please read the page content below

1 - PropTech Global Trends 2021 Barometer   The Global PropTech Industry

PropTech
Global Trends
2020
Annual Barometer

2 - PropTech Global Trends 2021 Barometer                              The Global PropTech Industry

Content
   Executive Summary                                                                          3
PropTech : Investing, Building, Managing and Living in a digital world                        4
   What is PropTech?                                                                          4
   Why does it matter?                                                                        4
   Why Now?                                                                                   5
   PropTech Opportunities                                                                     5
   PropTech Company Categories                                                                6

The Global PropTech Industry                                                                  9
   1,724 PropTech companies unequally spread in 64 countries                                  10
   Investment and funding structure of the PropTech Industry                                  11
   3,118 investors worldwide mainly from the US                                               17

Focus on the US PropTech Industry                                                             19
   An increasing number of American PropTech companies                                        20
   Investment: an industry dominated by a few companies                                       24
   Funding structure of American PropTech companies                                           27
   California: the financial heart of the American PropTech industry                          28

The PropTech Industry in the Rest of World                                                    30
   PropTech companies across western countries and emerging giants                            31
   Investment opportunities are concentrated in a few Indian
   and Chinese PropTech companies                                                             32
   Funding structure of non-US PropTech companies                                             33
   Most investors are from Europe, India and China                                            35

3 - PropTech Global Trends 2021 Barometer
                                Barometer                        The Global PropTech Industry

Executive
Summary
The 2020 PropTech Annual Barometer is an in-depth analysis of the international Prop-
Tech sector. It analyses the evolution of PropTech over time, with graphs depicting the
historical evolution of PropTech since its initial emergence. The Barometer also iden-
tifies the sector’s newcomers, the quality of its emerging companies, its peak periods,
and the leading companies in the Tech sector. We also visualise the PropTech sector’s
geography via a world map showing the locations and amount of PropTech companies
per continent and country. We also demonstrate how the geographic distribution of
PropTech companies across the world has changed over time. To better understand the
market dynamics, we classify all PropTech companies into 12 business categories and
identify the companies with the highest valuations per category, allowing us to compare
the composition of the categories in different countries. Finally, we analyse the evolu-
tion of PropTech investors over time. In particular, we identify which countries, compa-
nies, and categories attract the most funding from investors and who are the top global
investors in the PropTech sector.

                     This barometer has been produced by Professor Jaime Luque at
                     the ESCP Business School as part of the Real Estate Tech Innovation
                     program sponsored by the Government of Monaco

                     Contact
                     Director, ESCP-Monaco
                     Real Estate Tech Innovation program
                     Jaime Luque - jluque@escp.eu
4 - PropTech Global Trends 2021 Barometer

PropTech: Investing,
Building, Managing
and Living in a digital
world.
What is PropTech?
PropTech (also called Real Estate Tech, Retech, Estech, or RealTech) is short for
“property technology.” The term refers to the software, tools, platforms, apps, websites,
and other digital solutions employed by Real estate practitioners, from brokers and ap-
praisers to architects and construction managers. It encompasses Contech (construc-
tion technology) and CREtech (commercial real estate) and overlaps with Fintech. Prop-
tech improves efficiency and facilitates Real Estate activities, including buying, selling,
leasing, managing, appraising, financing, marketing, developing, designing, building,
and investing.

Why does it matter?
We should all be aware of and understand the current wave of PropTech, as it concerns
every single one of us. We are all Real Estate consumers that will be directly or indirectly
affected by the changes to the Real Estate industry inspired by the surge in the num-
ber and the quality of PropTech. It changes and will continue to change how we make
serious decisions such as buying or renting, selling or leasing a property, and the way
Real Estate agencies function and are structured. It’s playing a crucial part in the global
digital revolution in which we live and shall continue doing so for years to come.
5 - PropTech Global Trends 2021 Barometer                                           PropTech: Investing, Building,
                                                                             Managing and Living in a digital world.

Why Now?
The application of technology and innovation to Real Estate came late compared
to all the other industries involved in the global digital revolution. One reason for
this delay was the success and profitability of the old commission-based business
model. Another reason was the hyper-local nature and high regulation of the real estate
market, which primarily involved private assets. Additionally, homebuyers were wary
of using new and unaccustomed methods for what’s likely to be the acquisition of
their most valuable asset. Above all, the illiquidity of properties made it hard for the
real estate market to keep up with the era of fast-paced liquid transactions online.
All the above reasons contributed to a tendency of resistance by the different stakeholders
in the real estate market.
The generational changes sparked by the digital revolution triggered the arrival of
PropTech. With the modernisation of everything around them, millennials require
everything to operate quickly and efficiently, including the real estate market. The delay
in innovation has led to an incredibly dynamic change in PropTech as it is catching
up with the other digital industries and taking the investment world by storm.

PropTech Opportunities
PropTech provides massive opportunities to make money through 3 primary means: ac-
cessibility of information, efficient transactions, and simplified management and control.

Information                               Transactions                          Management
The digitalisation of data is facilita-   People are becoming increasingly
                                                                                and control
ting access to mass market infor-         accustomed to using fast, secure      Mobiles phones and other techno-
mation quickly and cheaply. Thanks        and straightforward platforms to      logical devices are becoming more
to advances in technology, the            get a mortgage, lease workspace,      and more sophisticated and can
times of bulky physical data sheets       sign contracts, and sell houses,      now be used as dashboards that
are over. Instead, everything can         among other things.                   allow for easy management and
be digitally recorded and retrieved                                             control of everything.
online, from public records to office
lease data, from market fluctuations
to real-time boiler temperatures.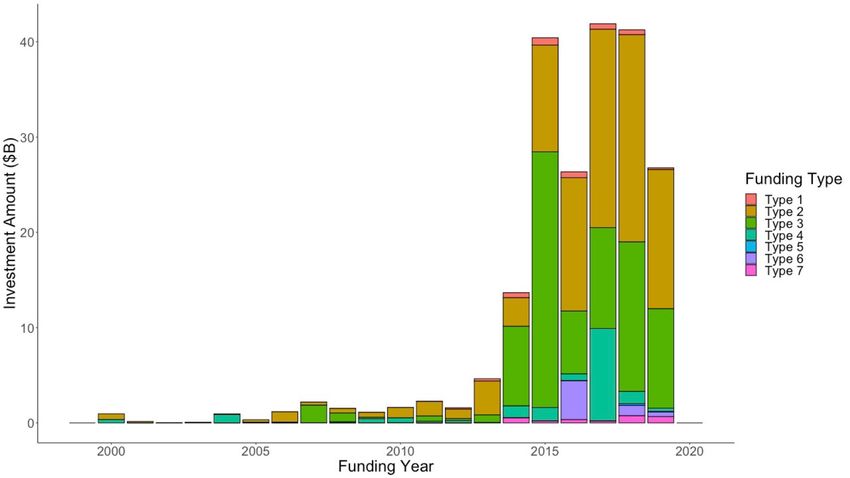
6 - PropTech Global Trends 2021 Barometer                                        PropTech: Investing, Building,
                                                                          Managing and Living in a digital world.

PropTech Company Categories
In this study, all PropTech companies are classified into 12 different categories to better
understand the wide range of PropTech company typologies and analyse their market
performance.

INVESTING

Portfolio Management
Tools that real estate investors
employ to analyse real estate
investment opportunities and make
more well-informed decisions to
maximise their expected return
within an appropriate level of risk
exposure and platforms to make
such investments. E.g., Money360,
Rootstock, Lendinvest, Fundrise,
PropertyPartner, HouseCanary,
Cadre.

BUILDING

Construction                          Indoor Mapping
Management
                                      Software that helps and improves
Cutting-edge technologies that        the visualisation of a building and
aim to facilitate and improve         provides spatial data on a digital
planning, design, management,         2D or 3D map. It helps to project
and construction of new buildings,    and optimize buildings’ future
such as construction visualisation    design and flow and enables users
tools and management platforms        to create 3D and virtual reality
for blueprints. E.g. ProCore, Buil-   models of real-world spaces that
dingConnected, PlanGrid, Equip-       can be experienced, changed, and
mentShare, Katerra                    shared online. E.g. 3vjia, Matterport,
                                      Modsy, HOVER, NavVis.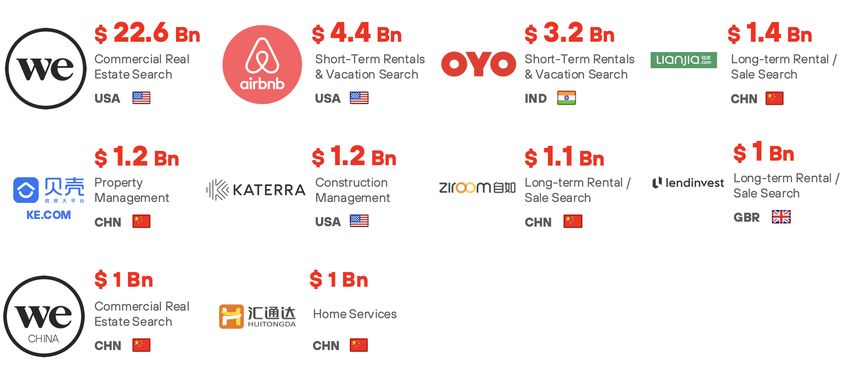
7 - PropTech Global Trends 2021 Barometer                                       PropTech: Investing, Building,
                                                                         Managing and Living in a digital world.

PropTech Company Categories

MANAGING

Short-term rentals/                     Long-term rentals/Sale                Commercial Real Estate
vacation search                         search                                Tools that allow individual clients
Consumer tools that help arrange        Companies that help arrange and       and businesses to rent or buy
and offer short-term homestays          offer long-term homestays and         commercial real estate. These
and holiday rentals. These include      help consumers sell or purchase       range from traditional commercial
platforms offering individuals’         listed properties. These companies    real estate search engines to
real estate rental listings and the     receive a commission for every        coworking space search engines
well-known traditional holiday          transaction they facilitate. E.g.,    that rent out coworking space to
rental search engines. E.g., Airbnb,    VivaReal, Compass, Quikr, Apart-      companies or individuals who can
Hoteltonight, HomeAway, Tujia,          mentList, Ziroom, Opendoor.           obtain leases by the hour, day,
ClearTrip, Expedia.                                                           week, month, or year. E.g., The We
                                                                              Company (WeWork), Kr Space,
                                                                              breather, Industrious, Lmeet,
                                                                              Ucommune.

Real Estate Agent Tools                 Property Management
Tools that benefit real estate agents   Technologies that help oversee,
within the property industry in         preserve, and enhance the
terms of speed, efficiency, quality,    management and the value of rental
and technologies that automate          income-properties, such as tenant
their roles. These can include          and payment management, as well
real estate specific CRMs, real         as cutting-edge communication,
estate agent review platforms, and      design, and servicing tools. E.g.,
marketing tools. E.g., HomeLight,       ResMan, BuildingEngines, Buildium,
ribbon, Yopa, Pacester, Opcity,         Cozy, Appfolio, Hostmaker.
Qualia.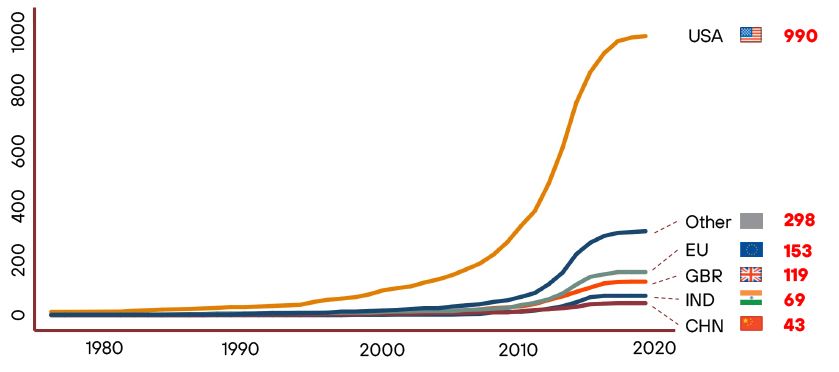
8 - PropTech Global Trends 2021 Barometer                                                          PropTech: Investing, Building,
                                                                                            Managing and Living in a digital world.

PropTech Company Categories

LIVING

Facility Management                        Life, Home,                                                   Home services
                                           P&C Insurance
These are tools that employ                                                                              Platforms and technologies
proprietary energy intelligence            PropTech companies that                                       that help homeowners manage
software and energy-efficient              principally offer homeowners and                              and maintain their homes, as
technology to measure, control,            tenants life, home and property                               well as complete renovations by
and optimize energy usage and              insurance, some of which are                                  connecting them with quality home
efficiency. They reduce energy             powered by artificial intelligence                            improvement professionals. E.g.
costs and the carbon footprint             and behavioural economics.                                    ServiceTitan, Houzz, Thumbtack,
of several property types. E.g.,           E.g. Lemonade, TheGuarantors,                                 Handy, Porch, Clutter.
Verdigris, SMSAssist, Budderfly,           Microensure, Jetty, Neos, Kin.
Entouch, Aquicore.

                                       Table 1: Overview of 12 PropTech Categories
                                           Category                                           Companies1         Investment              Countries
                                                                                                                  ($ Billion)2

IoT Home                                   Commercial Real Estate Search                            91                27.6                  25

Internet of Things are devices             Short-Term Rental/Vacation                               120               13.68                 24
                                           Search
specialized in providing solutions
and improving management in                Long-Term Rentals/Sale Search                            184               9.86                  33
the home, such as home security,           Life, Home, Property & Casualty                          166               9.58                  26
home automation and energy                 Insurance
management. E.g. Trado, KeyMe,             Home Services                                            169               7.84                  29
Eero, View, Netatmo, EightSleep.
                                           Portfolio Management                                     201               4.61                  23

                                           Facility Management                                      128               4.45                  20

                                           IoT Home                                                333                4.41                  32

                                           Property Management                                      169                3.11                 26

                                           Construction Management                                  138               2.92                  21

                                           Real Estate Agent Tools                                  88                2.75                  15

                                           Indoor Mapping                                           36                0.53                  14

                                       1
                                           As of December, 2019 -   2
                                                                        Investment period: 2000 to 2019 - Data source: Venture Scanner
9 - PropTech Global Trends 2021 Barometer
The Global
PropTech Industry
As the number of PropTech companies has increased over time, so has the global
outreach of these companies; they are now present in 64 countries worldwide.
Ever since the first PropTech company was founded in 1976, the US has been holding the
reigns and dominating the PropTech industry, with 60% of PropTech companies located
in the United States, followed by India and EU. See Figures 1 and 2 below.
12 1,724 3,118
CATEGORIES COMPANIES INVESTORS
64 $84.4
COUNTRIES BILLION
RAISED (2000-2019)10 - PropTech Global Trends 2021 Barometer The Global PropTech Industry
1,724 PropTech Figure 1: Emergence of PropTech Companies Over Time
companies unequally
spread in 64 countries
The USA and its enormous quantity of
PropTech companies, 990 to be exact,
overshadows the rest of the world.
By excluding the USA, we gain pers-
pective on the relative importance of
other markets. Continental Europe, the
UK and India appear to be the largest
PropTech markets outside of the USA
by a significant large margin.
See Figure 2 and 3 below.
Figure 2: Global Distribution of PropTech Companies
58%
4 to 10%
3 to 4%
58%
1 to43%
to 10%
0 to3 to
1%4%
1 to 3%
0 to 1%
Figure 3: Global distribution of PropTech companies excluding USA
10 to 20%
5 to 10%
3 to 5%
10 to 20%
1 to 3%5 to 10%
3 to 5%
0 to 1%
1 to 3%
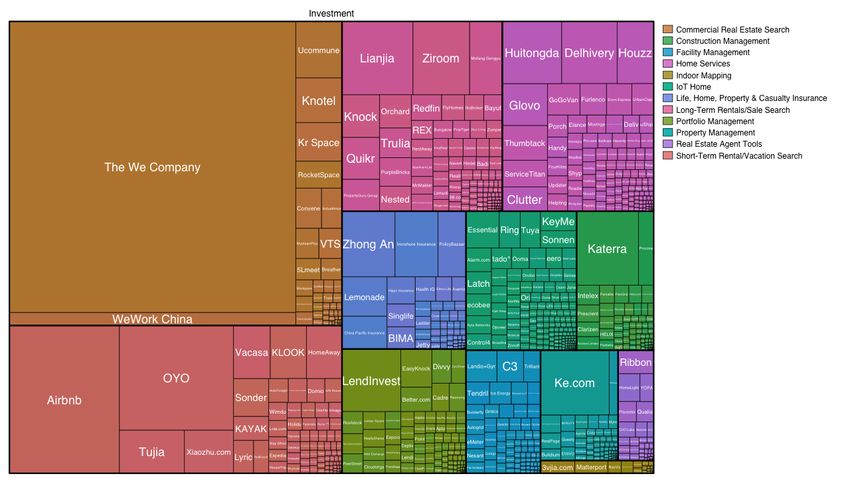
0 to 1%11 - PropTech Global Trends 2021 Barometer The Global PropTech Industry Investment and funding structure of the PropTech Industry Given the geographic distribution of companies, it is not a surprise that among the top 10 global PropTech companies, three are American, five are Chinese, one is British, and one is Indian. The top two largest companies are based in the US. The We Company sits firmly at the top with a $22.5 Billion investment raised, which is more than five times the size of second place, Airbnb, with $4.4 Billion raised. Albeit boasting the highest number of PropTech companies after the US and India, the UK does has only one company in the top 10. The largest UK PropTech company, LendInvest, has raised $993 Million. Due to a smaller number of Chinese PropTech companies, most of the total investment funds raised are concentrated among a smaller set of companies. Despite the fact that 5 of the top 10 companies are based in China, they account for 15% of the total investment among these top 10 firms. See Figure 4. Interestingly, the We Company, the largest PropTech company in the world in terms of investment funds raised, received nearly $1.7 Billion cash injection from Soft- bank in October 2019 as a rescue package to help WeWork fight against bankrup- tcy as its valuation plummeted from $47 Billion to $8 Billion in a matter of mon- ths. However, this investment fund giant may pull out from a $3 Billion purchase of shares after US securities regulators have been scrutinising the office space provi- der for their presentation of its financials and valuation to investors and employees. Therefore, the We Company’s domination may turn out to be short-lived. Figure 4: Top 10 Global PropTech Companies by Investment of Funds Raised (2000-2019)
12 - PropTech Global Trends 2021 Barometer                               The Global PropTech Industry

Investments per category
The category with the highest volume of investment funds raised is Commercial Real
Estate Search, primarily due to the We Company that has raised not only the highest
level of investment funds in its category but also raised more than the combined funds
raised in each category. Figure 5 shows that in almost every single PropTech category,
apart from Home Services, only one or two companies tend to dominate the market,
alongside several smaller firms operating.

Figure 5: investment funds raised per company per category (2000-2019)

    Commercial Real             Long-Term Rentals /                               Construction
                                                         Home Services
    Estate Search               Sale Search                                       Management
    Short-Term Rentals          Life, Home, Property &                            Property
                                                         IoT Home
    / Vacation Search           Casualty Insurance                                Management
                                Portfolio                Facility                 Real Estate Agent
                                Management               Management               Tools

                                                                                  Indoor Mapping
13 - PropTech Global Trends 2021 Barometer The Global PropTech Industry
Investments per category
Figure 6 reveals that these enormous investment fund volumes are a recent phenomenon.
The PropTech investment boom started post-2014; the first and largest peak in PropTech
investment occurred in 2015 in the Short-Term Rental/Vacation Search category – this
was largely influenced by the surge of investments in Airbnb. This company has the
highest number of investors among all PropTech companies with a total of 47 different
investors.
The boom in that category triggered a sporadic surge in investments in several catego-
ries, notably Long-Term Rentals/Sale Search, Commercial Real Estate Search and Real
Estate Agent Tools.
Figure 6: Total investment ($ Billion) over time per category (2000-2019)
25
25
Short-Term Rentals / Vacation Search 4.94
20
20
Investment (USD Bil.)
Home Services 4.28
Investment ($ Bn)
15
15
Property Management 2.42
2.27
10
Commercial Real Estate Search
10
Real Estate Agent Tools 0.49
55
Construction management 0.46
0.24
00
Indoor Mapping
2000 2005 2010 2015 2020
2000 2005 Year
2010 2015 2020
Real Estate Search Construction Management
Home Services Short−Term Rental Search
Indoor Mapping Real Estate Agent Tools
Property Management
66
Investment (USD Bil.)
Long-Term Rentals / Sale Search 5.55
44
Investment ($ Bn)
Life, Home, Property & Casualty Insurance 2.71
Portfolio Management 2.45
IoT Home 0.78
22
Facility Management 0.32
00
2000 2005 2010 2015 2020
2000 2005 Year
2010 2015 2020
Facility Management Portfolio Management
Insurance (Home & Property) IoT Home
Long−Term Rental/Sale Search14 - PropTech Global Trends 2021 Barometer The Global PropTech Industry
Investments per category
An overview of the top 3 PropTech companies within each category is presented
in Table 2
Table 2: Top Three PropTech Companies In Each Category
Category Companies Investment Region Country
($ Billion)
Commercial Real Estate Search The We Company 22.55 New York USA
WeWork China 1.00 Shanghai CHN
Ucommune 0.70 Beijing CHN
Construction Management Katerra 1.24 CA USA
Procore 0.30 CA USA
Intelex 0.12 Ontario CAN
Facility Management Landis+Gyr 0.27 Stockholm SWE
C3 0.23 CA USA
Trilliant 0.15 CA USA
Home Services Huitongda 1.00 Jiangsu CHN
Delhivery 0.93 Haryana IND
Houzz 0.61 CA USA
Indoor Mapping 3vjia.com 0.12 Guangdong CHN
Matterport 0.11 CA USA
NavVis 0.05 Bayern DEU
IoT Home Essential 0.33 CA USA
Ring 0.21 CA USA
Tuya 0.20 Zhejiang CHN
Life, Prop. & Casualty Insurance Zhong An 0.94 Shanghai CHN
Ironshore Insurance 0.76 GA USA
PolicyBazaar 0.50 Haryana IND
Long-Term Rentals/Sale Search Lianjia 1.41 Beijing CHN
Ziroom 1.12 Beijing CHN
Mofang Gongyu 0.65 Shanghai CHN
Portfolio Management LendInvest 0.99 England GBR
EasyKnock 0.32 New York USA
Better.com 0.21 New York USA
Property Management Ke.com 1.20 Beijing CHN
58fangdai 0.16 Jiangsu CHN
Evolve Vac. Rental Network 0.10 CO USA
Real Estate Agent Tools Ribbon 0.23 New York USA
HomeLight 0.16 CA USA
YOPA 0.10 England GBR
Short-Term Rental/Vac. Search Airbnb 4.40 CA USA
OYO 3.23 Haryana IND
Tujia 0.76 Beijing CHN15 - PropTech Global Trends 2021 Barometer The Global PropTech Industry
Funding structure of PropTech companies
It was the year 2014 when investment in PropTech companies shot up. After a plateau for
many years, a sudden surge in investment occurred, primarily made up of funds raised
through private equity.
For the next two years, from 2014-2016, the level of investment in the PropTech market
remained consistent. However, another spike in 2017 rocketed the growth of PropTech
investment exponentially. 2017 experienced significant growth in investment, thanks to
Series G funding and 2017 set the record for the year with the highest investment in
PropTech, reaching almost $41.9 Billion. Investment remained at a similar level in 2018
and funds raised somewhat evenly among the major funding types. See Figure 7 for a
visual representation of the growth in PropTech investment by funding type over the
years.
Figure 7: Evolution of investment Type in PropTech
40
Funding Type
Angel and Seed
30
Series A, B, C and Convertible Note
Investment ($ Bn)
Series D, E and F
20
Serie G, H and Venture, Private Equity
Post IPO Equity
Debt
10
Corporate, Equity and Product
Crowdfunding, Grant and Other
0
2000 2005 2010 2015 2020
Funding Year16 - PropTech Global Trends 2021 Barometer The Global PropTech Industry
Funding structure of PropTech companies
Figure 8 depicts the volume of funds raised during the lifespan of PropTech companies
and identify the funding types used. As expected, the first year experiences the highest
investment amount because a significant amount of investment is needed during a
company’s growth period. This amount drops off every year, except in the sixth year
when a large portion of PropTech companies decide to undertake Initial Public Offerings
(IPOs). After this sixth year, investment in a PropTech company decreases sharply
to around $1 Million, on average. This is because companies that have survived for
more than six years tend to be well-established, well-reputed, and financially stable.
Therefore, such companies typically do not need large sums of money right after the
IPO. It is important to note that given the recent upsurge in the number of new PropTech
companies and the recent spike in investment within this sector, this graph will change
to better represent the investment activity in a PropTech company.
Figure 8: Investment in PropTech Companies over Lifespan
40
Funding Type
Angel and Seed
30
Series A, B, C and Convertible Note
Investment ($ Bn)
Series D, E and F
20
Serie G, H and Venture, Private Equity
Post IPO Equity
Debt
10
Corporate, Equity and Product
Crowdfunding, Grant and Other
0
0 5 10 15 20
Company Age17 - PropTech Global Trends 2021 Barometer The Global PropTech Industry
3,118 investors worldwide mainly from the US
The USA is the country with the highest number of investors, followed by the EU and
the UK. Just as 60% of PropTech companies are from America, 60% of all PropTech
investors have invested in the USA. China has the highest proportion of large investors,
and the rest of the world (‘Other’) has the lowest. See Figure 9
Figure 9: Total number of investors per country (region)
USA 1911
Other 552
EU 280
GBR 217
CHN 177
IND 157
CAN 116
0 500 1000 1500 2000
The category with the highest number of investors is IoT Home followed closely by Home
Services. In contrast, the category with the least number of investors is Indoor Mapping,
which is also the category with the least amount of funds raised. See Figure 10
Figure 10: Total number of investors per category
IoT Home 747
Home Services 664
Long-Term Rentals/Sale Search 510
Portfolio Management 453
Short-Term rental/Vacation search 434
Facility Management 386
Construction Management 343
Commercial Real Estate Search 318
Life, Home, Property & Casualty Insurance 273
Property Management 263
Real Estate Agent Tools 170
Indoor Mapping 104
0 100 200 300 400 500 600 700 80018 - PropTech Global Trends 2021 Barometer The Global PropTech Industry
PropTech Investors
Figure 11 reveals that the larger the investor, the greater the number of different PropTech
companies it invests in. These influential companies have the liberty to reduce their
investment risks by diversifying their investment portfolio across many companies.
Smaller investment companies with fewer available funds tend to invest proportionally
higher amounts in a smaller number of PropTech companies to keep their profit margins
high. As a result, these smaller investors have a less diversified portfolio. Therefore, they
take bigger risks to keep up with the larger PropTech investors.
Figure 11: relationship between investor size3 and the average number of PropTech com-
panies in which they invest
6
5
4
3
2 1
0
1 2 3 4 5 6 7 8 9 10
Size of investor (by decile)
3
Investor size is defined a normalized to be between 1 and 10 based on which decile the investor’s investment falls in: an investor with a size of 1 means he is in the first decile
and that at least 10% of the investors have smaller investments than this investor.19 - PropTech Global Trends 2021 Barometer
Focus on the US
PropTech Industry
An increasing number of American PropTech companies
The PropTech sector in the United States is the largest PropTech market in the
world, accounting for 56% of the world’s companies and 62% of all PropTech
investment. Unsurprisingly, the global trend of PropTech companies is mainly driven
by the US. Because of this mammoth size of the US PropTech market, we dedicate
a separate section to this country. In the following section, we will review figures
again but then for the rest of the world and show trends in relative terms by excluding
12
CATEGORIES
2,024
INVESTORS
965
COMPANIES
$51.9
BILLION RAISED20 - PropTech Global Trends 2021 Barometer Focus on the US PropTech Industry
An increasing number of American PropTech companies
Figure 12 demonstrates that the number of new US PropTech companies has been
consistently increasing since the turn of the century and reached its highest figure in
2014 before experiencing an unprecedented decrease. Over time, the quality of these
companies has consistently been medium to high, with the proportion of low-quality
companies each year averaging at only 6%. See Figure 13
Figure 12: number of new US PropTech companies founded over time by quality*
(1976-2019)
500
Medium 486
High 427
400
300
200
100
Low 77
0
1980 1990 2000 2010 2020
*Note: The quality of a company is based on the assessment of their health, as measured by a variety of company
metrics, such as funding, headcount, and founding date and is derived programmatically using Venture Scanner
algorithms. Companies are scored relative to one another for the categories they are in.
Figure 13: Evolution of the Proportion of low, Medium and High Quality Companies
(2000-2019)
100%
Medium
80%
60%
40%
20%
High / Low
0
2000 2005 2010 2015 202021 - PropTech Global Trends 2021 Barometer Focus on the US PropTech Industry
Despite the number of new PropTech companies slowing since 2014, PropTech
investments remain very attractive to investors. The annual investment funds raised by
US PropTech companies are nonetheless still experiencing an upward trend since 2013,
showing that the interest in PropTech continues to thrive and spread among investors.
See Figure 14
Figure 14: Total investment in US PropTech Companies Over Time
Amount Invested ($ Bn)
20
10
0
2000 2005 2010 2015 2020
IoT Home is the leading category of US PropTech companies with 19% of the total
number of US PropTech companies specialising in Internet of Home smart devices,
followed by Portfolio Management and Home Services, each representing 13%
and 10% of the market share respectively. See Figure 15
Figure 15: Distribution of US PropTech Companies by Category
19% 13% 10% Note: Other categories include:
Short-Term Rental/Vacation Search,
IoT Home Portfolio Property Management
Management Commercial Real Estate Search and
Indoor Mapping.
9% 9% 9% 9%
Construction Facility
Home Services Other Categories
management Management
8% 7% 7% 7%
Long-term Rental / Commercial Real Real Estate Life, Home, Property &
Sale Search Estate Agent Tools Casualty Insurance22 - PropTech Global Trends 2021 Barometer Focus on the US PropTech Industry
American PropTech companies per category
Figure 16 demonstrates that despite the consistent domination of the 4 PropTech
categories IoT Home, Construction Management, Facility Management and Portfolio
Management, in the recent years the market has experienced a shift towards Property
Management, which in the 2016-2019 period has represented 13% of US PropTech
companies. After IoT Home’s peak in the 2011-2019 period, their market share has more
than halved in the 2016-2019 period, dropping from 24% to 11%.
Figure 16: Changes in Composition of US PropTech Companies by Categories
14% 13% 11% IoT Home
24% Construction Management
11%
13%
15% 3% Facility Management
5%
13% 7% 11% Portfolio Management
18% Property Management
8% 15% 13% Home Services
10% 11% Long-Term Rentals / Sale Search
8% 10%
Short-Term Rentals / Vacation Search
10% 8%
11% 10% Real Estate Agent Tools
3%
9% 4%
10% 8% Commercial Real Estate Search
9%
8% 5%
5% Life, Home, Property & Casualty Insurance
5% 7% 7% 9%
Indoor Mapping
7% 5% 3%
6% 9%
4% 4%
1% 2% 1%
2000-2005 2005-2010 2011-2015 2016-2019
Focusing on the top 4 PropTech categories in Figure 17 further emphasises their
decreasing domination in the US PropTech market, making room for other categories
such as Property Management to excel. Due to this re-balancing of the proportion of
US PropTech companies per category, the market is starting to become more evenly
distributed and all 12 PropTech categories are looking attractive to potential investors.
Figure 17: Changes in Composition of US PropTech Companies in the top 4 Categories
100%
14%
90%
13% 11%
80%
24%
70%
15% IoT Home
60%
13%
11% Construction Management
50%
5%
Facility Management
40%
7% Portfolio Management
18% 3%
30% 13%
20%
15% 11%
10%
10% 8%
0%
2000-2005 2005-2010 2011-2015 2016-201923 - PropTech Global Trends 2021 Barometer Focus on the US PropTech Industry American PropTech companies across the country US PropTech companies are located across 41 states. From 2000-2005 the distribution of PropTech companies in the US was relatively even across the US. However, over time the two states that have witnessed a spike in numbers of PropTech companies are California and New York. California’s numbers notably shot up in 2010. By 2015 New York made a huge leap in the figures. However, it now appears that other states have caught on to the PropTech boom as the state of Texas has recently experienced an enormous surge in their numbers, bringing them close to New York who seems to be slowing down. California nonetheless remains far ahead with 423 PropTech companies in 2019. See Figure 18 Figure 18: Evolution of the Number of PropTech Companies over Time in United States
24 - PropTech Global Trends 2021 Barometer                            Focus on the US PropTech Industry

Investment: an industry dominated by a few companies
From 2000 to 2019, the total investment volume in the US has increased by 2,932%,
from $895 Million to $27.1 Billion. The Top 10 US PropTech companies have raised in
total $36.3 Billion, with The We Company responsible for 62% of that. These 10 companies
have raised 55% of the total investment funds raised by all US PropTech companies.

Table 3: Top 10 US PropTech Companies

 Companies                              State        Amount Raised ($ Billion)     Investor Count

 1             The We Company           New York              22.55                      26
 2             Airbnb                   California             4.40                      62
 3             Katerra                  California             1.24                       12
 4             Ironshore Insurance      Georgia                0.76                       3
 5             Houzz                    California             0.61                      20
 6             Knotel                   New York               0.56                      26
 7             Vacasa                   Oregon                 0.52                       13
 8             HomeAway                 Texas                  0.51                       14
 9             Lemonade                 New York               0.48                       31
 10            Knock                    New York               0.43                       21
25 - PropTech Global Trends 2021 Barometer                        Focus on the US PropTech Industry

Investment: an industry dominated by a few companies
Of the top 10 US PropTech companies (Figure 19 and Table 3) all were founded in the 21st
century, bar Vivint Smart Home, showing that these are all companies that have evolved
at the same time and at the same speed as the digital evolution and have been able to
capitalise on the growing number of technologies and tools accessible to them
With regards to their geographical location, 8 out of the top 10 PropTech companies
are from either California (6) or New York (2), with the other two coming from Utah
and Georgia. Clearly, PropTech companies founded in these two American PropTech
hotspots have a better chance of growing given the close proximity to investors. Of
these ten companies, Airbnb has the most investors with 47, and Ironshore Insurance
has the least with 3 – the average number standing at 19 investors.

Figure 19: Investments in Top US PropTech Companies

            $ 22.6 Bn                        $ 4.4 Bn                         $ 1.2 Bn
            Commercial Real                  Short-Term Rentals               Construction
            Estate Search                    & Vacation Search                Management

            $ 0.6 Bn                         $ 0.6 Bn                         $ 0.5 Bn
                                             Commercial Real                  Life, Home, Property
            Home Services
                                             Estate Search                    & Casualty Insurance

            $ 0.5 Bn                         $ 0.4 Bn                          $ 1.4 Bn
            Short-Term Rentals               Real Estate Agent                 Life, Home, Property &
            & Vacation Search                Tools                             Casualty Insurance

            $ 0.5 Bn
            Long-term Rental /
            Sale Search
26 - PropTech Global Trends 2021 Barometer Focus on the US PropTech Industry
Investment per category and company
Of the 12 categories, Commercial Real Estate Search is the US PropTech category with
the highest amount of investment funds raised, primarily due to We Company that
dwarves all other companies. The smallest category on the other hand is Indoor Mapping
which has both a small number of US PropTech companies as well as a small number of
investment funds raised. See Figure 20
Figure 20: Distribution of Investments by Company & Category
Commercial Real Real Estate Agent
Home Services IoT Home
Estate Search Tools
Short-Term Rentals Portfolio Construction Property
/ Vacation Search Management Management Management
Long-Term Rentals / Facility
Indoor Mapping
Sale Search Management
Life, Home, Property &
Casualty Insurance27 - PropTech Global Trends 2021 Barometer Focus on the US PropTech Industry
Funding structure of American PropTech companies
The total funding in the US PropTech market has exponentially increased over time
(Figure 21). By categorising the funding into 21 different sources, we can see that Series
financing is the funding type that has contributed the most to the PropTech market.
Figure 21: Investment by Funding Type over Time
Funding Type
30
Angel and Seed
Series A, B, C and Convertible Note
20
Investment ($ Bn)
Series D, E and F
Serie G, H and Venture, Private Equity
Post IPO Equity
10
Debt
Corporate, Equity and Product
Crowdfunding, Grant and Other
0
2000 2005 2010 2015 2020
Figure 22 reveals which funding types are employed at different periods of the companies’
growth. Clearly, traditional start-up financing methods are employed in the early years
of companies’ existence, such as Seed and Series A-D financing. Meanwhile, companies
tend to employ Debt financing once they have established themselves in the market
for around 8 years, raising the highest volumes of investment funds. Further down the
line, late Series H financing occurs round and about the 11th year mark, possibly due to
mergers and acquisitions.
Figure 22: Investment by Funding Type over Company Age
Funding Type
30
Angel and Seed
Series A, B, C and Convertible Note
Series D, E and F
20
Serie G, H and Venture, Private Equity
Post IPO Equity
10
Debt
Corporate, Equity and Product
Crowdfunding, Grant and Other
0
0 5 10 15 20
Company Age28 - PropTech Global Trends 2021 Barometer Focus on the US PropTech Industry
California: the financial heart of the American PropTech industry
In correspondence to the high density of PropTech companies in California, New York
and Texas, these three states have also raised the highest volume of investment funds.
While only a small number of investors have targeted PropTech companies from Utah,
this state nonetheless has one of the greatest ratios of large investors. See Figure 23
Figure 23: Distribution of Investors by State
1200
1105
1000
800
600
538
400
137 106
200 147
116 104
59 55 46
38 36 36 33 30 26 24 23 21
15 13 12 8 7 7 6 6 4 3 2 1 1 1 1 1 1
0
NY
HI
WA
PA
CO
UT
NE
MI
DC
CT
MO
VA
NJ
ME
NC
NH
MN
TN
FL
WI
MD
CA
OH
RI
IN
NV
MA
IL
ID
SC
GA
AZ
IA
OR
TX
KS
IoT Home and Home Services are the two categories with the highest number of inves-
tors. This comes as no surprise as IoT Home is the category with the largest number of
US PropTech companies, and Home Services is third, just after Portfolio Management.
See Figure 24
Figure 24: Distribution of Number of Investors by Category
IoT Home 553
Home Services 473
Portfolio Management 371
Facility Management 304
Construction Management 268
Long-Term Rentals/Sale Search 259
Short-Term Rental/Vacation Search 242
Commercial Real Estate Search 189
Life, Home, Property & Casualty Insurance 179
Real Estate Agent Tools 135
Property Management 121
Indoor Mapping 72
0 100 200 300 400 500 60029 - PropTech Global Trends 2021 Barometer Focus on the US PropTech Industry
Table 4: Top 10 Investors in US PropTech Companies
Companies Amount Invested ($Billion)
SoftBank Vision Fund 5.46
Hony Capital 5.09
Sequoia Capital 4.13
T. Rowe Price 3.33
Kleiner Perkins 2.39
Wellington Management 2.33
GGV Capital 2.25
Fidelity 2.21
Tiger Global Management 2.05
JP Morgan Chase 1.83
The category with the largest volume of investment is Short-Term Rental/Vacation
Search, largely influenced by PropTech giant Airbnb and its 47 investors. The smallest
is yet again Indoor Mapping.
While Figure 20 shows that a large amount of the investment funds are concentrated
among a small number of PropTech companies (the top 10 US PropTech companies have
raised more than half the total US investment funds), Figure 25 reveals that each PropTech
category benefits from a wide range of investors, none of which monopolize their
category (with the exception of the Commercial Real Estate Search category where Hony
Capital and Softbank Vision Fund take up a large share of the investment funds raised).
This resulting investor equilibrium allows for a balanced and stable market dynamic which
will see the PropTech companies continue to raise funds and grow, as well as providing
them with good security in the event of an unexpected crisis.
Figure 25: Distribution Investment Volume by Investors & Category
Short-Term Rentals Construction
/ Vacation Search Management
Commercial Real Facility
Estate Search Management
Long-Term Rentals /
Home Services
Sale Search
Portfolio Real Estate Agent
Management Tools
Life, Home, Property & Property
Casualty Insurance Management
IoT Home Indoor Mapping30 - PropTech Global Trends 2021 Barometer
The PropTech Industry
in the Rest of World
This section covers the PropTech industry of the rest of the world, excluding the United
States. As noted earlier, the US is the largest market for PropTech industry accouting for
approximately 56% of all PropTech companies. This section focuses on the remaining
54% of the firms, their investors and their investment patterns. These firms are spread
all across the rest of the world, with some countries like United Kingdom, Germany,
China, and India, leading the charge. Hence, the following figures and tables will focus
exclusively on the PropTech industry outside the United States. It will provide a finer
analysis where it can be observed that no one single market dominates the others to
shift the focus of the analysis.
12
CATEGORIES
761
COMPANIES
1,642 $32.5
INVESTORS Billion RAISED
(2000-2019)31 - PropTech Global Trends 2021 Barometer The PropTech Industry in the Rest of World
PropTech companies across
western countries and emerging giants
To start with, Figure 26 shows the distribution of the categories of PropTech companies
in the rest of world. The Internet of Things (IoT) category is leading the pack with 16%
of the companies, followed closely by Long-Term Sales or Sale Search category with
14% of the companies. The rest of the companies are approximately evenly distributed
among a handful of categories, where each category has somewhere between 7% and
11% of the companies. This composition shows a healthy diversity in the different sectors
of the economy, highlighting the fact that the industry is large and has several potential
areas that are just experiencing technological revolution. As we will see in the later parts
of this section, investors acknowledge this diversity and hedge their investments across
the different categories.
Figure 26: Distribution of PropTech Companies by Category
17% 16% 14%
IoT Home Long-term Rental /
Other Categories
Sale Search
11% 9% 9%
Life, Home, Property Short-Term Rentals /
Home Services
& Casualty Insurance Vacation search
9% 8% 7%
Portfolio Property Commercial Real
Management Management Estate
Note: Other categories include: Faclity Management, Construction Management, Real Estate Agent Tools,
and Indoor Mapping.32 - PropTech Global Trends 2021 Barometer The PropTech Industry in the Rest of World
Investment opportunities are concentrated
in a few Indian and Chinese Proptech companies
Starting with investment made, first Figure 27 depicts the investment in each company and
sector relative to other companies. It is clear that the two major categories here again are
Long Term Rentals or Sales Search, and Home Services. Companies categorized as Real
Estate Agent Tools and Commercial Real Estate Search also attract significant amounts of
investment.
If you look at the distribution of investment across companies within a category, we see
that within the Long Term Rentals or Sales Search, the investment is concentrated among a
few top companies, namely Oyo, Tujia, Xiaozhu.com, and Klook. This kind of concentration
is also represented in the few smaller categories of Property Management, Portfolio
Management, and Life, Home, Property and Casualty Insurance. The biggest category
here, namely Home Services, and a couple of medium sized ones, exhibit a more uniform
distribution of investment funds within the category.
Figure 27: Distribution of Investments by Company & Category
Short-Term Rentals Commercial Real
Home Services IoT Home
/ Vacation Search Estate Search
Long-Term Rentals / Life, Home, Property & Portfolio Construction
Sale Search Casualty Insurance Management Management
Property Facility Real Estate Agent
Management Management Tools
Indoor Mapping33 - PropTech Global Trends 2021 Barometer The PropTech Industry in the Rest of World
Funding structure of non-US PropTech companies
Figure 28 presents the breakdown of the investment by the funding type over the years
in PropTech companies. The first thing to notice here is that the investment levels
experienced sharp increases starting in the year 2014. The second thing to notice in
this figure is that there are many different types of investment received by these firms and
they vary significantly in nature. For example, there are Angel investments, grants, equity,
venture capital investment, Series A to H, and also debt. As for the trends, in Figure 28 one
can observe that early in 2014 and 2015, Series A, Series B, Seed and Angel made up most
of the investment.
However, as years went by, the trust of investors built up and this was represented in senior
Series like C, D and E, along with private equity, came in to the mix. This trend is indicative
of investor sentiment developing from cautious to confident. The dominance of senior
series is also indicative of the very important underlying fact that the companies that
received Series A and Series B were able to achieve their growth targets to become
eligible to receive the senior series investment like Series C, D, and E. Hence, these
investment trends signify that many PropTech firms were been successful in achieving
their growth targets in terms of revenue and profitability in a manner that demonstrated to
the investors that there is significant potential in these companies to address the needs
of the market. This also demonstrates that the PropTech industry is growing across the
world, not just in the United States, and also gaining investor confidence.
Figure 28: Investment by Funding Type over Time
Funding Type
20
Angel and Seed
Series A, B, C and Convertible Note
15
Investment ($ Bn)
Series D, E and F
Serie G, H and Venture, Private Equity
10
Post IPO Equity
Debt
5
Corporate, Equity and Product
Crowdfunding, Grant and Other
0
2000 2005 2010 2015 202034 - PropTech Global Trends 2021 Barometer The PropTech Industry in the Rest of World
Funding structure of non-US PropTech companies
A related but different angle of this story is depicted in Figure 29 where you see how the
type of funding changed with the company age. It shows that when a company is in the
early days of operation, it is looking for investors, so it is able to get mostly seed money,
angle investment and Series A or B. As the company ages and is able to demonstrate
its success to the market and investors, the company attracts other forms of investment
in the form of Series C, D, and E, along with private equity and post-IPO equity, if the
company decides to go public.
Figure 29: Investment by Funding Type over Company Age
10
Funding Type
Angel and Seed
7,5
Series A, B, C and Convertible Note
Investment ($ Bn)
Series D, E and F
5
Serie G, H and Venture, Private Equity
Post IPO Equity
2,5
Debt
Corporate, Equity and Product
Crowdfunding, Grant and Other
0
0 5 10 15 20
Company Age35 - PropTech Global Trends 2021 Barometer The PropTech Industry in the Rest of World
Most investors are from
Europe, India and China
Figure 30 shows the distribution of
number of investors in each major
country, other than United States. Figure 30: Number of Investors by Country
The two biggest markets in this
250
figure are from Europe, namely 221
United Kingdom in the first position 200
197
182
followed by Germany in the second. 180
Perhaps, not surprisingly, the third and 150
fourth positions are grabbed by India 117
and China, respectively, both of which 100
104
are the two Asian giant economies 77
72
comprising the BRIC (Brazil, Russia,
50
China, and India). It is encouraging to 31 30 30
see these countries boast 170 to 220 0
investors each, indicating significant GBR DEU IND CHN CAN SGP FRA ESP AUS ISR SWE
investor interest from these markets.
Following up on the distribution of investors across countries, we explore the distribution
of investors across the different PropTech sectors, as shown in Figure 31. Here we see that
Long-term rentals and sales search is leading the way with the most number of investors,
followed by Home Services, Internet of Thing (IoT) and Short-term rentals or vacation
search. Clearly, PropTech companies that facilitate the search of properties either for
short vacation, long term rental or even sale, are of prime interest for investors, in terms
of the number of different investors. In this regard, Commercial Real Estate Search has
also attracted a significant number of investors.
Figure 31: Number of Investors by Category
Long-Term Rentals/Sale Search 271
Home Services 263
IoT Home 229
Short-Term rental/Vacation search 214
Commercial Real Estate Search 149
Property Management 146
Life, Home, Property & Casualty Insurance 108
Facility Management 90
Portfolio Management 89
Construction Management 80
Real Estate Agent Tools 36
Indoor Mapping 33
0 50 100 150 200 250 30036 - PropTech Global Trends 2021 Barometer The PropTech Industry in the Rest of World Top Investors The investment amount of the top ten investors are presented in Table 5. Similar to the case of United States, the biggest investor is SoftBank Vision fund with $2.77 Billion invested across various PropTech firms in different categories. Tencent Holdings is close behind with $2.52 Billion of investment. After that, the investments of the remaining 8 have investment levels between $1 Billion and $1.8 Billion, which is a fairly uniform distribution. This shows that these investors have similar sized total amounts invested in the whole PropTech industry, with little variation. This pattern is consistent with the one in Figure 32, which showed that the investments of different investors were evenly distributed across PropTech firms and categories. These patterns also illustrate that the PropTech industry is relatively young but attractive to investors. In the future, we expect these investment levels to grow as more firms enter the market, and existing firms grow in the industry, requiring further investments to expand their operations. We also expect that as firms mature, the uniform distribution may skew, to some extent, in favor of a subset of firms which demonstrate success and good returns for investors. Table 5: Top 10 Investors Investor Amount Invested ($Billion) SoftBank Vision Fund 2.77 Tencent Holdings 2.52 Sequoia Capital China 1.78 Sequoia Capital India 1.5 Lightspeed Venture Partners 1.35 Wellington Mgt. 1.3 Hillhouse Capital Group 1.11 CDH Investments 1.09 Tiger Global Mgt. 1.04 IDG Capital 1.01
37 - PropTech Global Trends 2021 Barometer                    The PropTech Industry in the Rest of World

Investment Strategy
Looking at the investments made by each investor in each category, we can see a much
more uniform pattern in Figure 32. This shows that most investors prefer to hold di-
versified portfolios, so that the risk levels do not increase with investments size.
Even the biggest investor, Soft Bank Vision Fund, has several small positions across the
many different categories. No single category is dominated by a few big investors. There
are a couple of Notable Exceptions, like Tencent Holdings, which has the largest invest-
ment shares in both the Long-Term Rentals or Sales Search, as well as in the Property
Management category. But here the largest shares even here represent a less than 10% of
the total investment within these categories.
This figure clarifies the position of investors about investing across all categories of
the PropTech industry and not focusing on a few top ones. Also, no single category is
dominated by a small number of investors.

Figure 32: Distribution of the Investment Volume by Investors & Category

     Long-Term Rentals /       Commercial Real
                                                       Home Services           IoT Home
     Sale Search               Estate Search
     Short-Term Rentals       Life, Home, Property &   Facility                Construction
     / Vacation Search        Casualty Insurance       Management              Management
                              Property                 Portfolio              Real Estate Agent
                              Management               Management             Tools

                                                                              Indoor Mapping
38 - PropTech Global Trends 2021 Barometer The Global PropTech Industry
ESCP benefits from the best international accreditations.
Our European campuses enjoy national recognition.
5 European Higher Ed
accreditations
BERLIN PARIS RÉPUBLIQUE WARSAW
Heubnerweg 8 – 10 79, av. de la République c/o Kozminski University
14059 Berlin, Deutschland 75543 Paris Cedex 11, France International Relation Office
57/59 Jagiellońska St.
LONDON PARIS MONTPARNASSE 03-301 Warsaw, Poland
527 Finchley Road 3, rue Armand Moisant 75015 Paris,
London NW3 7BG, France
United Kingdom
TURIN
MADRID Corso Unione Sovietica, 218 bis
Arroyofresno 1 10134 Torino, Italia
28035 Madrid, España
WITH THE SUPPORT OF
About Extended Monaco
Extended Monaco is the program in charge of the digital transformation of Monaco Principality, funded
and implemented by the Prince’s Government through the DITN Team (Interdepartmental Delegation
in charge of digital transition). Very high value created from a very limited space is a common feature
shared by Monaco and digital technology. Thus, for our Principality, digital technology is an unprece-
dented opportunity to perpetuate and extend its societal model, to make it ever more attractive and to
further boost its international aura. Since 2019, Extended Monaco launched several initiatives whose aim
is to benefit both Monégasques and those who choose the Principality as their place of residence, for
their business or for tourism.
Learn more: www.extendedmonaco.com
©iStock.frYou can also read