Meeting of the WHO Action Network on Salt Reduction in the Population in the European Region (ESAN) - ESAN 2016
←
→
Page content transcription
If your browser does not render page correctly, please read the page content below
ESAN 2016

 Meeting of the WHO Action
Network on Salt Reduction in
    the Population in the
  European Region (ESAN)

           MEETING REPORT

          20-21 April 2016
          Lisbon, Portugal

       Edited by: Karen McColl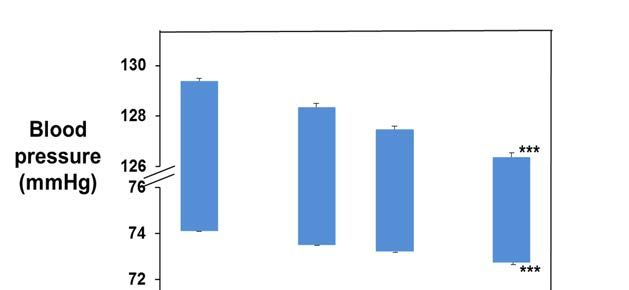
ABSTRACT

WHO has identified cutting salt intakes as a priority for preventing non-communicable diseases and,
globally, countries have already committed to cut salt intakes by 30% between 2010 and 2025. Although
countries have been taking policy action, however, it is clear that progress is uneven and insufficient—no
European country is currently on track to meet that global target.

The WHO Action Network on Salt Reduction in the Population in the European Region was established in
2007 as a response to the increasing salt consumption of the population. The network—which now consists
of 29 WHO European Region Member States—met in Lisbon, Portugal on 20-21 April 2016. The meeting
heard about the latest progress on salt reduction from selected countries and explored various methods of
measuring and monitoring salt levels in food and salt intakes. Participants learned about state of the art
science—including the latest evidence on salt and health outcomes—and the latest technological
developments to facilitate further reductions in the levels of salts in foods. The meeting also heard clear
evidence that salt reduction strategies can and do work. The growing evidence base on successful salt
reduction strategies provides a wealth of information for policymakers to learn from others’ experience and
to identify the most effective approaches to reduce salt intakes and improve population health.

                                            Keywords

                         SODIUM CHLORIDE, DIETARY – ADVERSE EFFECTS
                         SODIUM CHLORIDE, DIETARY – ADMINISTRATION AND DOSAGE
                         NUTRITION POLICY
                         HEALTH PROMOTION
                         EUROPE

        © World Health Organization 2016
        All rights reserved. This information material is intended for a limited audience only. It may not be
        reviewed, abstracted, quoted, reproduced, transmitted, distributed, translated or adapted, in part or in whole,
        in any form or by any means.
CONTENTS
Page
BACKGROUND AND INTRODUCTION ................................................................................... 1
Background and aim of the network ............................................................................ 1
Organisation of the network........................................................................................ 1
INTRODUCTORY SESSION .................................................................................................. 2
Opening addresses..................................................................................................... 2
SESSION 1: UPDATE ON SALT REDUCTION STRATEGIES WITHIN THE WHO EUROPEAN UNION2
NCDs in the WHO European Region — Focus on salt ..................................................... 2
The SHAKE Package for Salt Reduction ........................................................................ 3
Country updates ........................................................................................................ 6
Insight into developing salt strategies ........................................................................ 13
How to develop sustainable national salt reduction strategies ...................................... 14
SESSION 2: MEASURING AND MONITORING SALT INTAKE.................................................. 18
Examples of across-country databases for salt (and other public health relevant
nutrients) ................................................................................................................ 18
Methods to measure salt intake at individual level....................................................... 22
SESSION 3: RESEARCH PROJECTS / SCIENTIFIC UPDATES.................................................. 24
State-of-the-art salt and health outcomes .................................................................. 24
Update on link between salt, soft drinks and obesity ................................................... 26
Iodine in Portugal .................................................................................................... 28
How healthy are specialty salts really? ....................................................................... 29
Salt, saturated fat and sugars in selected foods from several European countries .......... 30
SESSION 4: REFORMULATION—TECHNOLOGICAL FEASIBILITY AND CONSUMER
ACCEPTABILITY ............................................................................................................... 34
Sodium reduction while maintaining sensory quality .................................................... 34
Evidence on consumer acceptability from the systematic literature review and meta-analysis
.............................................................................................................................. 35
CONCLUSIONS AND NEXT STEPS ...................................................................................... 38ESAN April 2016 Meeting Report
Page 1
BACKGROUND AND INTRODUCTION
Background and aim of the network
The WHO Action Network on Salt Reduction in the Population in the European Region (hereafter
referred to as ESAN or ‘the network’) was established in 2007 under the auspices of the WHO and
with the support of the United Kingdom Food Standards Agency (FSA). Since May 2013
Switzerland has chaired ESAN.
The network was established as a response to the increasing salt consumption of the population,
in line with WHO Europe’s designation of salt reduction as a priority intervention for the reduction
of noncommunicable diseases (NCDs) in the European population1. The network aims to:
a) promote the identification and sharing of national policies on salt reduction and the types
of action undertaken;
b) describe monitoring and evaluation strategies of salt reduction initiatives;
c) discuss the public health and cost benefits of salt reduction strategies in different
countries;
d) develop good practice in the area of policy development, implementation, monitoring
and evaluation;
e) promote the development of science and food technology in the relevant areas;
f) explore the links between salt reduction policies and inequalities.
Organisation of the network
Since May 2013, the Federal Food Safety and Veterinary Office of Switzerland has chaired the
network. As of April 2016, the network consists of 29 of the WHO European Region Member
States. Participants include governmental institutions (or those nominated by government) and
representatives of WHO and WHO collaborating centres. The network usually meets once a year,
at a meeting organized by the ESAN leading country, in close collaboration with the WHO
Regional Office for Europe. The network meeting is an important arena for sharing and discussing
experiences in salt reduction strategies.
The 2016 network meeting was held in Lisbon, Portugal on 20-21 April 2016. The Portuguese
Directorate-General of Health (DGS in its Portuguese acronym) hosted the meeting.
Representatives from 16 countries (Austria, Belgium, Bulgaria, Croatia, Finland, Greece, Ireland,
Italy, Latvia, Netherlands, Norway, Portugal, Republic of Uzbekistan, Slovenia, Sweden and
Switzerland), the WHO, the European Commission, the WHO collaborating centres RIVM and
University of Warwick, and invited external speakers attended the meeting.
1
WHO Regional Office for Europe (2012). Action Plan for the implementation of the European Strategy on the
Prevention and Control of Noncommunicable Diseases (2012-2016) [Brochure]. Access
http://www.euro.who.int/__data/assets/pdf_file/0019/170155/e96638.pdfESAN April 2016 Meeting Report
Page 2
INTRODUCTORY SESSION
Opening addresses
On behalf of the WHO Regional Office for Europe, João Breda warmly welcomed all participants
to the meeting. The record number of participants attending the meeting reflects the healthy state
of the network, the importance of the topic under discussion and the willingness of Member States
to share knowledge and experience. This network serves as an example for other areas of work,
where collaboration across the Region could help policymakers to make progress.
On behalf of the DGS, Andreia Silva welcomed participants to Lisbon, conveyed the high level of
interest in this work within the DGS and wished all participants a successful meeting.
Fernando Almeida from the Dr Ricardo Jorge National Institute for Health in Portugal added a
warm welcome to all participants. Given its experience on data collection on salt and iodine, the
Institute, a WHO Collaborating Centre, is very interested in the discussions.
Finally, Michael Beer, Federal Food Safety and Veterinary Office, Switzerland, added his words
of welcome and introduction, as chair of the network. He reminded participants of the real
challenges that remain for salt reduction and underlined the importance of the network as a forum
for exchange. In particular, the network provides an opportunity to hear about which measures
have worked and which have been less successful. He encouraged all participants to contribute to
the discussions.
SESSION 1: UPDATE ON SALT REDUCTION STRATEGIES WITHIN THE
WHO EUROPEAN UNION
The first session focused on bringing participants up to date on developments in salt reduction in
WHO—at both the global and European levels—and included some examples of national
developments, as well as insights from some experts in the field.
NCDs in the WHO European Region — Focus on salt
João Breda gave an overview of the situation in the European Region—in relation to NCD
prevention and, specifically, salt reduction—and highlighted some additional issues for possible
further discussion.
For all countries in the European Region dietary risks are either the leading, or second, cause of
death and disease. Portugal is a fitting setting for the meeting because high blood pressure was the
biggest risk factor for death and disability in the country in 2013, and high salt intakes are a major
contributor to high blood pressure.
Globally, countries have already committed to cut salt intakes by 30% between 2010 and 2025,
but much more action is needed to meet that target. On the basis of the latest data, no European
country is on track to meet the global targets for salt or obesity. Although countries have been
taking policy action, it is clear that progress is uneven and insufficient. All Member States, for
example, have at least partially implemented reformulation measures to reduce sugar and/or salt
levels. A different mix of tools and methods, however, may be needed for reformulation to
progress as it should, and to bring about real reductions in the burden of disease.ESAN April 2016 Meeting Report
Page 3
In line with its clear mandate—established through statements such as the Vienna Declaration on
Nutrition and Noncommunicable Diseases in the Context of Health 2020—the WHO Regional
Office for Europe has established a strong framework for action on nutrition. The European Food
and Nutrition Action Plan 2015 – 2020 and the Physical Activity Strategy for the WHO European
Region 2016-2025 establish priority areas and set out practical suggestions for action.
One of the five priority areas of the Food and Nutrition Action Plan is the healthy food and drink
environment, and this is an area where more progress is needed on salt. High quality information
on food composition and diets is an important element. The Regional Office is currently working
on a project in eight countries in Central Asia and the Caucasus to identify and analyse common
foods in markets and marketing practices and on another project on the availability of
commercially produced baby food products in the market place.
There are a number of important opportunities to facilitate action at this time. The EU is now
establishing a framework for salt reduction, following the Netherlands EU Presidency initiative
and the EU Roadmap for Action on Food Product Improvement. There are useful tools—such as
nutrient profiling models—which could help facilitate progress. There are also examples of good
practice, including in some of the Region’s less affluent countries that provide inspiration—
Uzbekistan, for example, has recently measured average salt intakes using the 24-hour urine
excretion methodology. Challenges do, of course, remain. It is now time to mainstream
reformulation and persistent inequalities in salt intakes are still a problem that needs to be tackled.
The SHAKE Package for Salt Reduction
Stephen Whiting, WHO Headquarters, gave an overview of the SHAKE package, a new tool to
help Member States implement comprehensive salt reduction strategies, with a view to helping
them meet the global salt target. This toolkit has been developed over the past two years by WHO
headquarters in collaboration with the George Institute and relevant global experts.
The package—informed by evidence of successful national strategies, policies and interventions—
comprises an advocacy flyer, a technical package that lists key policies and interventions, and a
toolkit to help implement such interventions.ESAN April 2016 Meeting Report
Page 4
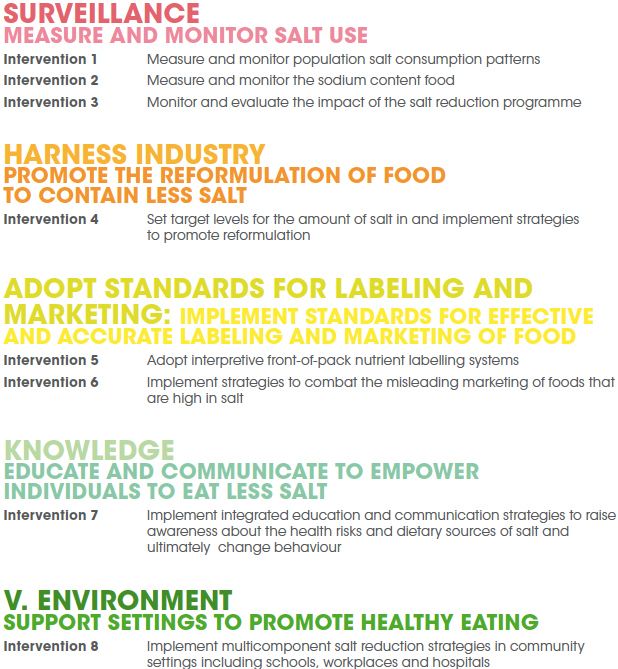
The SHAKE acronym sets out key elements and the associated policies and interventions (Figure
1).
Figure 1 The SHAKE technical package of policies and interventions for salt reduction
For the various intervention areas, the package sets out the specific objectives, outlines the
necessary steps and contains resources to help with the implementation.
Table 1 The SHAKE Package—Example resources to help implementation
POLICY AREA / INTERVENTION(S) TOOLS AND RESOURCES PROVIDED IN
THE PACKAGE TO HELP
IMPLEMENTATION
SURVEILLANCE • Population survey design
o Measure and monitor population salt consumption • 24 hr/spot urine collection protocol
patterns • Shop survey data collection
o Measure and monitor the sodium content of food • Program monitoring plan with indicators
o Monitor and evaluate the impact of the salt
reduction programme
HARNESS INDUSTRY • Tips for engaging food industry
Set target levels for the amount of salt in and implement • Guidance for setting targets
strategies to promote reformulation • Example targets from the UK, Argentina and
regional targets from the EU and the AmericasESAN April 2016 Meeting Report
Page 5
POLICY AREA / INTERVENTION(S) • TOOLS AND RESOURCES PROVIDED
IN THE PACKAGE TO HELP
IMPLEMENTATION
ADOPT STANDARDS FOR LABELLING AND • Recommended guiding principles for labelling
MARKETING schemes
o Adopt interpretative front-of-pack nutrient • Overview of different types of FOP labelling
labelling systems • Alternative labelling methods
o Implement strategies to combat the misleading • Case studies
marketing of foods that are high in salt
KNOWLEDGE • Guidance to develop consumer awareness
o Implement integrated education and campaign
communication strategies to raise awareness about • Sample leaflets and media releases
the health risks and dietary sources of salt and • Key messages for salt advocates
ultimately change behaviour. • Framework for evaluation of communication
campaigns
ENVIRONMENT • Guidance on integrating salt reduction initiatives
o Implement multicomponent salt reduction into community settings
strategies in community settings including schools, • Sample salt criterion for schools and workplaces
workplaces and hospitals. • A brief salt reduction counselling tool for primary
care settings
STRATEGY DEVELOPMENT • Guidance on integrating salt reduction initiatives
into community settings
• Sample salt criterion for schools and workplaces
• A brief salt reduction counselling tool for primary
care settings
The package2 is now ready for use and a soft launch is planned, alongside launch of the CVD
management package. The next steps will be to print and disseminate the package and discussions
are ongoing with development partners about potential funding to support countries in putting the
package into practice. The toolkit will be published online and will also be modified for use as a
training manual.
Discussion
There was clarification that the toolkit includes the messages from the outcome of the WHO
Technical Meeting on measuring salt intakes. The gold standard remains 24-hour urine collection
when feasible. The example of Uzbekistan is important, if 24-hour urine collection can be achieved
in this context it can clearly be done in other countries. WHO Europe continues to advise Member
States to use the 24-hour urine collection methodology if possible.
The reference to misleading marketing and claims mainly relates specifically to salt content. There
is, however, also a link to the WHO Set of recommendations on marketing of food and non-
alcoholic beverages to children.
2
WHO (2016) SHAKE the salt habit - Technical package for salt reduction [Brochure]. Access
http://www.who.int/dietphysicalactivity/reducingsalt/en/index1.htmlESAN April 2016 Meeting Report
Page 6
Country updates
Some of the network member countries gave an update on their recent activities.
Portugal
Pedro Graça, DGS, Portugal, gave an update on salt reduction strategies in the country.
In response to the very high burden of disease, particularly cerebrovascular disease, associated
with salt in Portugal, five strategic objectives for salt reduction have been established:
SO1 - Implement a system for assessing population-wide salt intake while monitoring the
supply of salt in the main food groups supplying salt to the Portuguese;
SO2 - Promote awareness and empower consumers towards a reduced salt intake;
SO3 - Promote the best way to provide labelling that is able to highlight the salt content of
foods and identify low-salt products;
SO4 - Modify availability, particularly through the participation of the industry and the food
chain in reformulating and supplying food products with lower salt content;
SO5 ‐ Monitor and assess the industry's involvement in the reformulation and supply of food
products and also of the consumers' awareness, attitudes and behaviour.
The first three have previously been reported on to ESAN, but there has been progress on the
fourth and fifth objectives since the last meeting.
A strategy for reducing the salt intake in the Portuguese population by modifying the availability
of the offer was adopted in 20153. In late 2015, the associations of food producers and restaurants
were invited to discussions on an agreement to reduce the salt levels, firstly in soup and then in
some other products. Agreement was reached in 2016 and several institutions are involved in
monitoring salt levels in products until the end of the year.
Agreement was also reached with some of the major food players in the country to do their own
evaluation of salt levels and to share results with the DGS. One such player—Portugal Foods, a
cluster of 125 companies—has created a platform for the analysis and mapping of food
composition data. This Food and Nutrition Observatory enables a better understanding of the
composition of food on offer to consumers, with a particular focus on Portugal Foods’ members.
In this way it is hoped that DGS will be able to monitor changes in salt levels (and will be able to
share the data with ESAN next year), as well as other ingredients/nutrients, and identify areas
where further support is needed.
Carla Gonçalves, University of Porto, described some work on innovative approaches to
monitoring salt content. Traditional methods for measuring salt levels are time consuming, not
portable and they require several steps for sample preparation. A consortium of researchers has
developed user-friendly portable equipment to provide fast and reliable results on the salt content
of foods. The characteristics and method of use for the equipment were described. It is designed
to be used in kitchens and results are available within six minutes.
3
Law no 8272/2015 of 29 July.ESAN April 2016 Meeting Report
Page 7
The next steps in the development process will be to make some improvements and then to produce
20 units of the industrial prototypes for testing in other settings, such as schools and hospitals.
Future steps will include identifying a business partner to produce the equipment on a commercial
basis.
Discussion
There was tremendous interest in the new equipment from ESAN members and there was
clarification that the equipment is still a prototype, so not yet available for Member States’ use. In
the longer term, the idea is to make something so portable and easy to use that consumers can use
it in restaurants. To measure levels in solid food it is necessary to first process the food using a
blender, in future versions a blender may be incorporated. In response to questions, there was
clarification that the funding was mainly provided by the DGS and the University’s own resources.
It was also clarified that, unlike some other methods, the equipment measures sodium from all
sources, not just salt.
It was pointed out that Portugal had been the first country in the world to regulate salt targets,
when it introduced targets for bread. This provided a very good example for other countries, and,
of course, this approach could be extended to other products at some point in the future.
There was some discussion of the compatibility of traffic lights labelling with the EU Food
Information Regulation, in light of the EU investigation into the UK’s traffic light scheme. WHO
had organized a meeting in Lisbon in December 2015 to discuss this issue and hopes to publish
the outcome in coming months. The discussions pointed to the clear evidence for an impact of
front-of-pack interpretative labelling on consumers’ awareness and preferences, and the case for
considering these as proxies for a health outcome.
Ireland
Karl McDonald, Food Safety Authority of Ireland, presented a new review by the Authority’s
Scientific Committee to update its report Salt and Health: Review of the scientific evidence and
recommendations for public policy, published in 2005.
Two issues related to salt reduction, and which have recently arisen in the research/scientific
literature, were addressed:
• Use of potassium-based salt replacement ingredients;
• Influence of low salt diets on the occurrence of cardiovascular disease.
Potassium-based salt replacements
In 2005, the Committee advised against the use of potassium-based salt replacement ingredients,
because the preferred approach has been to encourage an overall reduction in salt and saltiness.
The industry has asked for further guidance on this issue, particularly with respect to some foods
where salt is more challenging to reduce, e.g., processed meats.ESAN April 2016 Meeting Report
Page 8
The 2015 review concluded that:
1. Potassium-based salt replacement ingredients should only be used by the food industry
where reduction of sodium could be detrimental to food safety and/or the physical or
organoleptic properties of foods.
2. Potassium-based salt replacement ingredients should not be used for the sole purpose of
flavour maintenance i.e. saltiness or flavour enhancement. There continues to be a
requirement for the food industry to work on reducing the salt taste thresholds of the Irish
population.
3. The use of potassium-based salt replacement ingredients by the food industry could also
help supplement intakes of potassium by the Irish population which are lower than WHO
recommendations.
4. However, there is also scope for increased intake of potassium in the Irish diet through
consumption of unprocessed or unrefined fruits, vegetables and nuts.
The Food Safety Authority Ireland will, therefore, issue guidelines to the food industry on the use
of potassium and other mineral-based salt replacement ingredients, taking into account the
following:
• Possible effects of these ingredients to vulnerable groups (e.g., renal patients with an
aversion to high potassium diets)
• The types of replacement ingredients required by the food industry
• The types of foods in which they could be used and at what levels
• The likely reductions in salt levels in these foods
• The impact on actual sodium reduction in foods
• The impact on potassium intakes in the population.
These guidelines to the industry will be made available to all vulnerable groups through, for
example, health professionals and health department advice. In addition the Authority will
continue to monitor the sodium and potassium content of food and may periodically re-evaluate
intakes. Data suggest an increase of around 25% on potassium levels in bread between 2013 and
2015, and the reasons for this increase are not yet clear.
Low sodium intakes and health
In recent years there has been considerable attention in the scientific literature on the interpretation
of cohort analyses used to study the relationship between sodium intake and CVD. The literature
has included systematic literature reviews, meta-analyses and analyses of individual studies and
has questioned the public health benefits of interventions to decrease sodium intake in the diet. In
some cases it has pointed towards the increased benefits of focusing instead on weight loss and
excessive alcohol consumption as a means of reducing hypertension in the population. The
attention on this literature has been undermining the salt message.
Having reviewed the new literature over a one-year period, the Scientific Committee issued a
strong conclusion. Namely, that the available evidence indicates that salt intakes in the Irish
population are still too high and need to be reduced in order to reduce blood pressure and the risk
of cardiovascular disease. It also issued a robust recommendation that guidance on intakes of
sodium should be based on the evidence which links high sodium intake to blood pressure and
cardiovascular disease and the current public health policy in Ireland to reduce sodium intake in
the Irish population should continue. Ireland is continuing, therefore, to move forward onESAN April 2016 Meeting Report
Page 9
reformulation work in relation to salt, sugar and fat. The Scientific Committee’s review has been
added as a new appendix to the revised report4.
Discussion
Professor Francesco Cappuccio is publishing a report on the impact of potassium, and issues
around potassium supplementation safety, in the near future. This is a worthwhile area to explore
further. One important issue is to improve the sodium to potassium ratio, which is the predictor of
mortality. In relation to potassium supplements, it is important to emphasise the need for
vulnerable patients, principally renal patients, to consult their doctors before taking any
supplements.
Greece
George Marakis, Hellenic Food Authority, gave an update on salt reduction actions from Greece.
There are four pillars to the Salt reduction strategy 2016-2020, which was endorsed by the
Management Board of the Hellenic Food Authority in March 2016:
• Data collection (salt intake and major dietary sources, knowledge and attitude of adults and
teenagers)
• Raising awareness: public (adults & teenagers) and health professionals
• Reducing salt content of foods and meals
• Monitoring and evaluation.
As reported to the ESAN meeting in 2015, bread was taken as the starting point for the salt
reduction strategy, with a focus on craft bread (for which estimated contributions range from 0.23g
to 3.95 g of salt daily). A protocol of commitment between the Hellenic Food Authority and the
Hellenic Federation of Bakers, signed in March 2016, sets out agreed voluntary limits for salt in
all types of bread, with a view to involving all bakeries by the end of 2017. Participating bakeries
that reduce salt in all types of bread are allowed to display the ‘Less Salt – Better Health’ logo in
their shops.
The particular challenges associated with reducing salt in bread include the difficulty of reaching
more than 7,000 small-size bakeries and of persuading all of them to modify long-standing recipes.
It is also difficult to monitor salt levels amidst this proliferation of products. Finally, bread from
neighbouring countries—with potentially different salt concentrations—also enters the market.
In relation to the catering sector the Hellenic Chefs Club has agreed that all its members will reduce
salt in meals by 30%. A leaflet on replacing salt in food with herbs has been well received by
professionals and the public. Participation in the Gastronomy Forum and television cooking
programmes has been another opportunity for presenting facts about salt and cooking without salt.
Further work to raise awareness, and to combat negative messages and address confusion about
speciality salts, is needed.
Future work in the pipeline includes an agreement on joint work with the Hellenic Dietetic
Association and, once major sources of salt in the diet have been identified, the setting of
benchmarks and agreements with other sectors.
4
Food Safety Authority of Ireland (FSAI) (2016). Salt and health: review of the scientific evidence and
recommendations for public policy in Ireland (Revision 1). Access http://www.lenus.ie/hse/handle/10147/609526ESAN April 2016 Meeting Report
Page 10
Discussion
Recently, some research has been conducted on salt intakes in the north of Greece and this will be
published in the near future.
There was discussion of the negative messages conveyed by television cooking programmes,
where chefs are very liberal with salt. Research continually shows, however, the high proportion
of dietary salt contributed by meals eaten outside the home—emphasising the importance of
continuing to work with chefs.
Slovenia
Mojca Gabrijelčič Blenkuš, National Institute of Public Health, gave a brief update on salt
reduction in Slovenia, where salt reduction has now been incorporated into broader reformulation
work.
The national Action plan and the National strategy on nutrition and physical activity were adopted
in July 2015, and reformulation is an important part of the strategy. Following on from the issues
highlighted under the Dutch presidency, there is a focus on reformulation to reduce sugar levels.
The work is being taken forward by a Reformulation Working Group on sugars, trans fats and salt
and through the mobilisation of different stakeholders.
National food producers adopted the first pledge on salt reduction for Slovenia, and a new pledge
covering other nutrients is under negotiation. However, the pledge does not contain any concrete
goals and the industry focus appears to be on new product development rather than reformulation.
It remains a challenge for public health to channel and guide industry efforts in the right direction.
Awareness-raising activities are also ongoing, along with education of nurses on salt. The latter is
particularly important given the major health reforms underway, that will place higher emphasis
on health promotion and prevention.
Italy
Pasquale Strazzullo5, Coordinator, Interdisciplinary Working Group for Reduction of Salt Intake
in Italy, presented an update on Italian initiatives on salt reduction.
Reduction of salt intake is included as a main objective of the government's intersectoral NCD
prevention strategy Gaining health: Making healthy choices easier.
In order to estimate population salt intakes, the MINISAL programme estimated average 24-hour
sodium and potassium excretion in 20 Italian regions. Men excreted on average 183 mmol of
sodium per day, equivalent to 10.6 g of salt, while for women the figures were 142 mmol (8.2 g of
salt). There is a clear socioeconomic gradient in habitual sodium intake in Italy. When
socioeconomic status, occupation and educational level are taken into account, the apparent
geographical differences across the country disappear6. Salt intakes in hypertensive patients are
only slightly lower than for the general population, and intakes are already very high in children
5
Professor Strazzullo acknowledged the contribution of Dr Daniele Galeone to the presentation
6
Cappuccio FP, Ji C, Donfrancesco C, Palmieri L, Ippolito R, Vanuzzo D,… Strazzullo P. Geographic and
socioeconomic variation of sodium and potassium intake in Italy: results from the MINISAL-GIRCSI programme.
BMJ Open, 2015;5:e007467. doi:10.1136/bmjopen-2014-007467ESAN April 2016 Meeting Report
Page 11
and adolescents. Only 5% of adult men and 15% of women meet the WHO recommendation, while
the figures for children/adolescents are 12% for males and 13% for females.
In order to reduce salt in (processed) foods a number of agreements have been reached with
industry sectors. A voluntary agreement with the main National Association of Bakers pledged a
reduction to 15% in four years from 2009. One challenge is that 90% of bread in Italy is craft
production by about 30,000 small bakeries. There is a very important role of the Italian regions,
therefore, to involve craft bakers and inform citizens.
A number of other agreements have been reached:
• 2011: agreement to provide a 15% salt reduction in ‘gnocchi’ products (with Association of
Pasta Manufacturers)
• 2012: agreement to provide at least a 10% salt reduction in pasta and rice of frozen ready meals
(with Association of Food Product Industries)
• 2014: Agreement to provide, at least 10% of salt reduction in soups and vegetable/legumes
puree (with Association of Food Product Industries)
A review of the results in 2015, found that all the partners had reached the goal in the products
involved and some partners, had pushed the reduction up to 20%.
Analysis of over 3,000 products, by the Meno sale piu’ salute (the Lower Salt Community
Project), revealed extreme variability in the salt content of the different products in each given
category. It is hoped that this information will be useful for defining future Italian targets.
Awareness-raising campaigns continue to be developed in order to raise awareness of the
importance of reducing salt intake, enable people to choose low-salt food and encourage
consumers to check salt information on food labels.
The Lower Salt Community project in Campania set out to evaluate the feasibility of a strategy
of moderate, gradual dietary salt reduction at the population level. The project achieved a sizeable
reduction in the salt content in bread, and this was still found in follow-up after the project had
finished. At follow-up, 15% of the population were meeting the WHO recommendation for daily
salt intake, compared to 12% at baseline.
Future plans include a repeat survey of salt intakes (five years after MINISAL), monitoring of salt
levels in foods and calling for self-reporting by companies, fixing salt targets for specific food
categories, continuing campaigns and the setting up and testing new instruments for assessing
habitual salt intake.ESAN April 2016 Meeting Report
Page 12
Norway
Amandine Lamglait, Norwegian Directorate of Health, presented the Salt Partnership that had been
launched in Norway in October 2015.
Mean total salt intake in Norway is estimated to be about 10 g per day. The Action plan on salt
reduction 2014-2018 established a number of goals:
• 15% reduction in salt intake by end 2018 – equivalent to 1.5 g salt per person/day.
• 30% reduction by end 2025 – equivalent to 3 g salt per person/day.
• The long-term goal is a 50% reduction in salt intake to 5 g per person/day.
The focus areas for action were communication, labelling, monitoring and a partnership to reduce
salt in processed and served foods. The Minister of Health convened a food industry group in 2014,
comprising top-level management from food and catering companies. The resulting Partnership
involves food manufacturers and retailers, catering industry, research institutes, trade associations,
consumer councils, NGOs and the authorities. The Norwegian Directorate of Health leads the
Partnership’s board, which is responsible for the cooperation agreement and the common
monitoring system.
All actors in the Partnership are equal partners committed to working together towards the goal of
a reduction in salt in processed and served foods in order to achieve the 15% reduction in salt
intake by 2018. The partners have different obligations under the agreement:
– Food and catering industries: reduce the salt content in processed food products and served
foods;
– Trade associations: encourage participation and contribute to coordination of the work;
– NGOs and Consumer council: contribute to dissemination of information;
– Authorities: increase knowledge on salt and health, empower consumers on how to reduce
salt intakes and increase demand for products with less salt.
Voluntary salt reduction targets have been developed for nearly 100 different food categories,
following a study of various existing models and collection of data on the Norwegian market. For
the catering sector, nutritional procurement criteria are being developed, along with piloting of a
‘salt school’ on kitchen practice and menu planning. Consumer information is another element for
this sector.
At launch, 53 partners signed the intention agreement under the Salt Partnership and, by April
2016, 60 partners were signed up. Actions planned for 2016 involve monitoring salt levels in
processed foods, sodium analysis for intake estimates, organizing a conference with workshops
for exchange, definition of the nutritional procurement criteria for catering and implementation of
the ‘salt school’ in the autumn. These activities will be complemented by communication and
awareness-raising activities to spread the message ‘Mindre salt. Bedre helse’ which means ’Less
salt. Better health.’
Discussion
The Partnership was lauded for being a comprehensive initiative, with the engagement of industry
leaders at the highest level. The leadership from the Minister of Health, with coordination by the
Directorate of Health, is also to be commended. The third impressive element is the very
professional, high quality information and communication materials.ESAN April 2016 Meeting Report
Page 13
There was also discussion, however, of how successful such a partnership can be if it is based on
voluntary agreement. Experience has shown that regulatory approaches to setting salt targets are
effective.
A number of issues relating to costs were discussed. In terms of human resources dedicated to the
strategy, there was clarification that two people in the Ministry are working on the plan. The
Partnership specifies that industry bear the cost of monitoring and reporting data. While the
industry owns the databank, it is obliged to report results to the Directorate of Health. It is
important to be able to convey the economic costs to society of salt consumption when advocating
for action on salt reduction with politicians and policymakers. It is estimated that every dollar
spent on salt reduction brings a return of $6-8. Better information on the economic costs to society
of high salt intakes would be helpful for making the case for action and that industry should bear
some of the costs. This is an interesting issue to put on the agenda for the next ESAN meeting.
Insight into developing salt strategies
Jacqui Webster, the George Institute for Global Health, Australia, provided an overview of what
is known about salt reduction strategies and provided some pointers on how to implement them.
As countries work towards the global target for a 30% reduction in population salt intakes by 2025,
the role of the WHO Collaborating Centre on Salt Reduction in the Food Policy Division at the
George Institute, is to support countries by providing evidence for salt reduction, helping with
implementation and evaluation, producing tools and measures and facilitating information sharing.
An overview of the evidence for the case to cut salt intake is covered elsewhere, but it is worth
noting that there are resources that provide a comprehensive overview of the research base on a
continuous basis. The Science of Salt Weekly7, a weekly synthesis of publications on dietary
sodium, for example, publishes around 1-10 studies per week, and 95% of these studies support
the need to reduce salt. For the handful of studies that dispute the salt reduction hypothesis, there
are useful overviews explaining the flawed study designs8.
Global and European strategies from WHO set out the actions that countries can take to reduce
salt, and there is now a wealth of knowledge about what works. A systematic review of progress
towards the global target found that 75 countries have a national salt reduction strategy, comprising
different elements (Figure 2)9. There are now strategies in all regions of the world. Although
governments still prefer voluntary initiatives to regulation, there are signs that increasingly
countries are prepared to consider a regulatory approach. Five European countries have now set
legal standards for salt contents, for example, and Finland requires warning labels on high salt
foods.
7
Hypertension talk. (2016). Science of salt weekly. Access http://www.hypertensiontalk.com/science-of-salt-weekly/
8
Cogswell M E, Mugavero K, Bowman A B, Frieden T R. Dietary Sodium and Cardiovascular Disease Risk —
Measurement Matters. N Engl J Med, 2016;375:580-586
9
Trieu K, Neal B, Hawkes C, Dunford E, Campbell N, Rodriguez-Fernandez R, et al. Salt Reduction Initiatives
around the World - A Systematic Review of Progress towards the Global Target. PLoS One, 2015;10(7):e0130247ESAN April 2016 Meeting Report
Page 14
Figure 2 Types of salt reduction initiatives in national strategies
71
70
61
60
50
Number of countries with initiatives
40 36
30 27 Voluntary
23
19
20 Mandatory
9 8
10 3
0
Consumer Industry Establish Front of Nutrition Taxation
education engagement salt targets pack guidelines
to in foods labelling for food
reformulate procured in
foods public
institutions
There is growing evidence that salt reduction can work—12 countries now report that they have
managed to cut average salt intakes (based on countries’ own reports) over differing periods of
time. The greatest reduction reported is the 36% drop in population salt intake experience in
Finland between 1979 and 2007. A Cochrane review on the same issue is underway and will be
published soon10.
It is clear, however, that more robust evaluation of initiatives is required. A number of projects are
underway to try and obtain more evidence. Evaluation should comprise various components,
including impact (salt intakes, salt levels in foods, consumer behaviour), process and outcomes
(how well it was implemented, what was the reach, what has happened as a result), and cost-
effectiveness.
There is no need for policymakers to reinvent the wheel. Existing targets, such as those defined by
a long, comprehensive process in the UK11, could be adapted and adopted by other countries.
Finally, it is important to emphasise the importance of continued advocacy on the need for salt
reduction and how it can be achieved.
How to develop sustainable national salt reduction strategies
Professor Graham MacGregor, World Action on Salt and Health, UK, drew on the experience in
the UK to give some pointers for developing national salt reduction strategies.
Current salt intakes are in the range of 9 g to 15 g per day, with serious implications for the
population’s blood pressure, the rise in blood pressure with age, prevalence of hypertension and
other health effects. The challenge is to reduce intakes to the recommended 5 g per day. How can
this be achieved?
10
McLaren L, Sumar N, Barberio AM, Trieu K, Lorenzetti DL, Tarasuk V, Webster J, Campbell NRC. Population-
level interventions in government jurisdictions for dietary sodium reduction. Cochrane Database of Systematic
Reviews 2016, Issue 9. Art. No.: CD010166. DOI: 10.1002/14651858.CD010166.pub2
11
Charlton K, Webster J, Kowal P. To legislate or not to legislate? A comparison of the UK and South African
approaches to the development and implementation of salt reduction programs. Nutrients, 2014;6(9):3672-3695.ESAN April 2016 Meeting Report
Page 15
An important first step is to know where the salt in the diet comes from. This will vary from
country to country. Where salt is predominantly added by consumers (as table/cooking salt, stock
cubes, flavourings and sauces) public awareness campaigns are needed. The message needs to
emphasise that salt is chronic poison that puts up blood pressure, the major cause of strokes/heart
disease. People should be encouraged to reduce added salt and salted foods. Other elements could
include signpost labelling and warning labels on salt and high-salt food, similar to those for
tobacco.
Where salt is predominantly coming from processed food and/or eating out, a gradual reduction in
added salt—incremental reformulation—in processed food is the most effective response. Other
approaches such as labelling, public education, production of specific lower salt foods and
advising people to avoid processed foods and/or eating out have been found to be either ineffective
or impractical.
Given that in developed countries between 60 and 80% of salt is consumed passively, the
responsibility for action to reduce salt levels clearly lies with the food industry. A 53% reduction
in salt intake from processed foods and eating out is required to be able to meet the 5 g daily target.
This means that the food industry and government need to slowly reduce salt content of all foods
by over 50% by setting incremental targets.
In the UK, where 75% salt comes from processed foods, progressive salt reduction targets led to a
gradual reduction of 10-20% a year, and there has been no rejection of the products by the public.
The first set of salt targets was published in March 2006, covering 85 categories of processed foods
that contribute most salt to the diet. Unfortunately, the out-of-home and catering sector was left
out. Reductions in salt levels were monitored by the food industry and independently checked by
the Food Standards Agency, as well as surveys by Consensus Action on Salt and Health (CASH).
Targets were re-set every two or three years. These targets could easily be adapted to other contexts
and have already been adopted by some countries.
The reduction in salt levels was reflected in a drop in salt intakes (measured using 24-hour urinary
excretion) and in a fall in mean population blood pressure (Figure 3). This is estimated to have
resulted in 18,000 fewer strokes or heart attacks (of which, 9,000 would have been fatal) per year.
The UK’s National Institute for Health and Clinical Excellence (NICE) estimated that the cost of
the salt reduction strategy was around 6.5 million euros (and this included a costly public
campaign), while the healthcare savings were estimated to be 1.95 billion euros12.
12
NICE. (2010). Cardiovascular disease prevention [Brochure]. Access http://guidance.nice.org.uk/PH25ESAN April 2016 Meeting Report
Page 16
Figure 3 Salt intake and blood pressure in England, 2003 to 2011
* PESAN April 2016 Meeting Report
Page 17
with the support of independent expertise in food technology and persistent advocacy from NGOs.
Reducing salt in this way is very cost-effective in preventing cardiovascular disease and Europe
needs a comprehensive and effective strategy to reduce salt.
Discussion
There was some discussion about whether the particular success of the early was due to the fact
that the first set of reductions were easiest to achieve. Any reduction of salt is easy, however, if it
is done slowly. The major UK retailers have already achieved the 2017 targets.
World Action on Salt and Health (WASH) is conducting an international survey to examine
products that are sold in many different countries. It is important to ensure that the best products
(with lowest salt levels) are distributed internationally.
There was a suggestion that this could, and should, be an area for ‘class action’.ESAN April 2016 Meeting Report
Page 18
SESSION 2: MEASURING AND MONITORING SALT INTAKE
The second session explored different databases containing data on salt levels and methodology
for measuring intakes.
Examples of across-country databases for salt (and other public health
relevant nutrients)
GS1 EU1169 Databases
Cassi Belazouz, GS1 France, presented the GS1 EU1169 databases. GS1 is a non-profit platform
for its 112 member organisations in over 150 countries to agree on supply chain standards and
systems, the most well-known of which is the bar code system.
In Europe, GS1 is working to harmonise and improve the quality of product data across countries
and compliance with the EU Food Information Regulation (EU1169/2011)13. This requires certain
product information to be displayed on labels and by the end of 2016 will require information to
be online. GS1 operates data sharing networks, such as the Global Data Synchronization Network
(GSDN), which allow trading partners to automatically share product data, including information
for regulatory compliance, nutritional information, product images and logistical information
(pack dimensions, etc.).
Data quality is a crucial issue—the quality of data varies hugely between countries. GS1 member
organisations in countries are trying to improve the quality of data (this does not extend to testing
the product). This would apply, for example, to salt levels. There are known to be discrepancies
between data cited online and label data. Local databases exist in some countries and policymakers
in Member States should contact the local GS1 information to get information about the data
collected14.
Discussion
There was some discussion of the noted discrepancies in online product information, but the
prevalence of such inaccuracies is not clear. In the future, national food enforcement authorities
are likely to do more work to check the accuracy of label and online information.
There was clarification that the website is not generally accessible to consumers—it is intended to
be only for business-to-business information—but in some countries, such as Switzerland, it
appears that consumers can access the database directly.
Sweden was highlighted as one country demonstrating good practice—quality-controlled data is
collated on a central database. Local GS1 databases exist in Switzerland, Belgium, Italy, Sweden
and the UK.
GS1 could help to improve monitoring of, for example, salt levels by ensuring that the information
available comes from the brand owner. Then, national authorities could connect to the database
and collect information by product category. At this stage, an overall European database appears
unrealistic.
13
EUR-Lex. (2011). EUR-Lex - 32011R1169 - EN. Access http://data.europa.eu/eli/reg/2011/1169/oj
14
A list of local contacts was provided. See Cassi Belazouz’s powerpoint presentation on ESAN extranet.ESAN April 2016 Meeting Report
Page 19
International Food Monitoring Database
Jacqui Webster delivered a presentation about the International Food Monitoring Database on
behalf of Michelle Crino, Elizabeth Dunford and Bruce Neal at the George Institute.
As dietary intervention strategies focusing on individual behaviour change have proved to be
unsuccessful, un-scalable or both, interest has turned to changing the global food environment.
There is, however, limited data available to describe and influence the food supply.
The George Institute’s FoodSwitch initiative—which now has a broad vision to improve the health
of billions, by cataloguing the world’s food supply, and making the data available to all–started as
a small project to monitor salt in the Australian food supply.
FoodSwitch is a smart phone application that shows users immediate easy-to-understand nutrition
information about packaged foods. It also suggests healthier alternative products based on an
adapted version of the Australia New Zealand Food Standards Agency Nutrient Profiling System.
The app facilitates crowdsourcing of product information by including a feature for consumers to
give feedback if a product is not in the database and to enable them to submit the missing
information (by sending photos of the label). Within a few weeks of launch, thousands of photos
were received and this consumer feed-back loop now ensures that FoodSwitch covers more than
90% of all packaged-food products sold in Australia and that the data is up-to-date. The app has
proved tremendously popular—it has been downloaded more than 700,000 times and around
20,000 users regularly update the app, suggesting regular use. In 2015, 19 countries (of which two-
thirds and low- or middle-income countries) were involved in collecting data on more than 230,000
individual branded food items.
FoodSwitch drives impact in various ways: by empowering consumers to make better food
choices; by providing data to help advocate for government and industry action; by highlighting
issues to the media and promoting accountability; and by enabling global scientific collaboration
and research outputs. Data collected via FoodSwitch has demonstrated that levels of salt in
Australian processed foods are higher than for comparable products in the UK15 and has
established the baseline for monitoring product changes. This type of data is essential for
establishing a baseline for advocacy and for monitoring progress in salt reduction strategies.
Future plans for the initiative are to expand the number of participating markets, optimise potential
use for advocacy and link with other research organisations. The plan is also to create a self-
sustaining platform by making the data available on a commercial basis to companies while
ensuring free access to the data for research and advocacy16.
Discussion
The simple act of measuring the content of producers’ food and including that information in a
database might encourage producers to change their products. Manufacturers have been very keen
to get access to their data.
Countries wishing to join the international project are encouraged to have an initial discussion with
colleagues at the George Institute. The Institute holds the intellectual property on the application
15
Ni Mhurchu C, Capelin C, Dunford EK, Webster JL, Neal BC, Jebb SA. Sodium content of processed foods in the
United Kingdom: analysis of 44,000 foods purchased by 21,000 households. Am J Clin Nutr,2010:93(3);594-600.
16
Further information on FoodSwitch is available from Michelle Crino at the George Institute
(mcrino@georgeinstitute.org.au).ESAN April 2016 Meeting Report
Page 20
and data, but grants licences to partners to allow them to use the data. The costs involved depend
on the context.
There was some discussion of the relative values of the database for countries with food
composition data and those without such data. For those with food composition databases, which
tend to use composite data, the FoodSwitch database enables differentiation between products. In
this way, products can be compared and the range of nutrient levels in foods is revealed, which
can be very important for advocacy. For those countries that do not already have food composition
databases the whole process can be tremendously valuable and informative for the collection of
information across the food supply.
Brandbank global product exchange
Kevin Knight, Brandbank, outlined the work of Brandbank (recently acquired by Nielsen) to
create, manage and distribute digital content on products—that is, the images and data that people
see when looking at products online.
The content is created in various ways, but for the majority of products (70%) the data is input
manually on the basis of a sample of the physical product shipped to the Brandbank warehouse.
Once the content has been created and approved by the supplier it is entered into the Brandbank
product library and this is distributed to retailers and other data users. As well as online retailing,
the content can be used for space management, logistics, printing, etc.
Online shopping is evidently growing in importance and will continue to do so, along with more
digital ‘touch points’ even when shopping in stores (such as retail apps, in-store scanning, in-store
computers). This makes it ever more challenging for brands to have consistent data and images
across all retailers and all channels.
More than 7,000 brands are included in the database and content is distributed to over 200 retailers.
Other organisations that use the data include Weight Watchers, Public Health England (for the
Eatwell guide). All packaging had to be re-entered after the Food Information to Consumers
Regulation (FIC EU1169) came into force.
Quality assurance processes are in place. There are many dimensions to data quality—it is not only
a question of accuracy. Other dimensions include relevance, consistency, format, timelines and
completeness.
A crude analysis, for this meeting, of data on archived products found average salt intake per 100
g in all products declining between 2011 and 2016. A similar downward trend can be seen in cakes,
while the levels in bread are relatively stable and those in speciality/ethnic food products have
risen steeply. A similar crude analysis of sugars found that sugars levels generally remained stable
between 2010 and 2015 for all categories combined, but showed a slight decline in cakes and an
increase in carbonated drinks.
Discussion
Once again the data under discussion is all derived from the label, not from actual product testing.
According to UK trading standards, producers used to have a 20% margin for accuracy on, for
example, salt levels. The EU has spent a long time discussing these issues on label accuracy and
new guidance is tighter on the question of tolerances.You can also read