Merge or Close Obamacare and Local Healthcare - Turnaround ...
←
→
Page content transcription
If your browser does not render page correctly, please read the page content below

Merge or Close
Obamacare and Local
Healthcare
Panel
• William K Snyder, CTP, – Moderator – Deloitte Transaction
  and Analytics

• Jeffrey D. Benton, CTP, FTI consulting
• Eric D Prezant, Bryan Cave LLP
• Andrew Turnbull, Houlihan Lokey, Inc.
• Matt Brown, McKesson Specialty Health
State of the Industry
Hospital M&A Volume Declines In 2014,
Yet Poised To Pick Up
                               Announced Hospital Mergers And Acquisitions
                         120                                                                                                     $40

                                                                                                                                       Combined deal value, $B
                                                                                                                                 $35
                         100
                                                                                                                                 $30

       Number of deals
                          80                                                                                                     $25
                          60                                                                                                     $20
                                                                                                                                 $15
                          40
                                                                                                                                 $10
                          20                                                                                                     $5
                           0                                                                                                     $0
                               2004 2005 2006 2007 2008 2009 2010 2011 2012 2013 1H
                                          (1)                                    2014

                                  Number of deals (includes deals with no announced price)
                                  Combined deal value, $B (excludes deals with no announced price)

    Source: Irving Levin Associates, Inc.
    (1) Dollar volume in 2006 was affected by the privatization of HCA, Inc., the largest hospital transaction ever announced.
Health Care System Operating Margins –
The Weak Get Weaker
Not-For-Profit Health Care System Medians By
Rating Level - 2013
$3.0 10.0%
Operating margin, %
Net patient revenue, $B
$2.5 8.0%
$2.0 6.0%
4.0%
$1.5
2.0%
$1.0 0.0%
$0.5 (2.0%)
$0.0 (4.0%)
Net patient revenue, $B Operating margin, %
Source: Standard & Poor's Rating Services
Note: AA+, BBB/BBB- and Speculative Grade ratings all represented small sample sizes (5 or under)Operating Margin Deterioration Also
Expected for Standalones
Standalone Hospital Medians By Rating Level -
2013
$1.2 7.0%
6.0%
Operating margin, %
Net patient revenue, $B
$1.0 5.0%
$0.8 4.0%
3.0%
$0.6 2.0%
1.0%
$0.4 0.0%
(1.0%)
$0.2 (2.0%)
(3.0%)
$0.0 (4.0%)
Net patient revenue, $B Operating margin, %
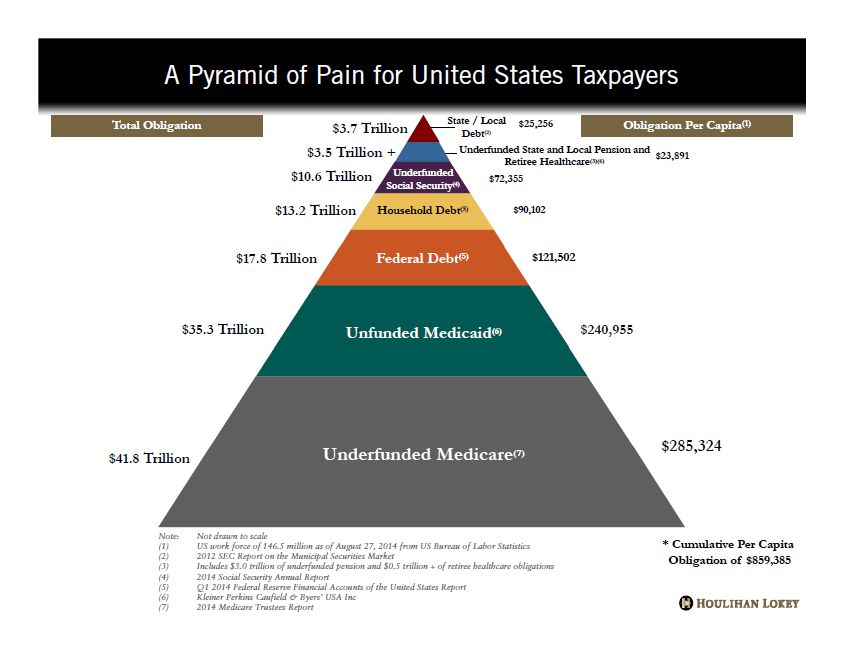
Source: Standard & Poor's Rating ServicesPyramid of Pain
Demographic Changes
The U.S. population is aging as the oldest Baby                                                          . . Yet, the “cost bubble” is till to come as utilization does
Boomers1 are now turning 65. . .                                                                                           not spike until age 75 . . .

             Population Shift (2000 – 2020)                                                                       Hospital Discharges & Days of Care by Age (2010)
                                                                                                               3,500

                                                                                                                                                                                                                                       3,018
                                                                                                               3,000

                                                                                                               2,500
                                                                                                                                                                                                                              2,213

                                                                                                  Population
                                                                                                               2,000

                                                                                                               1,500                                                                                                 1,313

                                                                                                               1,000
                                                                                                                                                                                                              749
                                                                                                                                                                                                                                      553
                                                                                                                                                                                                      467                    390
                                                                                                                500                                                  275        320        315
                                                                                                                                                          191                                                       242
                                                                                                                       153             118                      81         97         79         98         143
                                                                                                                              -   35         18 76   51
                                                                                                                   -
                                                                                                                        0-1       1-4        5-14    15-19      20-24      25-34 35-44           45-54      55-64   65-74    75-84     85+
                                                                                                                                                                                Age

                                                                                                                                         Discharges per 1,000 pop.               Days of Care per 1,000 pop.

                                                                                                                        Data on days of care for infants was not available

        The 65+ age cohort as a percent of                                                                                                                      Average age of hospital
        total U.S. population is expected to                             The 90+ age
                                                                                                                                                                inpatients was ~41 in 1970
        grow from 13% in 2010 to 19% in                                  cohort is the
                                                                                                                                                                vs. ~58 in 2010
        2030                                                           fastest growing
                   1Definedas those born between 1946 and 1964
                   Source: U.S. Census Bureau; Claritas; CDC’s Health, United States, 2009; U.S. National Center for Health Statistics; Utilization statistics based on 2010 data.
Demographic Changes (continued)
. . . But the trending ratio of U.S. workers to Medicare enrollees will not
support the current model.
Medicare Beneficiaries and The Number of
Workers per Beneficiary
Key Implications
• Octogenarians Centenarians
• Move to “de facto” single payer
system (Medicare)
• Patients in hospital will be older
with more co-morbidities
• Who will be the innovators?
This “upside down” trend
also impacts ratio of
clinicians to patients
Source: Kaiser Family FoundationIncreased Medicare and Medicaid Volumes Will Make Cost-Shifting to Commercial Payers More Difficult
HISTORICAL FUTURE
Reimbursement Reimbursement (%
Payer (% of Cost) Payer of Cost) Volume
Commercial (blended) 140% Commercial 130%
Medicare 90% Medicare 80%
Medicaid 70% Medicaid 60%
Self Pay 30% Self-Pay 20%
Health System Imperatives:
Location, Location, Location – go where Benchmarking and controlling costs
the paying population is Must generate positive return on Medicare
Maximize volumes from top payers
Pushing payers to increase/maintain rates (those that
cannot may consider consolidation)
Higher levels of collaboration with physicians to create
and get paid for value
Case Study on Massachusetts Medicaid Program (MassHealth): Medicaid enrollment increased from approximately 1M to 1.4M
members from 2006-2010 but the payment to cost ratio fell from 82% to 70% in the same period.
*Source: Massachusetts Hospitals: Critical to the commonwealth and threatened in the economic downturn. MHA.Increased Medicare and Medicaid Volumes Will Make Cost-Shifting to Commercial Payers More
Difficult
• HISTORICAL • FUTURE
Reimbursement
Payer (% of Cost) Reimbursement (%
Commercial (blended) 140% Payer of Cost) Volume
Medicare 90% Commercial 130%
Medicaid 70% Medicare 80%
Self Pay 30%
Medicaid 60%
Health System Imperatives:
Self-Pay 20%
Location, Location, Location – go where Benchmarking and controlling costs
the paying population is Must generate positive return on Medicare
Maximize volumes from top payers
Pushing payers to increase/maintain rates (those that
cannot may consider consolidation)
Higher levels of collaboration with physicians to create
and get paid for value
Case Study on Massachusetts Medicaid Program (MassHealth): Medicaid enrollment increased from approximately 1M to 1.4M
members from 2006-2010 but the payment to cost ratio fell from 82% to 70% in the same period.
*Source: Massachusetts Hospitals: Critical to the commonwealth and threatened in the economic downturn. MHA.Obamacare Recap
Healthcare Reform
Regulatory reform is attempting to undergo three primary phases to increase access, expand benefits,
and decrease costs
                 2010 - 2013                                           2014                                           2015 – 2020
•   Temporary high risk pool created              •   Individual Mandate                             •   Employer Mandate (2015)
•   Dependent coverage until age 26               •   Health Benefit Exchange for individuals and    •   Health Benefit Exchange for Children’s
•   No preexisting conditions under age 19            small employers                                    Health Insurance Program (2015)
•   Medicare Part D rebate                        •   Standardized “Essential Health Benefits”       •   Quality of Care reimbursements for providers
•   Non-discrimination rules for insured plans    •   Guarantee issue and renewal rules                  (2015)
•   Limits on insurance premium increases         •   Rating restrictions (family size, geography,   •   States can form healthcare choice compacts
•   Lifetime dollar limits prohibited                 age, and tobacco use only)                         (2016)
•   Annual dollar limits restricted               •   No preexisting conditions                      •   10% threshold for itemizing medical
                                                  •   Annual dollar limits prohibited                    expenses for seniors (2016)
•   No cost sharing for preventative care
•   FSA / HSA / HRA changes                       •   Insurance deductible caps                      •   Health Benefit Exchange for all employers
                                                  •   Waiting period limited to 90 days                  (2017)
•   Medical loss ratio and policyholder rebates
                                                  •   Mandatory coverage for clinical trials         •   Waiver for state innovation if alternative
•   Appeals for adverse benefit determination
                                                  •   Implementation of wellness programs                healthcare plan implemented (2017)
•   Anti-fraud funding increased
                                                                                                     •   Federally-regulated multi-state plans
•   PCORI / comparative effectiveness             •   ICD-10 code adoption
                                                                                                         available in every state (2017)
•   Employer-provided health benefits on W-2      •   Medicaid for everyone under 133% of FPL
                                                                                                     •   Excise tax on high cost “Cadillac” insurance
•   Details on administrative expenditures        •   Phase in of two multi-state plans
                                                                                                         plans (2018)
•   Readmissions Reductions Program               •   Tax credits for low income filers
                                                                                                     •   Medicaid coverage extended to former foster
•   More generics approved by FDA                 •   10% threshold for Itemizing medical                care youth under age 25 (2019)
•                                                     expenses for everyone under age 65
    Small business tax credits                                                                       •   Medicare Part D “donut hole” closed (2020)
•   Additional 0.9% tax on high earners           •   Small business tax credits
•   Annual fee on pharmaceutical manufacturers    •   Annual fee on insurers
•   Excise tax on medical device sales

              Increase access                            Expand benefits                       Decrease costs
Healthcare Trends
The Healthcare competitive landscape is expected to change dramatically over the next few years
By 2017, healthcare will consume over 20% of the US GDP at a cost exceeding $3 trillion
30M more people will be insured in 2017 vs. 2013
Medicare coverage will migrate to 59-60M enrollees from current 47-49M
Inpatient revenue growth will remain flat while outpatient growth will increase to approx. 20%
Physician shortages will range from 150,000 – 170,000
1/3 of hospitals will have closed or be on a path to closure by 2020 (100+ per year)
Competition will increase as healthcare providers compete on cost and quality
Three major technologies will dramatically change healthcare: electronic medical records, mobile applications, and genomics
Innovation and competition will increasingly come from firms outside traditional healthcare boundaries (e.g., retail, web-based
firms)
Reimbursement will transfer from a production model to one predicated on outcomes and population health management
Employers will be an increasing force in the delivery of preventative services and health care
Consumer engagement will be an increased focus for payers and providers
Many of these changes are being driven by Healthcare ReformYou can also read