Methodology and User Guide - National Walkability Index - June 2021 www.epa.gov/smartgrowth - US ...
←
→
Page content transcription
If your browser does not render page correctly, please read the page content below

June 2021
 www.epa.gov/smartgrowth

 National Walkability Index
Methodology and User Guide

Acknowledgments

This guide was prepared by U.S. Environmental Protection Agency (EPA) Project Leads: John Thomas
(thomas.john@epa.gov) and Lori Zeller (ORISE Program Participant) in 2017 and updated in 2021 by
Urban Design 4 Health under contract with EPA and EPA Project Leads: John Thomas
(thomas.john@epa.gov) and Alexis Rourk Reyes (Rourk.alexis@epa.gov).

Mention of trade names, products, or services does not convey official EPA approval, endorsement, or
recommendation.

License information for photos used under a Creative Commons License:
https://creativecommons.org/licenses/by-sa/2.0/

Cover photo by Megan Susman, EPA. All photos and maps not attributed to other sources are provided
by EPA.

 ii
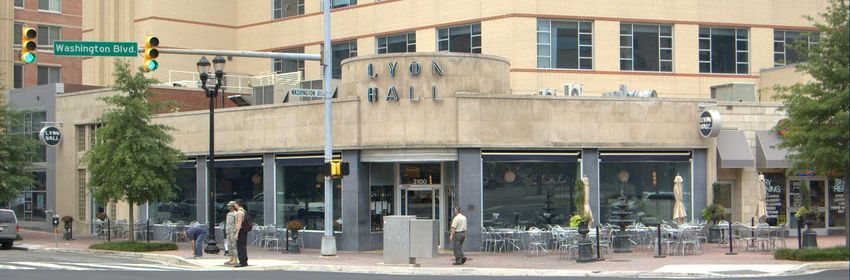
Table of Contents
I. Introduction.......................................................................................................................................................... 1
II. Methodology ....................................................................................................................................................... 4
III. The National Walkability Index in Action...................................................................................................... 6
 A. Rural Area: National Walkability Index Score = 1.2 ......................................................................................7
 B. Suburban Residential Area: National Walkability Index Score = 8.3 ............................................................9
 C. Historic Main Street/Downtown: National Walkability Index Score = 13.7................................................10
 D. City Center/Suburban Town Center: National Walkability Index Score = 17.5..........................................11

 iii
National Walkability Index Introduction

I. Introduction

Across the United States, many
neighborhoods are experiencing
dramatic transformations. In large
cities and small towns, parking
lots, underused commercial
properties, and former industrial
sites are being replaced by
condominiums, apartments,
townhouses, and small-lot single-
family homes. People are moving
to these locations for the
convenience of being able to walk
from their homes to nearby train
stations, restaurants, jobs, schools,
and other community amenities.

A 2015 survey by the National
Association of Realtors and
Portland State University found
that 48 percent of respondents
would prefer to live in Figure 1: The very walkable 16th Street Mall in Denver. Photo Credit: Amy Aletheia Cahill
 via Flickr
communities containing houses
that have small yards but are
within easy walking distance of the community’s amenities, as opposed to living in communities with
houses that have large yards and require residents to drive to all amenities. 1

Formerly vacant office buildings are being repurposed into mixed-use buildings, with apartments and
condos on upper floors and office space and retail on lower floors. Companies of all sizes are choosing
to locate in walkable downtown areas where their employees can get to work by transit, walking, biking,
or driving shorter distances and can walk to local businesses during their lunch hour. 2,3 All of these
changes demonstrate a growing demand for walkable communities.

The definition of walkability is simple: a walkable place is easy to walk around. Walkable communities
come in various sizes and styles depending upon where they are located in the country; whether they are
in a city, suburban area, or small town; and whether they have public transit. A walkable community in a
small Northeastern village could look very different from a Southwestern city.

1 National Association of Realtors. “Millennials Favor Walkable Communities, Says New NAR Poll.” Press release, Jul. 28, 2015.
http://www.realtor.org/sites/default/files/reports/2015/nar-psu-2015-poll-press-release.pdf.
2 Smart Growth Online. “Smart Growth Principles.” http://www.smartgrowth.org/smart-growth-principles. Accessed Jun. 28, 2016.
3 EPA. Smart Growth and Economic Success: The Business Case. 2013. https://www.epa.gov/smartgrowth/smart-growth-and-economic-
success-business-case.

 1

National Walkability Index Introduction

Walkable neighborhoods make it easier to
walk to stores, jobs, and other places, which WALKABILITY RESOURCES
encourages people to be more active and
can help them stay healthier. These Programs are available from all levels of
individual benefits add up to more
 government are in place to support more
widespread public health benefits such as
reduced obesity and diabetes rates. 4 When walkable built environments and
people choose to walk, bike, or take transit, communities. A few of these resources from
they drive less, which reduces pollution federal agencies include:
from vehicles and improves human and
environmental health. 5 Resources to Encourage and Promote Safe
 Bicycling and Walking from the US Department
Additionally, compact, walkable
 of Transportation
neighborhoods can help conserve natural
 https://www.transportation.gov/mission/health
resources and reduce infrastructure costs
 /Encourage-and-Promote-Safe-Bicycling-and-
because more spread-out areas need more
land, roads, and utility lines per Walking
household. 6,7
 Websites, guides, and campaigns from the
Walkable communities also encourage Centers for Disease Control and Prevention and
social interaction, which engenders a sense Department of Health and Human Services
of community and improves people’s https://www.cdc.gov/physicalactivity/walking/i
mental health—when people are walking to ndex.htm
the grocery store or movie theater, they
might encounter neighbors or friends, and Data and tools on physical activity from the
those types of interactions are far less National Cancer Institute of the National
common and less personal when people Institutes of Health
travel in automobiles. 8,9 A walkable https://cancercontrol.cancer.gov/brp/hbrb/phy
community is safer for pedestrians because
 sical-activity
narrower streets with shorter crosswalks
will reduce vehicle speed and increase
pedestrian visibility. Smart Growth Technical Assistance from the US
 Environmental Protection Agency
 https://www.epa.gov/smartgrowth/smart-
 growth-technical-assistance-programs

4 Glazier, R.H., et al. “Density, Destinations or Both? A Comparison of Measures of Walkability in Relation to Transportation Behaviors,
Obesity and Diabetes in Toronto, Canada.” PLoS ONE 9.1 (2014).
http://www.journals.plos.org/plosone/article?id=10.1371/journal.pone.0085295.
5 Younger, M., et al. “The Built Environment, Climate Change, and Health: Opportunities for Co-Benefits.” Journal of Preventive Medicine
35.1 (2008): 517-526.
6 EPA, Smart Growth and Economic Success: The Business Case.
7 Norman, J., H. MacLean, and C. Kennedy. “Comparing High and Low Residential Density: Life-Cycle Analysis of Energy Use and
Greenhouse Gas Emissions.” Journal of Urban Planning and Development 10.1061 (2006): 10-21.
8 Leyden, K.M. “Social Capital and the Built Environment: The Importance of Walkable Neighborhoods.” American Journal of Public Health
93 (2003): 1546-1551.
9 Umberson, D. and J.K. Montez. “Social Relationships and Health: A Flashpoint for Health Policy.” Journal of Health and Social Behavior
51(Suppl) (2010): S54-S66.

 2
National Walkability Index Introduction

Many community leaders and residents, as well
as public health officials, planners, and other
municipal staff, want to make communities
more walkable because of these benefits.
However, there are no universal tools that
provide transparent insight into what makes a
community walkable, which makes it
challenging to analyze and compare
communities’ walkability.

To help fill this gap, EPA developed the
National Walkability Index, a tool that measures
the relative walkability of our nation’s
communities. Users can view the index on an
online interactive map or download the data. 10
The dataset covers every block group 11 in the
nation, providing a basis for comparing
walkability from community to community.
This dataset’s universal coverage at the block
group level makes it easy to use as input into
scenario planning, modeling, and other
community analysis. Other tools and datasets to
explore walkability do not allow such easy
incorporation into other analyses. Users can
display the National Walkability Index data on a Figure 2: AARP sums up the road safety benefits that a
 walkable community can create: “A street that's made safer
map or incorporate it as input into other for an older adult to cross is also safer for a child, a parent
calculations using GIS software, database pushing a stroller, a bicyclist, a jogger. In other words, a
software, or spreadsheets. walkable community benefits everyone.”

 Source: AARP. “Walkability Archive: Reports, case studies,
 surveys and more.” http://www.aarp.org/livable-
 communities/archives/info-2014/walkability.html. Accessed
 Jun. 28, 2016.

10 Links to the National Walkability Index’s map and data are on EPA’s “Smart Location Mapping” webpage at
https://www.epa.gov/smartgrowth/smart-location-mapping#walkability.
11 A block group is a statistical division of a census tract. More information from U.S. Census Bureau. “Geographic Terms and Concepts -
Block Groups.” https://www.census.gov/programs-surveys/geography/about/glossary.html#par_textimage_4. Accessed Jun. 4, 2021.

 3

National Walkability Index Introduction

II. Methodology

The National Walkability Index data are available at the block group level, a unit of census
geography that is smaller than a census tract and larger than a census block. 12 Every block group
in the United States is assigned a National Walkability Index score. The National Walkability
Index is based on measures of the built environment that affect the probability of whether people
walk as a mode of transportation: street intersection density, proximity to transit stops, and
diversity of land uses. 13 Although numerous factors influence walking, these measures were
chosen for the National Walkability Index because they can be measured using variables in the
Smart Location Database (SLD), 14 which has nationwide data availability and consistency at the
block group level. This limited set of variables also helps make the index simple and easy for a
general audience to understand. 15

The selected variables from the SLD are:

 • Intersection density (SLD variable D3b): Higher intersection density is correlated with
 more walk trips.
 • Proximity to transit stops (SLD variable D4a): Distance from population center to nearest
 transit stop in meters. Shorter distances correlate with more walk trips.
 • Diversity of land uses
 o Employment mix (SLD variable D2b_E8MixA): The mix of employment types in a
 block group (such as retail, office, or industrial). Higher values correlate with more
 walk trips.
 o Employment and household mix (SLD variable D2a_EpHHm): The mix of
 employment types and occupied housing. A block group with a diverse set of
 employment types (such as office, retail, and service) plus many occupied housing
 units will have a relatively high value. Higher values correlate with more walk trips.

To determine the walkability scores, these variables were used to rank every block group in the
United States. Each block group was assigned four ranked scores, one for each of the variables
above. To score block groups, the block groups were placed into 20 quantiles by variable value
(quantiles are groupings with equal numbers of records), each containing 5 percent of the total
block groups. The block groups were then assigned a rank from 1 to 20 depending upon their
quantile position. A ranked score of 1 was assigned to the block groups with the lowest relative
values influencing walking, and a ranked score of 20 was assigned to the block groups with the
highest relative values influencing walking, with intermediate scores in between.

12 Block groups vary in size based on population density. In a dense urban area, a block group can be as small as one or two
acres. In rural areas, block groups can encompass thousands of acres.
13 Ewing, R. and R. Cervero. “Travel and the Built Environment: a Meta-Analysis.” Journal of the American Planning Association
76 (2010): 265–294.
14 The Smart Location Database, a dataset compiled by EPA, contains more than 90 variables describing transportation and
land use characteristics at the block group level for the entire nation. See https://www.epa.gov/smartgrowth/smart-location-
mapping#SLD.
15 The variable descriptions are simplified in this report to help make the National Walkability Index accessible to a general
audience. Detailed information about these variables, including their original data sources and the methods used to construct
them, are available in: EPA. Smart Location Database Technical Documentation and User Guide. 2021.
https://www.epa.gov/smartgrowth/smart-location-database-technical-documentation-and-user-guide.
 4

National Walkability Index Introduction
For example, if a block group has a relatively high value for street intersection density, it might
receive a ranked score of 18 for that variable. If a block group has a relatively low value for
employment and household mix, it might receive a ranked score of 3 for that variable.

The ranked scores were then weighted by the following formula: 16

 Final National Walkability Index score =

 Where w = block group’s ranked score for intersection density

 x = block group’s ranked score for proximity to transit stops

 y = block group’s ranked score for employment mix

 z = block group’s ranked score for employment and household mix

The block groups are assigned their final National Walkability Index scores on a scale of 1 to 20
(Figure 3). The scores are categorized as follows:

 1 – 5.75 Least walkable
 5.76 – 10.5 Below average walkable
 10.51 – 15.25 Above average walkable
 15.26 – 20 Most walkable

16 The elasticities (magnitude of impact) of intersection density, land use mix, and proximity to transit were all significant and
similar in magnitude (Ewing and Cervero 2010). To keep the methodology behind the National Walkability Index as simple as
possible while still incorporating the known impact of the built environment on walkability, the variables were weighted as
follows: 1/3 to each of the three categories of street intersection density, land use mix, and proximity to transit. The land use
mix category was divided into two to account for the two different techniques of measurement; employment mix and
employment and household mix were each weighted by 1/6.
 5
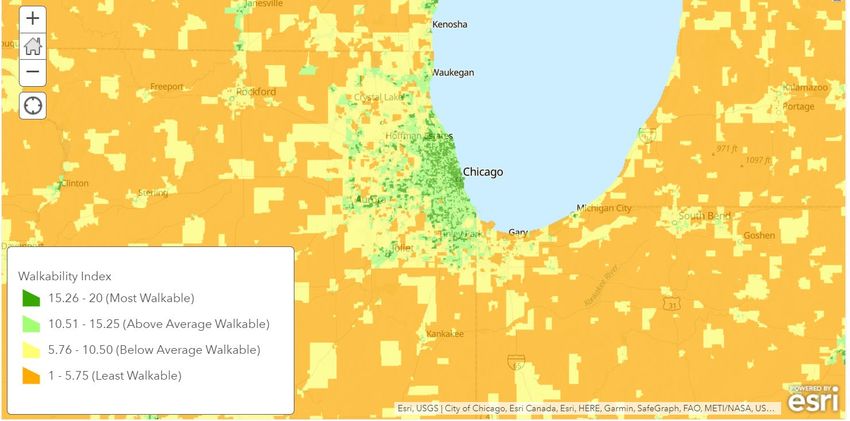
National Walkability Index Introduction

III. The National Walkability Index in Action

 Figure 3: National Walkability Index for Chicago and surrounding region (index values 1-20).

Four examples demonstrate how to calculate the National Walkability Index. The examples
illustrate the range of National Walkability Index scores and show how the index varies with the
built environment. The examples are based on four block groups in the state of Virginia. Each
example includes images that show the on-the-ground conditions of the block groups, tables that
display the ranked scores and the final National Walkability Index score calculations.

The examples are:
 A. Rural Area: National Walkability Index Score = 4.2
 B. Suburban Residential Area: National Walkability Index Score = 9.5
 C. Historic Main Street: National Walkability Index Score = 13.7
 D. City Center/Suburban Town Center: National Walkability Index Score = 17.5

 6
National Walkability Index Introduction
A. Rural Area: National Walkability Index Score = 1.2

This block group scores very low on the National Walkability Index and is not very walkable
compared to other block groups in the surrounding region, though it is known for its ample
outdoor recreation assets. This type of rural development pattern rarely has adequate
infrastructure for pedestrians. Few destinations, such as stores, schools, or workplaces, are within
walking distance, and therefore most of the 1,400 residents of this block group own vehicles.

 Figure 4. Walkability Index score shown on EPA NWI map viewer
 Figure 5. Main street of community selected for EPA’s Recreation Economy for Communities technical assistance

The raw data and ranked indicators are in the table below. Overall, this block group scores very
low on all four indicators: it has no transit access and a spread-out street network, and even
though there is a slight mix of businesses and households, the area is still relatively low-scoring
in overall walkability.

 Associated Field from Smart Location Database Ranked score
 Block group ID: Intersection density: D3b w=2
 510719302003 Proximity to transit stops (meters from
 Pembroke, VA x=1
 population center to nearest transit stop): D4a
 CBSA: Blacksburg- Employment Mix: D2b_E8MixA y=6
 Christiansburg, VA
 Employment and household mix: D2a_EpHHm z = 13

Calculations:

Final National Walkability Index score =

Final National Walkability Index score =

 7
National Walkability Index Introduction

Figure 6. Walkability Index score shown on EPA NWI map viewer

The National Walkability Index can be used in rural areas to identify walkable areas such as
main streets or historic downtowns. While rural census tracts can be large in size, the block
group scale of the Index allows users to identify smaller areas that standout for their
regions. Some of the most walkable block groups in the United States are located in towns
like Williamson, West Virginia, which is surrounded by less walkable areas, but offers a mix
of households, jobs, density, and transit that is rated highly among others in its county.
Learn more about Williamson’s participation in EPA Local Foods, Local Places technical
assistance program and their efforts to transform a vacant building in downtown Williamson
into the Health Innovations Hub (the HUB), offering fresh, healthy food, services, in a
walkable, accessible location.

 Figure 7. View of downtown Williamson, WV from EPA’s Local Foods, Local Places video (2017)

 8
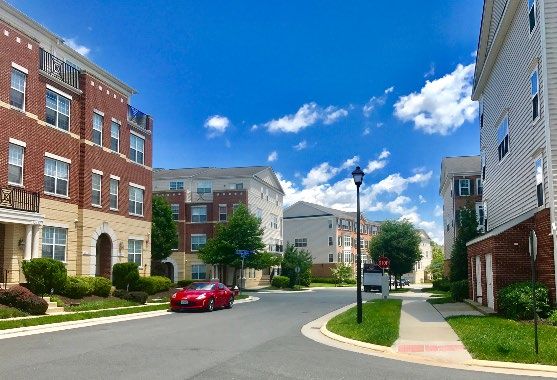
National Walkability Index Introduction
B. Suburban Residential Area: National Walkability Index Score = 8.3

This block group in Loudoun County, Virginia illustrates a below-average walkability score in a
typical inner suburban neighborhood. This block group has single-family and multifamily
housing with an average street intersection density and very low land use mix values.

The lack of access to transit is the deciding factor in the National Walkability Index score for this
block group, when ranked among others in the Washington DC metropolitan region. A
neighborhood like this one might have adequate sidewalks and other infrastructure that lets
people walk safely, though 82% of households have two or more vehicles. Therefore, the
National Walkability Index score is lower despite good access to employment and services and
average street intersection density.

 Figure 8. Suburban street in Loudoun County, VA, Photo credit: SDobie Flickr https://www.flickr.com/photos/sdobie/36378005110
 Figure 9. Walkability Index score shown on EPA NWI map viewer

 Associated Field from Smart Location Database Ranked score
 Block group ID: Intersection density: D3b w = 11
 511076110253 Proximity to transit stops (meters from
 Brambleton, VA x=1
 population center to nearest transit stop): D4a
 CBSA: Washington- Employment Mix: D2b_E8MixA y = 18
 Baltimore-Arlington-DC-
 Employment and household mix: D2a_EpHHm z = 15
 MD-VA-WV-PA

Calculations:

Final National Walkability Index score =

Final National Walkability Index score =

 9
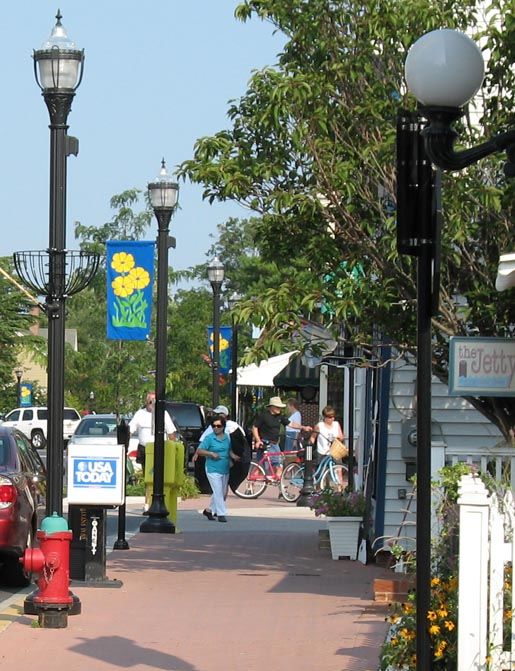
National Walkability Index Introduction

C. Historic Main Street/Downtown: National Walkability Index Score = 13.7

 This block group is an interesting example of a
 development patterns existing all over the United States in
 which historic and longstanding Main Street areas still
 function as effective downtowns for resident’s daily needs
 and entertainment preferences. Staunton’s Main Street
 area is very walkable—it has shops lining the street,
 sidewalks, and other pedestrian amenities. While the
 design and density scores are highly ranked for the
 surrounding county, the resulting National Walkability
 Index score is lowered by the transit ranking, although the
 ranked scores for the other three variables are high.

 Figure 11. Staunton, VA’s Main Street

 Figure 12. Walkability Index
 score shown on EPA NWI map
 viewer

 Associated Field from Smart Location Database Ranked score
 Block group ID: Intersection density: D3b w = 20
 517900001001 Proximity to transit stops (meters from
 Staunton, VA x=1
 population center to nearest transit stop): D4a
 CSA: Harrisonburg- Employment Mix: D2b_E8MixA y = 20
 Staunton CSA
 Employment and household mix: D2a_EpHHm z = 20

Calculations:

Final National Walkability Index score =

Final National Walkability Index score =

 10
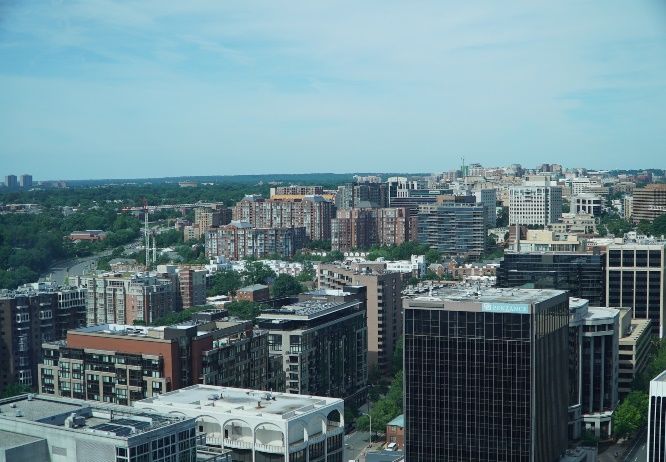
National Walkability Index Introduction
D. City Center/Suburban Town Center: National Walkability Index Score = 17.5
This is one of the high-scoring block groups in the Washington, D.C. metropolitan area, which
presents many highly ranked groups given the mix of uses, transit systems, and intersection
density found in many parts of the region. In Arlington County, Virginia, while the density and
diversity of uses in the broader area is high, neighborhoods are kept in scale through adaptive
reuse of key historic buildings and programming. For example one of several metro station
entrances used in creative ways to promote walking and cycling includes a farmers market
offering for locally-sourced produce within easy reach for transit riders.
Figures 13, 14, and 15. Various parts of Arlington County. Photo credit: Arlington County https://www.flickr.com/photos/arlingtonva

 Associated Field from Smart Location Database Ranked score
 Block group ID: Intersection density: D3b w = 19
 510131015003 Proximity to transit stops (meters from
 Arlington, VA x = 19
 population center to nearest transit stop): D4a
 CBSA: Washington- Employment Mix: D2b_E8MixA y = 13
 Baltimore-Arlington-DC-
 Employment and household mix: D2a_EpHHm z = 16
 MD-VA-WV-PA

Calculations:

Final National Walkability Index score =

Final National Walkability Index score =

 11
You can also read