MIAMI-SOUTH FLORIDA National Weather Service Forecast Office
←
→
Page content transcription
If your browser does not render page correctly, please read the page content below
MIAMI-SOUTH FLORIDA
National Weather Service
Forecast Office
http://www.weather.gov/miami
SOUTH FLORIDA WINTER 2022-2023 SUMMARY
Much Warmer and Mainly Drier than Normal Winter
March 3, 2023: It may sound like a broken record, but South Florida experienced yet
another warmer than normal winter. In fact, the recently concluded meteorological
winter (December – February) was in the top 5 at all local climate sites, even reaching
the second warmest in Miami and Fort Lauderdale. More information in the
temperature section below.
The prevailing winter weather pattern was characterized by a stronger-than-normal mid
to upper level high pressure over eastern North America, the Gulf of Mexico, and the
western Atlantic Ocean (Figure 1), and the mean upper level jet stream position was
over the Central U.S. and mid-Atlantic states. The average position of these large-scale
weather features is a hallmark of La Niña winters in North America, and led to fewer
cold fronts moving through Florida. As a result, our area experienced longer warm spells
and only a few relatively brief (but noteworthy) cold episodes. The relative lack of
frontal systems affecting South Florida also led to little rainfall (with the exception of
portions of SE Florida) and no severe weather events this winter.
Winter 2022-2023 temperature and precipitation summaries are below.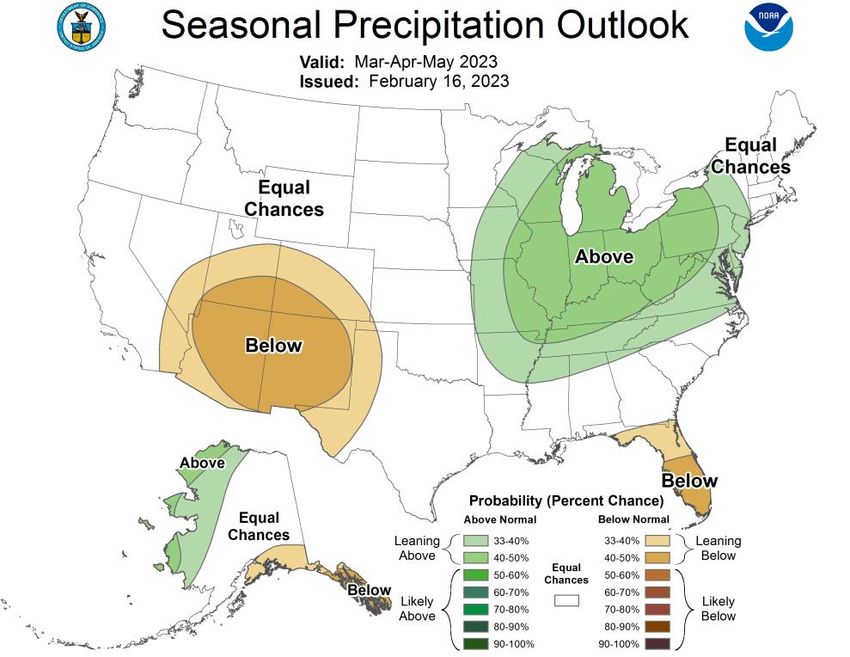
Figure 1: 500 mb height anomalies for December 2022-February 2023. Yellow colors reflect stronger high
pressure at the 500 mb level, and blue colors reflect stronger low pressure
Temperatures
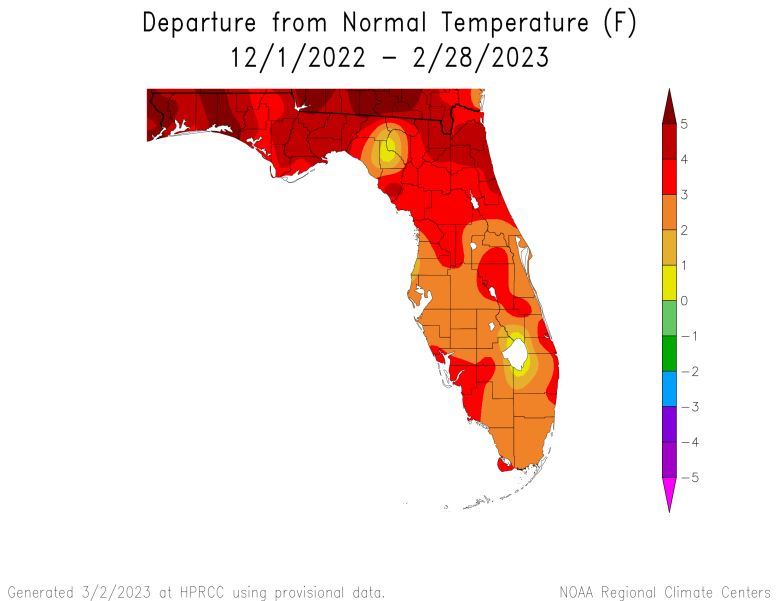
Average winter temperatures were mostly 3 to 4 degrees above normal across South
Florida (Figures 2 and 3).
Figure 2: Temperature Departure from Normal across Florida for December 2022-February 2023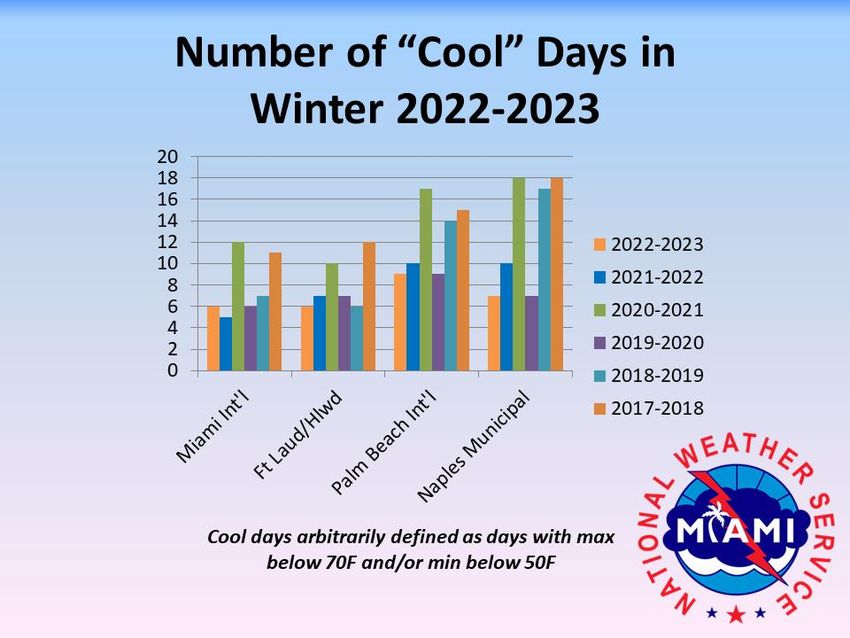
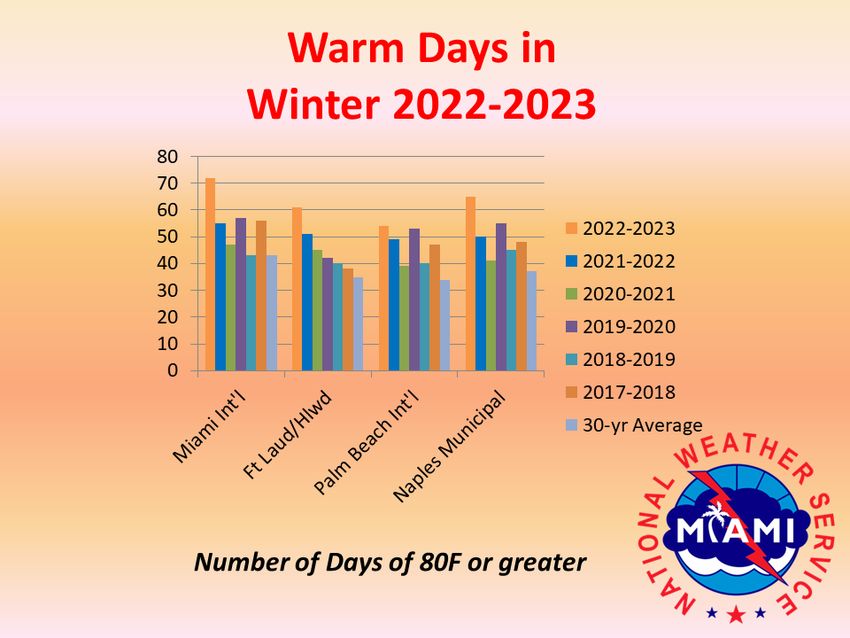
Figure 3: Average winter temperatures 2016-2023 for main South Florida climate sites

Above-normal temperatures were observed on more than 80% of the days this winter,
and up to 87% at Miami International Airport. In fact, Miami International Airport
reached 80 degrees on 72 days which is the highest number on record going back to
1895. An all-time winter high temperature record of 90F was tied at Palm Beach
International Airport on February 28th.

Only 2 cold episodes occurred this winter, December 24-26 and January 14-16. Although
few in number, they were especially noteworthy given the prevailing winter warmth.
The Christmas cold episode featured temperatures failing to reach 60F for 3 consecutive
days, and a cold Christmas Day in which the high temperature barely reached 50F in a
few locations. On January 15th and 16th, temperatures dropped into the 30s and 40s,
with freezing temperatures observed in a few locations over the interior. The lowest
recorded temperature at NWS sites was 34F in Moore Haven on the 16th, although
unofficial readings of 30F were recorded in Palmdale on the 15th, and 32F in Immokalee
on the 15th. Some damage to crops was noted, especially in western Palm Beach County.
Below are graphics with additional temperature data for the four main climate sites in
South Florida:

             Figure 4: Number of days of sub-70F degree highs and/or sub-50F degree lows.

                    Figure 5: Number of days greater than or equal to 80 degrees F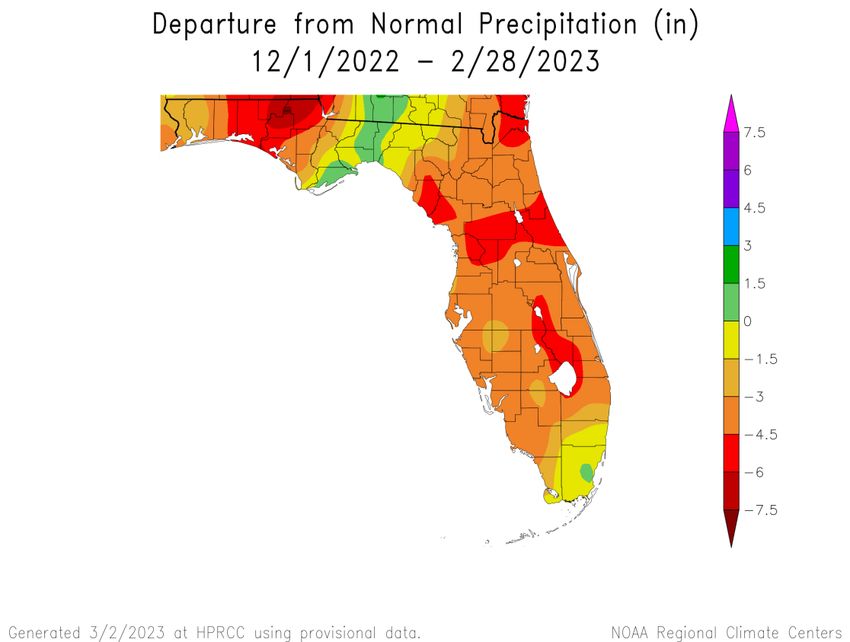
Figure 6: Daily temperature data for Miami International Airport for December 2022- February 2023. This is
              generally representative of winter temperature trends at all South Florida locations

Here are average December 2022-February 2023 temperatures, departure from normal
in degrees F and ranking for the four main South Florida climate sites:

Location (beginning of                 Dec 2022-        Departure from                Rank
period of historical record)           Feb 2023           Normal (F)
                                       Avg Temp
Miami (1895)                             73.4                   +3.2            T-2nd warmest
Fort Lauderdale (1912)                   73.0                   +3.1            T-2nd warmest
West Palm Beach (1888)                   71.4                   +3.5             5th warmest
Naples (1942)                            70.7                   +3.7            T-3rd warmest

Other noteworthy statistics and data:

- Miami International Airport: The highest temperature recorded was 88 degrees set on
January 23rd, February 3rd, and February 28th, and the lowest temperature recorded was
44 degrees on January 16th. The temperature reached or exceeded 80 degrees on 72
days, well above the average of 43 days and the highest number on record. The number
of days below 50 degrees was 6 which equals the 30-year average.

- Palm Beach International Airport: The highest temperature recorded was 90 degrees
on February 28th, and the lowest temperature recorded was 40 degrees on January 15th.
The temperature reached or exceeded 80 degrees on 54 days, which is well above the
average of 34 days. The number of days below 50 degrees was 8 which is well below the
30-year average of 14 days.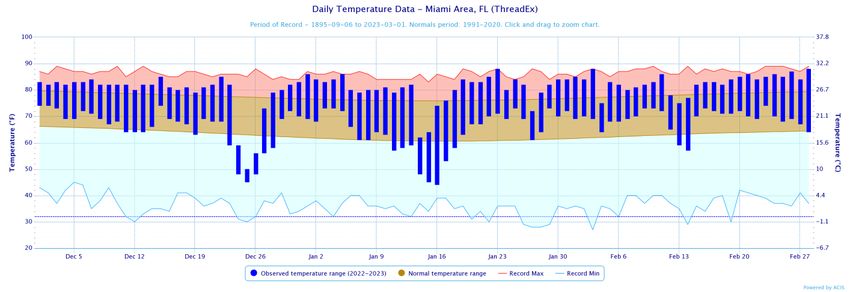
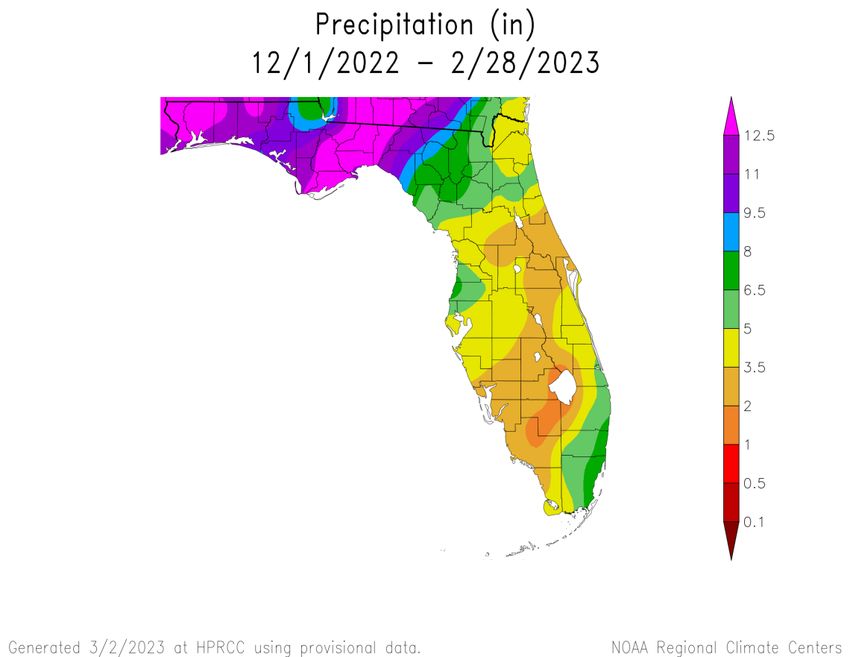
- Fort Lauderdale/Hollywood International Airport: The highest temperature recorded
was 88 degrees on February 28th, and the lowest temperature recorded was 43 degrees
on January 15th. The temperature reached or exceeded 80 degrees on 61 days, well
above the average of 35 days. The number of days below 50 degrees was 6 which is
below the 30-year average of 8.

- Naples Municipal Airport: The highest temperature recorded was 87 degrees on
February 23th and February 24th, and the lowest temperature recorded was 41 degrees
on January 16th. The temperature reached or exceeded 80 degrees on 65 days, well
above the average of 37 days. The number of days below 50 degrees was 6 which is well
below the 30-year average of 17.

Precipitation
The same pattern that led to the much warmer than normal winter also contributed to a
drier than normal winter for most of southern Florida (Figures 7 & 8). The western half
of South Florida received only about 1.5 to 3 inches which is less than half of the normal
winter rainfall. Palm Beach County received anywhere from 2 to 6 inches, with values
increasing from west to east.

Broward and Miami-Dade counties were the only parts of South Florida to have near to
slightly above normal rainfall, with about 6-8 inches on average. Most of this
precipitation fell in only a few days, and 3-5 inches of rain fell on February 5th alone in
association with a front stalled across SE Florida.

The lack of rainfall over most of South Florida has led to the development of moderate
drought conditions as of the first week of March.
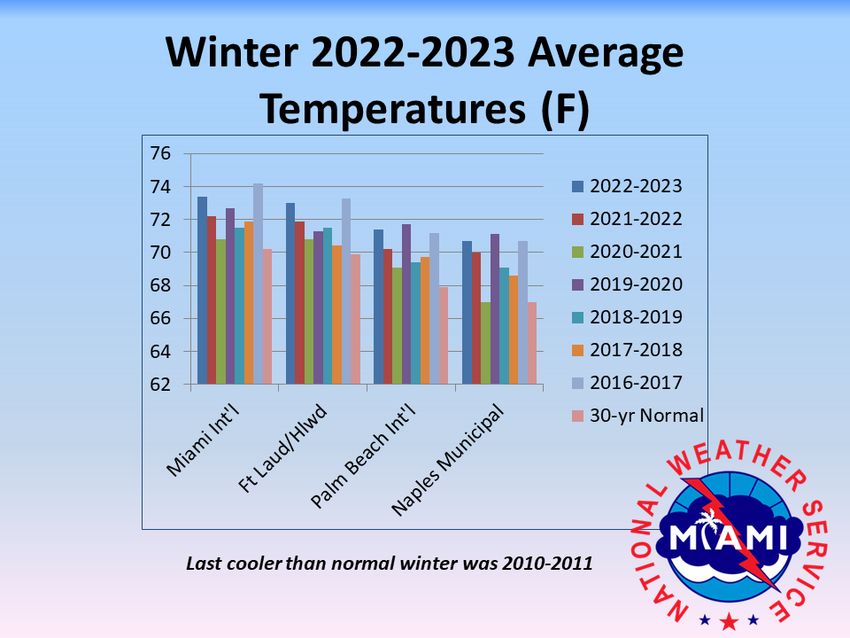
Figure 7: Observed Precipitation for Winter 2022-2023

Figure 8: Departure from Normal Precipitation for Winter 2022-2023
Following are December 2022-February 2023 rainfall totals, departure from normal in
inches and ranking for selected locations:

                                           Dec 2022-
                                                          Departure        Top 20
Location (Beginning of Period of           Feb 2023
                                                            from           Rank
Record)                                     Rainfall
                                                           Normal
                                            (inches)
Canal Point (1941)                            1.80           -4.57        6th Driest
Cape Florida (1998)                           6.24           -0.44
Fort Lauderdale/Hollywood Int'l (1912)        6.71           -1.35
Fort Lauderdale Exec. Airport (1998)          4.42           -2.70        8th Driest
Fort Lauderdale Dixie Water Plant             8.24           -0.10
Hollywood Water Plant (2000)                  10.02          +1.99
Marco Island (2002)                           1.49           -4.63        3rd Driest
Miami International Airport (1895)            7.50           +1.08
Muse (2009)                                   3.65           -2.75
Naples Municipal Airport (1942)               2.21           -2.19       18th Driest
NWS Miami (1999)                              7.74           +1.12
Opa-Locka Airport (1998)                      6.33           -0.31
Palm Beach Gardens (2002)                     6.02           -3.76
Palm Beach International Airport (1888)       4.86           -4.72
Pembroke Pines North Perry Apt (1999)         5.82           -1.90
Pompano Beach Airpark                         5.64           -0.75
The Redland (1942)                            7.94           +1.38
West Kendall/Miami Exec. Airport              7.64           +1.66

Severe Thunderstorms/Tornadoes/Flooding
No severe thunderstorm, tornado, or flooding events occurred this winter. Two brief
episodes of gusty winds in the 35-40 mph occurred in January and February ahead of
frontal systems, and only minor flooding was observed with the rain event of February
5th.

There was a rip current-related death at Juno Beach on December 20th.
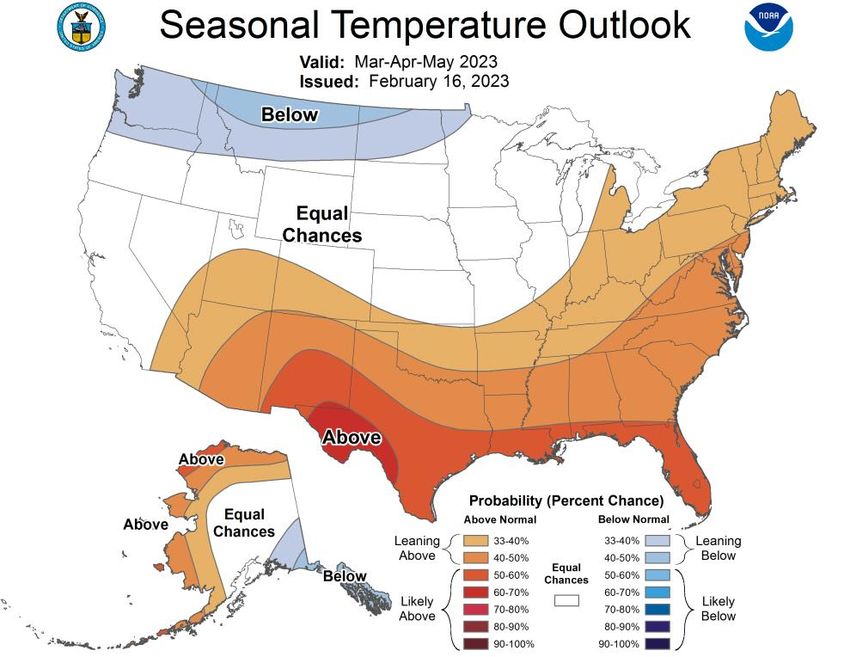
Outlook for March-May The outlook by the NOAA Climate Prediction Center for the period from March through May (Figures 9 and 10) is for above normal temperatures likely across South Florida, as well as leaning towards below normal precipitation. Even though La Niña is expected to wane this spring, its lingering influence is the main feature leading to the mainly warmer and possibly drier than normal conditions persisting through May. The current dry conditions over most of South Florida along with the possibility of a drier than normal spring means that drought conditions are likely to worsen and expand in area in the coming weeks, especially as temperatures increase and fuels become dry. The significant wildland fire potential is above normal through May for all of South Florida. All persons are urged to take measures to reduce the chance of wildfires. Visit the Florida Forest Service web site for more information on how to help prevent wildfires. Spring also brings an increase in easterly winds to the area along with an increase in beach-goers. This significantly increases the risk of rip currents along the east coast beaches. A sharp increase in rip current-related drowning deaths and rescues occurs during the spring months due in part to this shift in the wind patterns and more people in the water. All residents and visitors visiting area beaches are strongly urged to heed the advice of Ocean Rescue lifeguards and swim near a lifeguard. Visit the National Weather Service Rip Current Awareness page for more information. For the latest south Florida weather information, including the latest watches, advisories and warnings, please visit the National Weather Service Miami Forecast Office’swebsiteatweather.gov/southflorida.
Figures 9 and 10: NOAA Climate Prediction Center outlook for March-May.
You can also read