In this issue Central Queensland seasonal climate outlook and information for producers January 2021
←
→
Page content transcription
If your browser does not render page correctly, please read the page content below

Central Queensland seasonal climate outlook and
information for producers
January 2021
From your Central Queensland Climate Mates
In this issue…
2020 in review: below average rainfall for much of the
southern central Queensland region
La Nina delivers good December rainfall for the north, but
not much in the south: is it on its last legs or is there more
to come?
Latest seasonal outlooks from the range of global agencies
1
2020 rainfall average for most of Queensland, but the south-east is still
stubbornly dry
The table below shows how most areas in the CQ region received below median rainfall in 2020. Some storms late
in December did improve the situation in isolated areas, but it was patchy.
The 36 month rainfall decile map shown in Figure 1 shows just how dry the last three years have been, meaning it
will take a lot of rain to bring soil moisture levels back up to a reasonable level.

                   2020 total rainfall compared to median

                 Total      + or -                          Total      + or -
Location                               Location
                 rainfall   median                          rainfall   median

Biggenden          809        109      Miriam Vale            756       -269

Biloela            500        -131     Monto                  542       -156

Clermont           399        -211     Moranbah               380       -176

Collinsville       706         43      Mundubbera             516       -171

Duaringa           648        -10      Rockhampton            700       -47

Gin Gin            598        -395     Springsure             541       -144

Junee Station      519        -47      St. Lawrence           857       -95

Maryborough        871        -206     Theodore               627        8

           Table 1: 2020 total rainfall compared to median                           Figure 1: 36- month rainfall decile map (BoM)

La Nina delivers excellent wet season rainfall in the north, but still to deliver
in the south

                                                                         The monsoon finally kicked in during December, bringing
                                                                         an excellent start to the wet season in northern
                                                                         Australia. The Kimberley, the NT and much of northern
                                                                         Queensland received above average rainfall during
                                                                         December.

   Figure 2: December 2020 rainfall decile map (BoM)
Two cyclones during January resulted in well above average rainfall along the Queensland tropical north coast.
However January rainfall has been around average, or below average, for most of the southern half of the state.
The monsoon is returning to the north, but the south has returned to, and will remain in, a dry period for the next
couple of weeks at least.
So, is the La Nina on its last legs, or can the south of the state expect something out of it before it fizzles out? In
recent years the wet season has not really kicked in until mid to late February. In fact it can be as late as March
before we see significant rainfall, especially in the Fitzroy and Burnett Mary. Is this a changing pattern?
What is the BoM saying regarding the current La Nina?
The BoM is saying that the La Nina is likely to have peaked in terms of sea surface temperatures in the Pacific
Ocean. However, impacts associated with La Nina, such as above-average rainfall, are expected to persist across
eastern and northern Australia through the summer months, with climate outlooks indicating above-average
rainfall is particularly likely across the eastern third of the country. The BoM is saying that the strength of La Nina
is likely to ease in the coming weeks with a likely return to neutral conditions during late summer or early
autumn. So there is still potential for some decent rainfall before the end of March.
                                                                                                                                     2
What the climate drivers are telling us at the moment
Sea surface temperatures

                                                                 The sea surface temperature (SST) map for the
                                                                 tropical Pacific Ocean shows cool anomalies
                                                                 extending from east of 160°E to south of the equator
                                                                 in the eastern Pacific. Warm anomalies
                                                                 remain around Indonesia and PNG, and in the waters
                                                                 close to much of northern and eastern Australia.
                                                                 The anomaly map is showing some warming at last
                                                                 in the Coral Sea, and along the WA coast.

                                                      th
Figure 3: Pacific sea surface temperature anomaly map 17 January (NOAA)

What’s the SAM doing?
The Southern Annular Mode, or SAM, refers to the north-south shift of rain-bearing westerly winds and weather
systems in the Southern Ocean compared to the usual position.
During a SAM positive phase in summer, the belt of westerlies has moved further south towards the Antarctic.
This allows increased moisture flow onto the Australian east coast, which can result in increased rainfall in
eastern Australia, and a reduced chance of extreme heat events. A positive phase in summer is more frequent
with La Nina.

                                                           The SAM is neutral and is expected to remain neutral for
                                                           the next fortnight.
                                                           Strongly positive values over the past month were driven
                                                           by an exceptionally strong Antarctic polar vortex which has
                                                           largely subsided.

    Figure 4: SAM current and forecast graph (BoM)
The Madden-Julian Oscillation (MJO)
                                      The presence of the MJO, along with an equatorial Rossby wave,
                                      contributed to the development of active monsoon conditions across
                                      northern Australia. Some models predict the MJO may move rapidly out of
                                      the Australian region and into the western Pacific region. Eastern parts of
                                      tropical Australia, the Coral Sea and the eastern Maritime Continent
                                      typically experience above-average rainfall with an MJO pulse over the
                                      western Pacific.
                                      However, most guidance indicates monsoon conditions will persist over the
                                      entire region, increasing the likelihood of above-average cloudiness and
                                      rainfall for much of northern Australia during the next fortnight. During this
                                      period, there is an increased risk of tropical low and cyclone formation over
                                      Australian waters.
                                th
Figure 5: MJO phase diagram to 17 January (BoM)
                                                                                                                    3
SOI phase rainfall outlook probability
The SOI has been in a positive phase for the
last few months, after rapidly rising during
the 2020 spring.
The SOI has been well above La Nina
threshold (+7.0) since October, and the
latest 30 day value is +19.5.
This is around the same value as the SOI was
in January 2011, which was when record
floods occurred across much of Queensland.
Figure 6: SOI value graph January 2019 to January 2021 (BoM)
However, a consistently positive SOI during December and January does not necessarily mean we can expect
record rainfall during following months. The SOI phase rainfall forecasts are based on historical records. In other
words, the forecast is based on what the records of the last 100 years or so show when a similar phase is
displayed at that time of the year. It may be wetter, or drier, or just average.
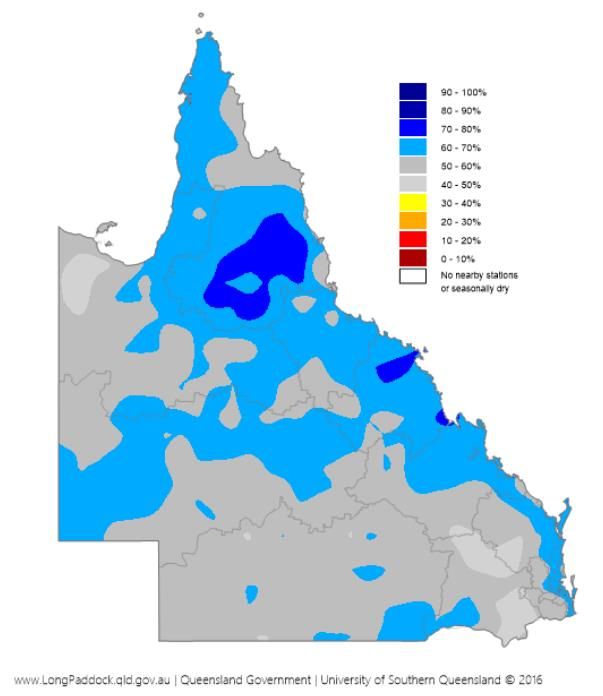
The SOI phase map at the left is a
showing the probability of exceeding
median rainfall from February to April,
based on a consistently positive SOI
phase during December and January.
The map is showing that there is a 60 to
70% probability of above median rainfall
along most of the CQ region, but only
around an average probability for
western areas of the region.
Figure 7: rainfall probability February to April, based on a consistently positive SOI phase December - January
4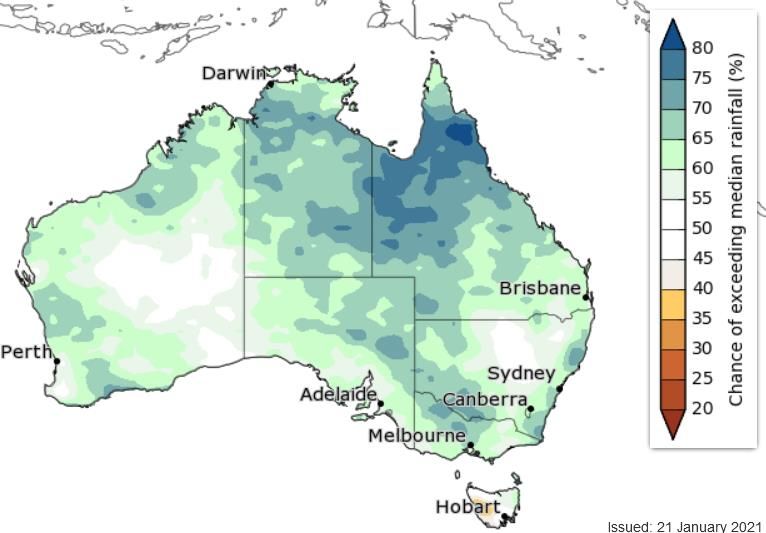
Outlooks for the next three to five months from the major climate agencies
Forecast summary
All agencies are continuing to forecast above normal rainfall from February to April, for most of eastern
mainland Australia
Forecasts for the April to July period vary, but all agencies are forecasting a return to near normal
conditions after March
Bureau of Meteorology rainfall and temperature outlooks (issued 21st January)
February to April is likely to be wetter than average for much of Australia (greater than 70% chance for
Queensland and WA, greater than 60% chance for most of the remainder of the mainland)
March to May is also likely to be wetter, with the forecast is showing a 60 to 65% probability of rainfall
being above median across most of the eastern half of the continent (including the CQ region)
The average maximum temperature for February to April is likely to be close to average across most of
Australia
The average minimum temperature for February to April is very likely to be above the long-term median
across nearly all of Australia
Figure 8: BoM rainfall outlook February to April Figure 9: BoM rainfall outlook March to May
ECMWF rainfall outlooks (issued 15th January)
ECMWF is forecasting around a 70 to 80% probability of exceeding median rainfall from February to April,
for all of the CQ region
The February to April forecast map is also showing a very high probability of above median rainfall
throughout the Coral Sea, which could be an indicator of the likelihood of more cyclonic activity
The forecast from April to June is showing a return to more normal conditions. From March on, normal
rainfall amounts decrease fairly rapidly anyway, as the wet season declines
Figure 10: ECMWF rainfall outlook February to April Figure 11: ECMWF rainfall outlook April to June
5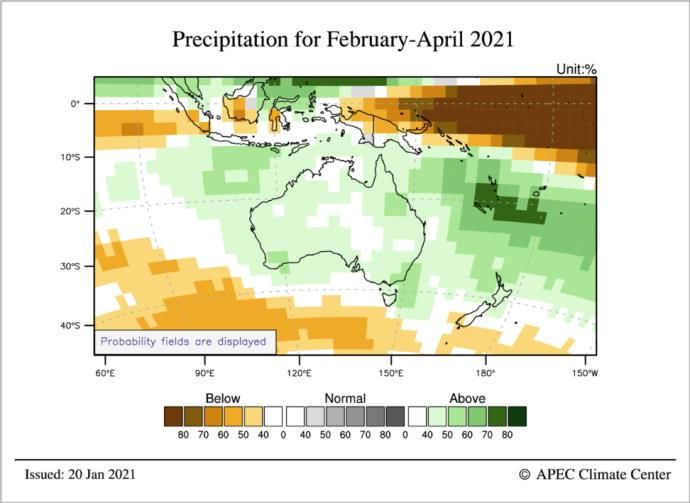
UKMO rainfall outlooks (issued 15th January)
The UKMO forecast for February to April is showing a 60 to 80% probability of above median rainfall for
the northern half of the CQ region but around median rainfall in southern areas
The April to June forecast is for around median rainfall for most of the CQ region
Figure 12: UKMO rainfall outlook February to April Figure 13: UKMO rainfall outlook April to June
APEC Climate Centre (APCC) seasonal forecasts (issued 21st January)
APCC is forecasting a 40 to 60% chance of above normal rainfall from February to April, for the CQ region. The
forecast for the next three months (May to July) is for normal to slightly above normal rainfall.
Figure 14: APCC rainfall outlook February to April Figure 15: APCC rainfall outlook May to July
Your central Queensland Climate Mates team
Peter Crawford (Miriam Vale) 0427 024 921, e-mail peter.crawford@usq.edu.au
Daniel Rea (Rockhampton) 0448 439 117, e-mail daniel.rea@fba.org.au
Nikki Pilcher (Moranbah) 0428 981 224, e-mail nikki.pilcher@usq.edu.au
Check out the Central Queenslands Climate Mates Facebook page at:
https://www.facebook.com/climatematesCQ
Next seasonal update will be in late February
6


You can also read