MICROECONOMICS OF COMPETITIVENESS - Project on Services Cluster
←
→
Page content transcription
If your browser does not render page correctly, please read the page content below
MICROECONOMICS OF COMPETITIVENESS

                                                   Project on

    Karnataka (Indian State) Offshore I.T. and BPO1
                   Services Cluster
                                                              by

                 Ioannis Gkionis, Kiran Gupta, Alison Jarrett, Pablo Jenkins, Sumeet Narang

This project has enabled the team to effectively use the course concepts to look at an offshore IT and BPO
cluster, analyze its strengths and weaknesses/challenges in a robust framework in order to develop suitable
recommendations. The course concepts were extremely useful in framing the relevant questions for primary
research through interviews with industry leaders, which helped us to identify the nuances about the cluster
history and current challenges.

    We are thankful to the MOC faculty team for their continued support and dedication to make this project a
                                          great learning experience.

1
    Information Technology and Business Process Outsourcing
TABLE OF CONTENTS
INDIA .................................................................................................................................................2
History & Political Outlook..........................................................................................................2
Economic & Social Development .................................................................................................2
Productivity Challenge..................................................................................................................5
India - National Diamond .............................................................................................................6
India - Objectives...........................................................................................................................8
India - Policy Recommendations..................................................................................................8
KARNATAKA...................................................................................................................................9
Highlights .......................................................................................................................................9
Economic and Social Performance ..............................................................................................9
Karnataka Diamond – Strengths and Weaknesses ..................................................................10
Karnataka - Policy Recommendations ......................................................................................11
KARNATAKA - OFFSHORE IT & BPO CLUSTER ANALYSIS............................................12
Description of Outsourcing – onshore and offshore.................................................................12
Global Market Size......................................................................................................................12
Factoring Influencing Choice of Offshore Location ................................................................13
Global Offshoring Clusters.........................................................................................................13
Comparison among Global Offshore Centers ..........................................................................14
Karnataka’s Significance in Global Offshoring Industry .......................................................15
BANGALORE CLUSTER HISTORY & EVOLUTION OF DIAMOND.................................15
CLUSTER VALUE CHAIN & FIRM ECONOMICS.................................................................18
CLUSTER MAP & DIAMOND ANALYSIS................................................................................19
Factor Conditions – Strengths & Challenges............................................................................20
Context for Firm Strategy & Rivalry – Strengths & Challenges............................................21
Comparing Bangalore with other Indian Cities .......................................................................24
Related & Supporting Industries – Strengths & Challenges ..................................................24
Demand Conditions – Strengths & Challenges ........................................................................26
Institute(s) for Collaboration .....................................................................................................26
CLUSTER GOALS .........................................................................................................................27
CLUSTER CHALLENGES & RECOMMENDATIONS ...........................................................27
REFERENCES ................................................................................................................................30
Page 1INDIA
History & Political Outlook
Although India’s history goes back almost six thousand years (through many different societies and outside
invasions), their modern history began in 1947, when it declared its independence from the colonialist
British. Often referred to as the largest democracy in the world, India consists of 28 states and seven union
territories. The states and territories are remarkably diverse with varying economies, resources and regional
cultures. The political scene is dominated by numerous regional and national parties and in the last two
elections, federal governments were formed on the basis of coalition. The leading parties are the Indian
National Congress (which ruled from 1947 until the 1980s with populist and protectionist policies) and the
BJP (which represents Hindu nationalism). A key challenge with a coalition government at the central level
has been the difficulty in policy making and expediting reforms.
Economic & Social Development
The Indian economy represented a minimal fraction of the world’s production at the time of independence.
India's share of world income collapsed from 22.6% in 1700, almost equal to Europe's share of 23.3% at that
time, to as low as 3.8% in 1952.2 The country’s growth performance was mixed during the 1960s-1980s. In
1991 India started to reveal its growth potential when it implemented outward-looking economic
liberalization reforms that took place under the guidance of the IMF to address the balance of payments
crisis. Among the most significant reforms was the dismantling of the Raj, the government system of
regulations and excessive licensing that restricted business, and harnessed corruption and economic
stagnation. The government has opened up FDI limits in multiple sectors in a phased manner since 1991.
2
The World Economy: A Millenial Perspective, OECD 2001
Page 2Although it started from a low base, India has made progress in terms of its economic and social
development in the last decade. However, challenges remain. Real GDP growth averaged 7.86% during the
period 2003-2005, while the government and central bank (RBI) short-term projections are 7.5-8%. India’s
economy is now the fourth largest economy in the world with a US$ 3.8 trillion GDP PPP-adjusted. Social
indicators have improved significantly. The literacy rate doubled from one third in the 1980s to two thirds in
2004, while life expectancy increased from 50.4 years to 63.5 during the same period. However, poverty
levels only decreased from 45% to around 30%, a modest decline for the rapid economic growth India has
experienced. On the other hand, many economic reports suggest India can emerge as one of the key growth
engines in the global economy. The country’s emergence will coincide with the growth of what economists
refer to as the BRIC economies (Brazil, Russia, India, and China). Over the next forty years, it is estimated3
that the BRIC countries will surpass the G6 economies (US, Japan, Germany, France, Italy, UK) in terms of
GDP in US dollar terms. Also their total weight in the world economy is predicted to rise from 10% in 2004
to more than 20% in 2025. Below is a snapshot of the major development indicators of the BRIC countries:
Key economic and social ratios in the BRIC economies (2005 unless noted)
Brazil Russia India China
Nominal GDP (US$ bn at PPP) 1,557.7 1,552.1 3,824.3 8,226.2
Real GDP growth rate 2.3% 6.4% 8.5% 9.9%
Population growth 1.3% -0.4% 1.4% 0.6%
Real GDP/capita (PPP) in US$ 8,590 10,821 3,490 6,290
Inflation 6.9% 12.7% 4.2% 1.8%
Manufacturing Share/GDP 40% 35.2% 27.1% 46%
Fiscal Deficit/GDP -1.2% 7.5% -4.1% -1.5%
Trade Integration (2004) 39.5% 44.4% 32.6% 79.4%
Listed comp. capitalization. /GDP (2004) 54.7% 46.1% 56.1% 33.1%
Time required to start a business (days) 152 36 89 48
Life expectancy (years) (2004) 70.9 65.2 63.5 71.4
Gini Index (different years) 57.9 39.9 32.5 44.7
Unemployment rate 9.8% 7.6% 8.9% 9%
Literacy rate (2004) 89% 99% 61% 91%
Secondary School Enrollment (2003) 109% 92.9% 52.7% 70.2%
Telephone lines per 1,000 (2004) 230.4 255.8 40.7 241.0
High Tech. Exports (% manuf.exports) 11.6% 9.1% 4.1% 29.8%
Source: WDI Indicators, EIU.
3
The term BRIC economies were first used by Goldman Sachs.
Page 3The data above indicates that despite achieving higher growth than Brazil and Russia (but not China), India
lags significantly behind in areas such as infrastructure and educational attainment. The Chinese model
favored economic reforms under the strict interventionist government role before any political reforms.
China’s economic model tapped into the vast reservoirs of domestic savings and leveraged FDI to build a
huge manufacturing base. On the other hand, the Indian economic model results from low government
regulation in non-manufacturing industries,4 creating the path for emerging knowledge-based industries. In
addition, India invested considerable resources towards building democratic institutions: it will be interesting
to see if these efforts pay-off in the next few decades.
Among the structural drivers of Indian economic growth are the favorable demographics, its high-skilled
labor force, the rising integration with the world economy, and the stabilizing macroeconomic policies as
well as institutional framework improvements. India’s declining dependency ratio will result in a
demographic yield that entails a huge increase in labor supply that can be translated into high-growth
opportunities for India.
India has seen increased integration with the rest of the world. Trade as a percentage of GDP doubled from
15.7% in the 1980s to 32.6% in 2004, but still lags behind the rest of the BRIC economies. In this direction,
India has attracted less FDI compared to the other BRIC economies, especially China. Average FDI inflows
during 2001-2004 averaged US$4.1 billion in India versus US$53.4 billion in China. India has followed an
idiosyncratic pattern of development, certainly compared with other fast-growing Asian economies (IMF). In
terms of GDP decomposition, the Indian economy is primarily services-driven rather than manufacturing-
driven, with almost half of the GDP originating from services, and the rest from manufacturing and
agriculture.
4
Tarun Khanna, China and India: The race to growth. India's entrepreneurial advantage China has shackled its
independent businesspeople. India has empowered them. (McKinsey Quarterly)
Page 4Productivity Challenge
Due to more than forty years of protectionism, India’s labor and capital productivity lags behind other
emerging and developed nations. Although labor productivity growth in India is higher than in the advanced
economies, it needs to be stressed that its level in India remains quite low in many sectors.
For example, productivity per worker in India is only nine percent of the U.S. productivity level, while
China’s productivity level is fourteen percent. 5 However, with aggressive reforms, which are outlined under
“Recommendations”, India can catch up in terms of productivity, GDP, and per capita growth rates.
Legal: India has one of the oldest legal systems in the world. Despite an extensive network of legal and
judicial system, the enforcement of law in the business sphere remains low and this is reflected in the
corruption perception index. In innovation capacity, India lags behind, if the number of annual US patents
granted is used as an indicator, however India’s growth rate in this area is high. China is also in a similar
situation.
5
(Ark, Bart van 2005)
Page 5India - National Diamond
India is ranked 50th in this year’s Growth Competitive Index in the Global Competitiveness Report6 2005-
2006, which is five positions higher than last year. Although India has made progress in a lot of areas, it still
faces a series of challenges. Analyzing the national diamond and competitiveness rankings provides the
correct diagnosis and solutions for India’s growth dilemma.
Within factor conditions, India is significantly empowered by its vast and highly-skilled labor pool. India
ranks first in the availability of scientists and engineers in the workforce. The existence of good research
institutes and management schools (ranks 6th) has contributed to this success. In addition, the financial sector
reforms in the early 1990s have strengthened India’s banking sector and capital markets. (India ranks 1st in
terms of access to credit and 2nd in term of equity market access). On the other hand, increased socio-
economic disparities are encountered at the federal level fueled by state income inequality, the urban-rural
divide, and ethnic language diversity. Furthermore, despite the availability of scientists, literacy rates are
comparatively low (40% of the population is illiterate), and secondary and tertiary education enrollment is
low at 53% and 12% respectively (India ranks 91st out of 117). In addition, the lack of adequate
infrastructure has been identified as the major binding constraint to India’s growth, according to multiple
surveys including the World Economic Forum Executive Opinion survey (2005) and the World Bank
Investment Climate survey (2003). The status of infrastructure is very poor according to the competitive
rankings as well. (77th in overall quality of infrastructure). The extent of bureaucratic red tape (India ranks
60th) and excessive burden from government regulation (India ranks 76th) remains a serious problem for
India. Finally, one of the areas of government policy that needs special attention is the fiscal policy. India has
been running one of the biggest fiscal deficits in the world (10% of GDP, second only to Turkey) which is
creating anxiety among international investors because it is not sustainable in the long-term. Under Related
and Supporting Industries, has seen growth in the number of world class firms with growing global
6
World Economic Forum.
Page 6presence in IT services, pharmaceuticals, chemicals and engineering, with return on equities in excess of
20%. In addition, domestically focused firms have increased their competitiveness significantly and are
competing successfully with MNCs firms (in telecom, consumer products, media, automotive, etc.). At the
same time, global high-cap companies, but at the same time, a quarter of Fortune 500 companies have a
R&D unit in India which creates a strong R&D base. On the other hand, the economy stumbles on low levels
of innovation, evidenced by the low number of patents filed per capita, even though it has a number of strong
emerging global industries.
Although India’s Context for Firm Strategy and Rivalry has been improving, it is far from optimal. In
factors such as the sophistication of company operations, strategy, and technology, Indian companies do rank
favorably. The prevalence of foreign technology licensing, the companies’ R&D spending levels, and
technological readiness ratings are all very encouraging. However, these strengths are offset by low levels of
IP protection (India ranks 43rd) and favoritism in the decisions of government officials (India ranks 53rd).
INDIA NATIONAL DIAMOND
Strengths Weaknesses
(Rank /166) (Rank/166)
Demand Buyer sophistication (24); Capacity for innovation
Demanding regulatory standards (43)
Conditions (30); Financial Market Sophistication (31)
Access to credit (1); Local equity market access (2); Overall infrastructure quality (77); Extent of
Factor Quality of management schools (6); Quality of bureaucratic red tape (57); Quality of public schools
Conditions research institutes (17); Venture capital availability (82)
(24)
Favoritism in government decisions (51); Trade
Context for
Barriers (52); Intellectual property protection (42);
Firm Strategy Intensity of local competition (11)
Effectiveness of antitrust policy (32); Corporate
and Rivalry
Boards Efficacy (45)
Related and Local Supplier Quantity (5); Emerging world class
Supporting companies (Infosys, Dr. Reddy’s, Ranbaxy, Reliance, Local Supplier Quality (27)
Industries Tata group)
Page 7Possible Clusters with Export Potential: Given India’s diamond, the development and strengthening of the
following clusters is possible.
India – Possible Clusters
Natural Resources driven Capability driven
• Tourism
• Apparel • Offshore IT/ BPO
• Mineral resources related • Biopharmaceuticals
• Dairy and food processing • Automotive components
India - Objectives
India should set an objective to achieve 6-8% compounded annual growth rate for the next 20-40 years,
while increasing social and human development indicators. This is an uphill task, and will require significant
and quick improvements to the national diamond. Key recommendations include:
India - Policy Recommendations
Factor conditions: Physical Infrastructure assets: Power: Privatize electricity sector and all central and
state government-owned companies; in power, start by first privatizing distribution; in all other sectors
privatize the largest companies first. Airports: Privatization of airports and allowing FDI; Road: Separate
funding pool for roads, contracts to private firms and concept of toll roads; Civic amenities: increase taxes
and contract water project to private firms; Land: Resolve unclear real estate titles by setting up fast track
courts to settle disputes, computerizing land records, freeing all property from selling constraints, and
remove limits on property ownership. Human capital & social assets: Invest in primary education and basic
healthcare systems; Reform labor laws and allowing full flexibility in contract labor use. Context for firm
strategy and rivalry: Eliminate reservations for all products of small scale industry; start with 60+ sectors
accounting for 80 percent+ of the output of the reserved sectors; Equalize sales tax and excise duties for all
categories of players in each sector and strengthen reinforcement; Remove all licensing and quasi-licensing
restrictions that limit competition; Reduce import duties on all goods to comparable to the levels of
Southeast nations (10 per cent) over 5 years; Open multiple sectors for 100% FDI. Demand conditions:
Page 8Allow 100% FDI in retail to trigger consumer demand; Allow foreign banks to set up a rural banking
network for extending microfinance credit to trigger rural demand; Increase employment by providing
specific cluster specific training to high school students. Related and supporting industries: Focus on
building cluster specific competitiveness councils.
KARNATAKA
Highlights
Situated on the West coast of India, Karnataka is the eighth largest state, both in terms of area and
population. Although historically Karnataka had been primarily an agricultural state with rich natural
resources it is now more famous as an Information Technology and emerging Biotechnology hub. While
historically Karnataka’s GDP had a modest growth rate, more recently it has been one of the fastest growing
states in the country. Despite this growth the state continues to be extremely poor. A substantial part of the
state economy is still agricultural driven which depends on natural sources of irrigation in the absence of
required infrastructural set-up. While Karnataka has a lot of favorable factor and specific demand conditions,
there is still considerable ground that the government needs to cover in terms of implementing policies that
promote focused infrastructure development in order to drive sustainable growth for the state. Karnataka’s
political performance has been mixed, in terms of government stability.
Economic and Social Performance
As mentioned above, Karnataka has been one of the fastest growing Indian states with the state GDP
increasing from 5.3% in the ‘80s (below national average) to 7.3% in the ‘90s (second highest among all
states) to 8.3% in the late ‘90s (highest among all states). The growth in the late ‘90s was driven primarily
by explosive growth in the industrial and service sectors, growing at 9.2% and 10.6% respectively. Relative
to this, the agricultural sector continued to display modest growth of 4%. The agricultural sector growth was
Page 9due to diversification and increased productivity. Rapid expansion in manufacturing led to industrial growth.
Services grew across categories, led by exports. Services were also the major contributor to the GDP
constituting 50%, whereas the remaining portion was equally split between agriculture and industry. This
overall growth was assisted by foreign investment. In fact, Karnataka was the third largest FDI recipient
among Indian states, and the highest on a per capita income basis. The explosive growth in the late ‘90s
moderated somewhat by the turn of the century. The GDP growth slowed down substantially between 2001
and 2003 due to severe drought conditions and the absence of substantial artificial irrigation and other
infrastructural facilities. While the agricultural sector contributes approximately 25% of the state’s GDP, it
employs a disproportionate 65% of the population. This coupled with the high rain dependence of agriculture
leads to very high poverty levels in the state. Poverty levels in Karnataka were 25.1% (Deaton-Dreze
adjusted poverty estimates) in 1999-2000 compared to the national average of 22.7%. In conjunction,
Karnataka’s human development indicators continue to lag other comparable states in the region.
Karnataka Diamond – Strengths and Weaknesses
Strengths Weaknesses/ Challenges
• Strong human capital base:10% of India’s
graduate capacity - 134 engineering, 133 medical
• Weak basic infrastructure (road,
and 712 general colleges (mostly private)
rail, airports)
Factor • Immense natural resources:
• No effort to direct talent to focus
Conditions o 90% of India’s gold production
sectors
o Leading producer of limestone, iron-ore
• Weak social indicators
o 70% of India’s coffee production
o 70% of silk production
Demand • Leading and sophisticated coffee demand • Weak domestic demand in other
Conditions • Leading and sophisticated silk clothing demand sectors
Page 10• No targeted policies for focused
Context for
sector development
Firm Strategy
• Focused IT policy since 1991 • Rigid land policies
& Rivalry
• Inefficient State enterprises
• Heavy engineering (state owned & private)
Related and • Information technology
• No machinery equipment industry
Supporting • Biopharmaceuticals
for agro-processing, silk
Industries • 103 R&D centers in Bangalore (Indian firms &
MNCs)
Karnataka – Possible Clusters
Natural Resources driven Capability driven
• Coffee (and food processing) • Offshore IT/ BPO
• Silk clothing • Biopharmaceuticals
• Mineral based industry • Engineering
• Tourism • Automotive components
• Gold Jewellery
Karnataka - Policy Recommendations
While Karnataka registered impressive growth in the recent past, it is still vulnerable to agricultural
fluctuations. In addition, the state policies continue to be generic and unfocused. Thus, the state government
needs to design cluster-oriented development policies that create scale and sustainability in agriculture and
drive focused growth, leveraging the inherent strengths of the state. In particular, the state should focus on
silk and coffee production and market and brand creation.
Factor Inputs: Karnataka already accounts for about 70% of both India’s silk and coffee production. In
addition, it has the skilled manpower needed to create efficient product, market and brand development in
each of these industries. Thus, the key for the state is to special programs in educational institutes and create
incentives for graduates to pursue opportunities in these sectors. In addition, the government will need to
lead and funnel FDI in upgrading general infrastructure that will assist further development in these
traditional sectors. Demand Conditions: The state already has leading and sophisticated coffee and silk
demand. The objectives should be two-fold: to further drive demand and to focus policies for these sectors
rather than trying to cultivate demand across multiple sectors simultaneously. The state government can
drive demand by liberalizing land and labor rules to aid growth of the retail sector, and to assist microfinance
Page 11institutions to help trigger rural demand. Context of Firm Strategy and Rivalry: Not realizing Karnataka’s
inherent advantage in coffee and silk, both in terms of availability and demand, the government has
neglected policies to create these clusters in the state. Thus, the government needs to provide incentives for
businesses to prosper in both these sectors, and to attract FDI particularly for these sectors. Additionally, the
government should develop a plan for fast track privatization of the inefficient state owned enterprises in
these sectors to create a more efficient, competitive and attractive industry in the state. Related and
Supporting Industries: While there are strong heavy machinery and IT industries in the state, these do not
contribute to automating the state’s silk or coffee industries. Thus, the government needs to provide
incentives to create agro- and silk-processing automations, and attract foreign players to assist automating
these sectors. Institutes for Collaboration: Similar to NASSCOM (as will be discussed in the next section),
which is a successful IFC in offshore IT/BPO, additional IFCs and cluster competitiveness councils should
be formed for public-private partnerships for each of the possible clusters in Karnataka.
KARNATAKA - OFFSHORE IT & BPO CLUSTER ANALYSIS
Description of Outsourcing – onshore and offshore
Outsourcing: The guiding principle of outsourcing is the transfer of process, which is typically not a core
competence of an enterprise, to another organization that has expertise, scale economies and learning curve
effects. The two broad models of outsourcing are onshore and offshore.
Global Market Size
Worldwide outsourcing & offshoring industry: The total market in 2005, for outsourcing services was
approximately $535 billion and the break-up between IT and BPO was $400 billion and $135 billion
respectively. Out of this, the Offshoring potential was $ 210 billion7 but the current penetration is between
13-16%, and hence the industry is expected to grow at double digit rates in the next few years.
7
Interview with a outsourcing consulting firm, Everest group
Page 12Offshoring Potential and Current Size – (USD billion)
USD billion Global Offshoring Potential Current Size Current Size as % of Potential
IT Services 120 19 15.8%
BPO 90 12 13.3%
Total 210 31
Factoring Influencing Choice of Offshore Location
Factor conditions that matter are suitable and quality talent available at a low-cost, a sound educational
system for continuous labor supply, physical and time zone displacement, cultural compatibility with
onshore location, and language proficiency. Also, relevant and low cost basic and business infrastructure is a
key decision making factor. Context for firm strategy and rivalry that matters most is a competitive
environment resulting in process efficiencies, high quality standards, and process maturity. In addition,
supportive and favorable government policies, geopolitical environment, and IP protection laws make a
particular location much more competitive. Related and supporting industries include telecommunications
infrastructure with high bandwidth and competitive costs, business services like consultants, training firms,
legal services and customized hi-tech office space for scaling up the business in a particular location. Strong
local demand adds to the competitiveness of a location as firms can market their services locally.
Global Offshoring Clusters
As the map below shows, there are more than ten different off shoring locations around the globe. The
strength of the cluster diamond varies across these locations. India has the leading market share, with
approximately 60% share in IT and more than 40% share in BPO.
Page 13Overview of Key Offshore Locations
3
Comparison among Global Offshore Centers
Based on the factors influencing choice of offshore location, the project team analyzed multiple locations
using competitiveness data from various sources8. India scores high and offers a stronger diamond for an
offshore location; however threats from other locations are increasing.
INDIAN IS THE PREFERRED OFFSHORE DESTINATION
BUT OTHERS ARE CATCHING UP
Context for
Factor Demand firm strategy Related
Location conditions* conditions* and rivalry* industries*
India 9 6 9 8
Poland 6 4 5 5
Mexico 7 5 5 5
Ireland 8 7 7 7
China 7 6 5 5
Philippines 8 5 7 6
* On a scale of 10
Source: Team analysis of competitiveness data from various reports – Neo IT, NASSCOM 1
8
NeoIT, Nasscom, other IFCs, country websites
Page 14Karnataka’s Significance in Global Offshoring Industry
Global epicenter of offshore cluster – Bangalore, capital city of Karnataka: Bangalore has a huge
concentration of offshore IT/BPO related activity, accounting for 37% of exports from India in 2005.
Bangalore is the capital city of the state of Karnataka. It is India’s fifth largest city, and home to over 6
million people and it often referred to as the "Silicon Valley of India".
Cluster in the context of Karnataka economy: The IT/BPO cluster be an important part of the overall GDP
(approx. 20% of state GDP by 2010) and potentially create 2.7 million direct and indirect jobs by 20109,
which would contribute to urban city growth but have a minimal impact on rural Karnataka. Most of the
indirect jobs will be created in construction, hospitality, retail and transport.
BANGALORE CLUSTER HISTORY & EVOLUTION OF DIAMOND
Bangalore's rise to a recognized offshore technology center is no accident. In 1947, after India won
independence, India’s prime minister, Jawaharlal Nehru, designated Bangalore as country's intellectual
capital city. The government made Bangalore the headquarters for its aerospace company and defense
research labs. This was a strategic defense reason. First, it was far from the Indo-Pak border compared to
other metropolitan cities like Delhi and Mumbai. Second, Bangalore has a history of having a strong Army
base for South India, since the British Raj, which made it a compelling location to do research co-ordination
with Army professionals. The offshore IT industry requires skilled trained engineers, whereas BPO requires
English speaking graduates from any discipline. Both these talent types are in abundant supply at low cost in
Karnataka due to historical reasons.
Talent supply – 170+ years of history: Skilled engineering and managerial talent – supply for IT services:
As part of Jawahar Lal Nehru’s (India’s first prime minister) vision of a self-sustained India, he played a key
9
NASSCOM Strategic Review 2005
Page 15role in building a lot of engineering and managerial institutes in 1950s and 1960s to provide a large supply of
engineers for the industrial plans and import substitution model of development.
Graduates: In the BPO space, India has an edge because of decent quality English speaking people who are
willing to do routine work at a highly competitive price. This is a consequence of India’s McCaulay System
of Education, which is over 170 years old. As Karnataka was an important city under the British Raj and
post-independence, it received a large share of educational institutes throughout its history.
McCaulay’s education system: Thomas Babington McCaulay (1800-1859) was posted in India under
Governor General Bentick and he laid the foundation for the Indian educational system. McCaulay outlined
an educational system designed to train people who understood the English language and the British systems,
so that they could fill the staff positions. Another important perspective about McCaulay education was that
it churned out disciplined, obedient and productive staff for British government offices. This characteristic of
the system has given India the talent needed to be a preferred choice for off shoring work. A pitfall of
McCaulay system is that it doesn’t encourage the challenging of ideas, and creative thinking. This partly
explains why India’s education system has low “creativity” which makes it difficult to increase the
innovation capacity.
1970s - Nationalization and demand creation for local firms: The roots of the successful development of an
IT industry in India go back to the late 1970s, when fearing nationalization, companies such as IBM pulled
out, leaving the country with a small tech infrastructure but no one to maintain it. Since most of the
infrastructure was in research institutions in Bangalore, it gave an edge to Bangalore based entrepreneurs to
start firms to service this IT infrastructure.
1970s - License Raj regime – favorable for entrepreneurship in IT services: Under the protectionist
License Raj regime, it was extremely difficult to start a manufacturing business, since time-consuming
factory approval was needed from the government (even to manufacture safety pins). However, for the IT
Page 16services industry, government did not have many restrictions and it was much easier to set up a business.
Hence, when IBMs and others left, many local entrepreneurs jumped to start a business in this sector.
1980s - Initial Champions – TI & GE: Early 1980s - Texas Instruments (TI) – seeding the capability roots
in Bangalore10: During the 1970s, TI had Hindustan Aeronautics Limited (HAL) in Bangalore as a customer.
During their visits, TI established alliances with Indian Institute of Science in Bangalore for research on
embedded software. Having evaluated the capability of technical talent in India, TI was the first to establish
their offshore center in 1984 in Bangalore, thus giving credibility to the location.
Late 1980s - General Electric: The genesis of the GE story11 for Indian cluster lies in a breakfast meeting the
then Chairman of GE, Jack Welch, had in September 1989 with an Indian delegation including the Prime
Minister, Rajiv Gandhi. Welch had actually come to sell airplane engines and medical instruments in India,
but the Indian delegation proposed that GE buy software from India since the country needed business for its
sector. Looking to cut costs, Jack Welch took the idea forward. It became the pioneer in starting the
outsourcing revolution in India. The main result was the long-term learning GE imparted to Indian
companies. It was the trio of Wipro, Infosys, and TCS12 who were the initial beneficiaries. GE gave Indian
companies access to all their training methodologies, both technical and managerial. The initial projects
mainly involved mainframes that required knowledge transfer and training since India was not a mainframe
country. Also, by pitting one Indian firm against another in order to drive down costs, GE played a key role
in increasing the competitiveness and productivity of the cluster.
Late 1990s - Inflexion point in demand – the Y2K urgency: The next major event that eventually led to the
growth of offshoring was the Y2K phenomenon. Fearing the collapse of major computer systems as the new
millennium dawned; there was a huge demand for technologists to help update systems quickly. Indian firms
figured out to meet this demand and the whole industry took off in India.
10
Interviews with early active investors in the Indian IT Sector – CVC International
11
Jay Solomon article
12
Tata Consultancy Services
Page 17CLUSTER VALUE CHAIN & FIRM ECONOMICS
The value chain activities of a Bangalore based offshore IT/BPO player have been laid out and the offshore
locations activities which are performed in Bangalore (offshore location) are in bold. The key advantage
offshore players have created is internal and external consistency in their value chain activities to build a low
cost global delivery model.
Key activities in value chain of offshore IT/BPO
Finance and accounting operations
Quality management
Internal IT operations
Contract and risk management M
HR administrative operations a
r
g
Recruitment & Training Sales & account management i
Low cost technical talent
n
People planning and utilization Requirements planning, solution design, pricing and
Telecom equipment negotiation
Facility planning and management Project management and solution delivery
High Tech office space
Mix of on-site and off-site resource allocation Invoicing, collections and servicing
Technology Hardware &
Software
Input Resource Customer Interaction &
Requirements Management Solution Delivery
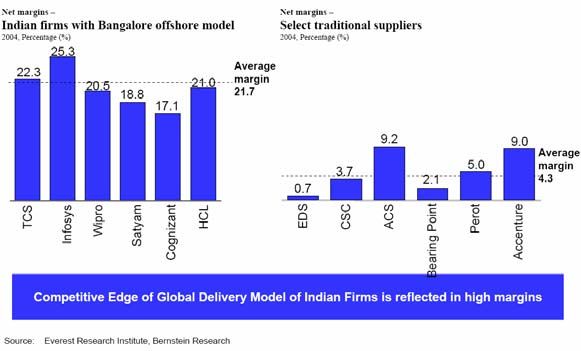
Comparing the profitability of leading Indian firms (headquarted / strong base in Bangalore) with leading
global firms establishes the fact that a global delivery model with the right activities in the offshore location
is a necessity for players.
Page 18Typical cluster firms and their activities: Infosys (IT services), is the leading Indian IT services company
with activities spanning the entire value chain from application development, package implementation to
customized IT solutions. Accenture (IT services) currently has more than 5000 programmers in India and is
an integral part of its network of 20 global Development Centers. It conducts various activities including
software development and other technology innovation. Genpact (BPO), is one of the first movers and the
largest BPO firms in India focusing on call center, mortgage and insurance claims processing and bill
payment. Convergys (BPO), the US outsourcing giant, has built a call center business in India to provide
integrated billing and customer care solutions to primarily wireless service providers in the US. Honeywell
(R&D) has a 400 person offshore development center focused on developing avionics and industrial control
software. Samsung (R&D) set up a development center in India with 200 engineers to work on software
applications around network management, computer telephony and network printing solutions
CLUSTER MAP & DIAMOND ANALYSIS
After examining cluster development history, it is important to evaluate the cluster strengths and weaknesses
as of today, its future potential, challenges, and policy recommendations for various participants. The key
characteristics that emerge are (1) Strong factor condition in human talent, (2) Strong Context for Firm
Strategy & Rivalry, (3) Emerging Related & Supporting industries to help cluster improvement, (4) Weak
domestic demand. Each of these diamond forces have been explored in detail below.
Page 19Factor Conditions – Strengths & Challenges
Quality, abundance and cost of talent: Karnataka has abundant talent supply compared to other low-cost
locations for off shore IT and BPO. India has 28%13 of global skilled talent with Karnataka having
approximately 25-30% of India’s skilled talent for offshore work. Also, Nasscom research suggests that
more than 25% of engineers in Karnataka have the basic skill for offshore IT jobs, compared to 10% each in
China and Russia. A key concern over the last couple of years has been the steep increases in wages, with
12%+CAGR for last 3 years (Nasscom). If this trend continues, without corresponding increase in
productivity, then India’s advantage gap will close with other offshore locations. Bangalore has a presence of
advanced scientific institutions, due to post-independence government policy of locating research work in
Bangalore, which help in providing talent for high end research work. There is a strong Indian diaspora in
the software, technology and research industries as well as in the management industry. A significant portion
of the diaspora is originally from South India, including state of Karnataka. This has created informal
13
Nasscom 2005
Page 20networks between Indians in the USA and in India. A few data points14 demonstrate the diaspora’s strength:
aapproximately 36% of NASA scientists, 34% of Microsoft employees, 28% of IBM employees, 17% of
Intel scientists, and 13% of Xerox employees etc.
Physical infrastructure: Karnataka still has weak basic and business infrastructure, and hence the firms
themselves had to find solutions for these problems. Historically, it did not matter much, as India had first
mover advantage. But, with multiple clusters emerging across the globe, it is imperative to have adequate
basic infrastructure to attract business investments from both Indian and MNC firms.
Summary of Key Factor Conditions
Strengths Weaknesses & Challenges
• Rising wages
• Currently, advantage due to • Low penetration of relevant skills in the existing
history of English & technical educated workforce
education • University “curriculum” needs modification & up
Talent
• Adequate supply of relevant gradation
(Human
Resources)
talent for the next 2-3 years • Lack of “innovation” orientation in Indian
• Presence of scientific research educational system, except very few institutes
institutions (IITs, IISc, DRDO, (result of McCaulay educational system)
ISRO) • Shortfall expected as per current supply conditions,
if India aspires to maintain market share
• Private firms demonstrated • Weak relevant basic infrastructure – didn’t matter
Basic
ability to build captive in past due to first mover advantage, but will matter
Infrastructure
infrastructure in the past in future
• 24 * 7 model for U.S. market • Lower ability to hire / retain talent in night shifts
Location
given time zone difference (for (for real-time work) due to competing
Attractiveness
non-real time work) opportunities in other sectors
Cultural • High with USA, UK given • Low with Japan, Europe, which are rapidly
Compatibility English language, movies etc. expanding offshore markets
• Willingness to move back to India due to poor
Indian Diaspora • Strong diaspora in the USA
infrastructure
Context for Firm Strategy & Rivalry – Strengths & Challenges
Intense competition: Because of government policy for 100% FDI under automatic route, and no restrictions
for local firms, competition among firms from Bangalore is intense. Currently, there are more than 200+
software development firms (Indian and MNCs) in the city of Bangalore alone, and such intensity of
competition and proximity of firms, helped build lot of strengths in the cluster – such as: informal networks
across firms and a pool of managerial and technical talent.
14
www.vepachedu.org/manasanskriti
Page 21High software quality standards: The multiple forces of the diamond working in a synchronous fashion in
the India cluster had an impact on the competitiveness of the location. A key assessment of competitiveness
is high quality at low cost. Bangalore cluster scores high on this parameter as it is evident through the fact
that more than 70 of the World’s 117 SEI CMM15 Level-5 companies are based in Bangalore. However, a
key concern is extremely low productivity in software products - if Bangalore intends to move up the value
chain, then this issue must be addressed. In addition, other offshore locations are taking advantage of low
costs and are increasing their productivity to close the gap with India.
Presence of leading MNCs in India: The big 5 consulting firms and multiple other global software firms
have established their Indian offshore delivery centers. The presence of such firms builds best practices in
the cluster, as managerial talent moves around and informal networks are formed.
Venture capital activity: Due to government regulations and active capital markets (for exits), India has been
able to developed strong activity in the venture capital industry. This has played an important role in
fostering entrepreneurship and innovation. For example, many successful IT firms have raised money from
venture capitalists in the early phases of their expansion (examples include: I-Flex, Rediff, Polaris, Satyam).
15
A global index, indicative of process quality in software industry
Page 22Role of Central Government: India’s central government has shown commitment to the growth of this
cluster. From 2001 onwards, the annual government budget has contained financial and investment
incentives to support these industries. In the last budget, the announcement of the Special Economic Zone
(SEZ) policy is aimed at boosting economic growth in IT and BPO, among other clusters.
Role State Government – Focused IT policy: Karnataka government has played a proactive role in creating
favorable state level cluster specific policies.
Software Technology Parks of India (STPIs): Karnataka state (working with central government) was the
first Indian state to set up a STPI unit in 1991. The creation of Software Technology Parks enabled focused
deregulation and incentives – such as tax incentives, plug-and-play infrastructure, streamlined approvals, and
exemption from restrictive foreign exchange and excise provisions. STPIs provide high-speed data
communication services, incubation facilities, financial incentives, concessions, and procedural waivers.
Land allocation: Since land is a state level subject, the government has come up with innovative policies and
incentives to attract investment from firms. Labor Laws: Labor laws have been amended to allow 24/7
operations and labor-related procedures have been simplified, e.g. exemptions to maintain specific registers.
IP protection: Karnataka government took steps to strengthen intellectual property protection and as part of
IT policy, it is laying out data protection and privacy laws.
Summary of Key CFS&R
Strengths Weaknesses & Challenges
• 100% FDI on automatic route
Investment &
• Tax exemption until 2009; Steep tariff reduction;
Financial • Loss of fiscal revenue for government
Excise exemption in hardware imports; Limited
Incentives
exchange rate restrictions
• STPIs - cluster specific export processing zone
• Weak IP protection laws and
Government • Liberalizing overseas investments by Indian firms
enforcement (though improving)
Policies • One-stop contact point for foreign investors
• Information Security concerns
• Labor laws modification, specific to cluster
• Productivity gap closing with other
• Removal of License Raj in 1991 fostering intense
offshore cluster locations
competition
Competition • Low “innovative” capacity of Indian
• Venture capital availability to foster small firm growth
Climate cluster
• Presence of captive centers of Fortune 1000, bringing
• “Undifferentiated” business models of
best practices
Indian firms
Business • Lags behind Ireland; other locations
• Currently, well positioned compared to other locations
Environment upgrading fast
Page 23Comparing Bangalore with other Indian Cities
Bangalore has the first mover advantage and is currently India’s leading offshore city. The project team
analyzed multiple Indian locations using competitiveness data from various sources and concluded that
Bangalore has been losing incremental market share to these cities and it is challenge for Karnataka to retain
its lead other. It is because other states/cities are designing policies to attract investments.
BANGALORE - LEADING OFFSHORING DESTINATION IN INDIA
OTHER CITIES ARE CATCHING UP
Size of the circle indicates
total revenues
Bangalore
Overall
Location competitiveness
Mumbai
Location advantage
Bangalore 9.5
NCR
NCR 9 Hyderabad
Mumbai 8 Chennai
Pune
Hyderabad 8
Chennai 8.5
Pune 7.5
Factor advantage
* On a scale of 10
Source: Team analysis of competitiveness data from various reports – Neo IT, NASSCOM 2
Related & Supporting Industries – Strengths & Challenges
Telecommunications infrastructure: Bandwidth requirement and telecommunication costs are critical for
this cluster. The central government’s deregulation of the sector has really helped Indian IT/BPO cluster.
Due to intensive competition in the telecommunication sector, India’s submarine cable capacity has grown
from 31 Gbps in 2001 to 541Gbps by the end of 2004 – a 17 fold increase in three years.
Business infrastructure: The IT/BPO cluster needs customized Hi-Tech office space and it needs to meet the
requirement of Fortune 500 firms in terms of security, accessibility and quality standards. Bangalore has a
well developed network of specialized real estate development firms, which are able to erect high-tech office
space with a fast turnaround. However, with 1 million new direct jobs expected in the state of Karnataka
over the next few years, and 100 sq ft / person, the state would need 100 million sq ft of hi-tech office space
in the next 4-5 years. With the current capacity around 25-30 million sq ft, considerable State government
Page 24support is needed in terms of land reforms to meet this urgent need. Hardware requirements: Bangalore has
sales offices of global hardware and software product vendors like Sun Microsystems, Oracle, Microsoft, etc.
to help the cluster firms meet the key input requirements with state of the art equipment. Business services:
This cluster needs a set of specific services, which are briefly described below:
Training firms: Since, the Indian university curriculum does not directly train for this cluster, it is important
for the cluster to give industry-specific training. The Indian cluster has developed multiple successful
training firms like NIIT, Aptech computer and many others. Travel services: Given India’s non-existent and
poor public transport infrastructure, local taxi service providers have developed customized solutions for the
cluster. Private security: Given the low level of security reliance on local police, ex-Army officials have
taken government approvals to set private security agencies for cluster offices and other activities.
Management consultants: Key consulting firms such as McKinsey have played a main role in assisting India-
centric firms on strategy of global knowledge about Fortune 1000 firms. Others: Other specific cluster
specific service providers include legal consultants, marketing agencies and international foreign exchange
and travel services.
Summary of Cluster R&SI
Strengths Weaknesses & Challenges
Telecommunication • Telecom sector deregulation helped in
• Further reforms needed
Services competitive telecommunication costs
• Significant & integrated Greenfield
• Rapid addition of customized
development needed, if India has to
commercial office space
Business Infrastructure achieved projected growth rates
• Presence of cluster specific experienced
• Land reforms needed, as it is a state
commercial real-estate developers
level subject
• Presence of cluster specific training
firms, private security, travel & foreign • Increased sophistication needed from
Business Services exchange services; management & off all service provides, if India has to move
shoring consultants; legal services; up the value-chain
marketing agencies;
• Semiconductor - Intel’s $1bn investment
commitment
• Very small percentage of global high-
Leading Technology • Software Products - Microsoft $1bn
tech work done out of India
Firms investment commitment
• Lack of Indian role model firms
• Hardware - Cisco’s $1bn investment
commitment
Page 25Demand Conditions – Strengths & Challenges
Over the last three years, the average local demand has been 15-20% of exports. Demand for IT related
services from government, corporations and consumers is currently low but growing rapidly. In the long run,
having sophisticated local demand is key for cluster improvement and enabling firms to move up the value
chain.
Summary of Cluster Demand Conditions
Strengths Weaknesses & Challenges
• Very small size local demand
• Lack of sophistication in local
• Growing local demand
demand
Demand • First mover advantage in building close
• Need to further strengthen & broaden
relationships with Fortune 1000+ firms
Fortune 1000 relationships (to identify
“lead” demand)
Institute(s) for Collaboration
NASSCOM – the leading apex body: NASSCOM is India's National Association of Software and Service
Companies, the premier trade body and the chamber of commerce of the IT software and services industry in
India. NASSCOM is a global trade body with over 950 members, of which over 150 are global companies
from the US, UK, EU, Japan and China. NASSCOM is a great example of a successful IFC, which has
played an anchor role in developing all the four corners of the diamond model. The efforts were always
integrated to impact the entire diamond and had a very high level of involvement from business leaders.
Exemplary leadership: Late Dewang Mehta was an exemplary leader at NASSCOM. He demonstrated
unmatched resilience and energy to explore every possible democratic process to find his way around
bottlenecks. A key challenge is whether the new leadership at NASSCOM can replicate Dewang Mehta’s
leadership and live up to the high standard set by him. Other IFCs are playing a key role as well. Another
prominent one is TiE (The Indus Entrepreneurs), which focuses on entrepreneurship and strengthens ties
with Silicon Valley diaspora.
Page 26CLUSTER GOALS
Short-term Goals: To maintain and increase market shares in offshore IT/BPO business lines vis-à-vis other
offshore locations. Long-term Vision: To upgrade in terms of innovation capacity and higher value added
activity, by increasing productivity.
CLUSTER CHALLENGES & RECOMMENDATIONS
Through primary interviews with industry leaders, it is apparent that Bangalore is a well established
offshore center but is seeing threats from other offshore locations within India and from other countries,
especially in the 2-4 year timeframe. Key recommendations to counter the competitive threat and achieve the
goals by upgrading the diamond are outlined below
Factor Inputs
Increase supply and quality of cluster specific human talent: Private sector needs to set up more 1-2 year
training programs for high school students (for BPO) and engineering students (for IT) to increase the supply
in the medium term to tackle the pressure on wage increases. The focus should be to increase the penetration
of engineers having relevant cluster specific talent from 25% to upwards of 35%. Also, these institutes
should add training programs for higher-end job content, like embedded software, software product and
hardware design. This would help in strengthening the higher-end of the value chain activities, increasing the
productivity and thus giving Bangalore-based firms and opportunity to move up the value chain. The
government needs to add supply at middle and high school levels and encourage students in tier II-III cities
to purse education until high school. In addition, more engineering colleges need to be added and a key
bottleneck if faculty. Government should increase the salaries for faculty to attract talent towards the
educational field. Innovation orientation should be increased by asking the private sector to give projects as
part of the curriculum (in higher education institutions around Bangalore). Basic infrastructure in specific
cities: Power, land, and civic amenities is a state level subject and the Karnataka government should
Page 27You can also read