Microsoft Academic Search and Google Scholar Citations: A comparative analysis of author profiles
←
→
Page content transcription
If your browser does not render page correctly, please read the page content below
Microsoft Academic Search and Google Scholar Citations

Microsoft Academic Search and Google Scholar Citations: A
comparative analysis of author profiles

José Luis Ortega 1
VICYT-CSIC, Serrano, 113 28006 Madrid, Spain, jortega@orgc.csic.es

Isidro F. Aguillo
Cybermetrics Lab, CCHS-CSIC, Albasanz, 26-28 28037 Madrid, Spain,
isidro.aguillo@cchs.csic.es

Abstract
This paper aims to make a comparative analysis between the personal profiling
capabilities of the two most important free citation-based academic search engines,
namely Microsoft Academic Search (MAS) and Google Scholar Citations (GSC).
Author profiles can be very useful for evaluation purposes once the advantages and the
shortcomings of these services are described and taken into consideration. A total of
771 personal profiles appearing in both the MAS and the GSC databases are analysed.
Results show that the GSC profiles include more documents and citations than those in
MAS, but with a strong bias towards the Information and Computing sciences, while the
MAS profiles are disciplinarily better balanced. MAS shows technical problems such as
a higher number of duplicated profiles and a lower updating rate than GSC. It is
concluded that both services could be used for evaluation proposes only if they are
applied along with other citation indexes as a way to supplement that information.

Keywords: Microsoft Academic Search; Google Scholar Citations; Web
bibliometrics; Academic profiles; Research evaluation; Search engines

Introduction
In November 2009, Microsoft Research Asia started a new web search service
specialized in scientific information. Even though Google (Google Scholar) already
introduced an academic search engine in 2004, the proposal of Microsoft Academic
Search (MAS) went beyond a mere document retrieval service that counts citations. It
automatically provided the bibliographic records grouped by authors, journals,
institutions or research disciplines, that although with a limited quality control it is
enough for being considered for research evaluation and scientific benchmarking. Given
the limitations in the control of identifiers, the most interesting feature was that the
whole search service relies on self-edited personal profiles. That means that they can be
updated, modified or merged, after approval, by the researchers themselves. This allows
the scientists to boast a public, qualitatively controlled and accessible curriculum to
spread their research activities and overall performance. At the very beginning, this
service was beta-tested with databases covering Computer Science disciplines only, but
since March 2011 it became multidisciplinary with agreement with different sources
providers.

1
    VICYT-CSIC, Serrano, 113, 28006, Madrid, Spain, jortega@orgc.csic.es

                                                   1
Microsoft Academic Search and Google Scholar Citations
At the same time, Google launched Google Scholar Citations (GSC) (Google Scholar
blog, 2011a; 2011b), as response to Microsoft’s initiative (Fenner, 2011). Google
Scholar (GS) is considered the largest academic search engine which harvests not only
scientific papers available on the Web through repositories, publisher platforms and
personal web pages, but also other academic materials, court opinions and patents. GSC
provides facilitates for exporting the bibliographic records that is very useful for
building personal homepage with the bibliographic and bibliometric information
gathered by GS: list of publications, names of the co-authors, subject labels and
bibliometric indicators like the h-index. Contrarily to MAS, each profile should be
voluntarily self-created and self-edited by the author using a Google personal account,
selecting his/her own references, choosing his/her partners and choosing the labels that
better describe his/her fields of interest in a free natural language. Thus, while MAS
adopts a restricted model in which the researchers only can suggest changes or merges
in their automatically supplied profiles, the GSC model grants to the users the complete
ownership of their profiles, with full capabilities for editing and modifying them freely.
Regarding traditional databases used for research analysis and evaluation (Web of
Science and Scopus), both MAS and GSC profilers introduce several innovations that
specially suited for research assessment and other scientometric studies. Contrary to
WoS and Scopus, the two services are access free, which means they can reach wider
and larger audiences, both in the academia and outside, that it is particularly welcomed
in developing countries. The second innovation is that these new services are focused
on the author as main unit, instead of the journal, easing the way to the Science 2.0
functionalities and Web 2.0 tools such as the social networks (Waldrop, 2008). The
improvement in the (self-)standardization of names, the availability of unique global
identifiers for the authors, the exporting capabilities and the new generation indicators
provided are going to significantly enhance the scientist research evaluation, facilitating
also the incorporation (through ImpactStory, for example) of new research measures
related with social networking and web performance such as altmetrics’ indicators
(Priem, Piwowar & Hemminger, 2011). A third interesting aspect is that both search
engines are using completely different databases than the WoS and Scopus for
extracting and compiling their records and indicators, offering for performing citation
analysis a new scenario that has probably a limited overlap with the other traditional
sources. However, feasibility is hampered by several technical issues that due to the
novelty of the products are not still completely fixed. Those shortcomings include a
high number of duplicated profiles (due to mistakes in the names or affiliations and
inter-institutional mobility) and records (not showing the full count of received citations
distributed along different entries), that mostly are explained because the high number
and formats diversity of the different sources these services use for build their
databases. The open capabilities for external editing can be also being used to
manipulate the data (Delgado Lopez-Cozar, Robinson-Garcia & Torres-Salinas, 2012),
although MAS requires a previous approval of changes and GSC penalizes the unethical
behaviour.
These profiling capabilities are similar in MAS and GSC, and they are more developed
than in the traditional bibliographic databases, so we will focus on them excluding both
WoS and Scopus, already extensively discussed by other authors. The new services are
a serious alternative to the traditional bibliographic databases, in coverage and access
terms (Thomson Reuters, 2012; Wikipedia, 2013; Scopus, 2013). Their commercial
strategy regarding the provision of aggregated indicators has changed in the last years,
but the quantitative measurements plays a central role in both services, with GSC
providing h-index family indicators while MAS is more focused on different usages of
2Microsoft Academic Search and Google Scholar Citations
citations. The indicators are not only incorporated to the profiles but they are used to
build rankings at different levels of aggregation. In this way, it is possible to use these
tool not only for micro level (author) research evaluation but also at meso or macro
level (journals, institutions, disciplines). Furthermore, GSC is by far the largest platform
currently available as it provides additional research materials from usually neglected or
poor-covered fields or from not so formally published documents that are deposited in
subject or institutional repositories.
Main justification for this paper is this the first time a comparative analysis of the data
provided by the profiling capabilities of the free citation databases is performed.
Related Research
There are no previous studies comparing MAS and GSC from the point of view of the
implications for research evaluation of their end-user friendly academic profiling
systems and data. Due to this, this literature review presents the most relevant papers
that have studied both search engines from a research evaluation view.
Several papers have used Google Scholar (GS) as data source because of its large
coverage not only of the main scientific peer-review journals and preprints from open
access repositories, but also from obscure or not so formally published scientific
documents such as popularization papers, conferences presentations or learning
supporting materials. Most of these studies analysed the citation coverage of GS in
relation to the major scientific citation databases. Bakkalbasi et al. (2006) studied the
coverage of GS, Scopus and Web of Science (WoS) in two research disciplines, finding
that GS was the source that most new citations contributed, being an important
complementary citation index to the traditional ones. In the same line, Meho and Yang
(2007) observed that GS is a supporting source to WoS and Scopus because it contains
citations from conference proceedings, non-English international journals and other
academic materials, which would enrich the research evaluation, evidencing a broader
international impact. Harzing and Van der Wal (2008) went beyond and suggested that
GS impact measures have to be taken into account when evaluating the impact of both
journals and researchers in disciplines poorly represented in WoS such as management
and international business. In this sense, Kousha and Thelwall (2007) argued that GS is
a more comprehensive tool for citation tracking in social sciences because this branch of
knowledge produces most varied research objects such as books, working papers,
technical reports, etc. However, Jacsó (2008, 2010) was critical of the technical
problems and advised that its use for bibliometric evaluation can produce very
unscholarly measures. Aguillo (2012) also warned that the use of GS for evaluation
purposes should be done with great care, especially regarding the items not overlapping
with those present in Scopus or WoS.
However, there are still very few papers related to GSC data. Huang and Yuan (2012)
carried out an exploratory study of GSC, showing different citation patterns between
disciplines and concluding that GSC is a powerful data source for citation analysis;
while Bar-Ilan et al. (2012) checked the web footprint of a selected group of
information scientists, uncovering that the 23% of them hold a GSC profile. Ortega and
Aguillo (2012) used GSC to build a Map of Science from the labels that describe each
personal profile; introducing a global country and institutional collaboration map from
GSC profiles affiliations (Ortega and Aguillo, 2013). Jacsó (2012) corroborated the
current limitations but predicted a relevant role of GSC for the scientific evaluation in
the future.
Regarding to MAS, just a couple of papers have been published about the performance
of the Microsoft’s service: Jacsó (2011) presented a review of its principal
3Microsoft Academic Search and Google Scholar Citations
functionalities in comparison with Scopus and Web of Science, concluding that MAS
may become a free tool to help the research assessment; Zhang (2011) analysed the h-
index and the co-authors network of 100 profiles in MAS.
Objectives
The aim of this paper is to present an empirical comparison of two web scientific
services that provide personal profiles, Microsoft Academic Search (MAS) vs. Google
Scholar Citations (GSC). In a first stage, it is intended to show a descriptive view of the
coverage of both search engines in terms of disciplines and institutions. The objective is
to detect if there are gaps and biases between them and to know if they can be used
indistinctly in bibliometric/webometric studies as well as in research evaluation.
In a second stage, a detailed comparison of a group of profiles present in both services
is made. Our objective is to observe the variation between documents and citations in
the two databases and to obtain quantitative estimations from these differences.
Methods
Data extraction
MAS is a scientific web database which gathers bibliographic information from the
principal scientific editorials (Elsevier, Springer) and bibliographic services (CrossRef).
It roughly contains 40 millions of documents, and 19 millions of profiles (August 2012)
are automatically created from the signatures of the authors of these papers. Besides
other units like journals, institutions or conferences, MAS also built also profiles for
individuals which includes the author’s list of publications, bibliometric indicators
(publications, citations,), disciplinary areas of interest and different sets of the most
frequent co-authors, journals and keywords.
Each MAS author’s profile includes an identification number randomly assigned. This
randomness is assumed because there are IDs larger than the total number of profiles.
Due to this, a SQL script was designed to automatically request for a range of numbers
from the 1 to 100,000 and to extract the existing profiles in that range. These margins
were established by technical reasons to avoid an excessive querying time. Hence, from
100,000 possible profiles, 15,211 (but only a .08% of the total profiles) were detected.
For each one of these profiles, the name, affiliation, number of documents, number of
citations and h-index were collected.
On the other hand, GSC is a platform where a registered user can build his/her personal
scientific profile from the documents indexed by GS. This publications list is also
supplied with some bibliometric indicators (citations, h-index and i10-index), a co-
authors list, and some keywords, in this case defined by the user. The total number of
profiles is unknown. A crawling process in June 2012 allowed us to retrieve 396,072
profiles, 83,774 of which were no duplicated. The standard capture-recapture formula
(accepting a close population given the short period devoted to sampling) was used to
estimate a population from the number of duplicated records (Ortega and Aguillo,
2012), thus the total number of profiles in GSC in June 2012 could roughly be estimated
at 106,246 profiles.
This crawling process was performed in two stages. First, 600 random queries were
built by the combination of the 25 letters of the Latin alphabet in groups (strings) of two
(i.e. aa, ab, ac, and so on), then they were automatically launched to the search engine
and after checking the search accepted the strings could be contained in the names as
intended, the resulting profiles from these queries were retrieved and stored. That very
exhaustive list of profiles were next used in the second stage to harvest author
information, such as working address, e-mail domain, bibliometric indicators (papers,
4Microsoft Academic Search and Google Scholar Citations
citations, h-index and i10-index) and co-authors list. A SQL routine was implemented
both to the crawling and harvesting tasks to accomplish the data extraction process.
Data comparison
To compare the performance of each profile in MAS and GSC we have identified how
many profiles from the MAS list (15,211) are also included in the GSC one (83,774).
Firstly, we have broken down each name into first name, initials, second name and last
name both in MAS and GSC. Then we have permuted queries between each field,
looking for matching between similar names in MAS and GSC. 802 candidate common
profiles were detected in this way. Next we have refined each pair checking if the
affiliation was the same for both profiles, and comparing the list of publications and co-
authors as well. Manually checking the current personal web pages of each scientist we
were able to detect that the 41% of the profiles in MAS presented an outdated
affiliation, while GSC contained far fewer inaccurate addresses. The low
updating/correcting/merging/deleting rate in MAS is because not only the end user
needs to explicitly request modifications but also due to a slow quality control from the
editors of the service. Otherwise multiple profiles of the same author will be available
showing the different affiliations appearing in the original sources along the years. This
appraisal leads to warn that institutional or country studies with MAS are not
recommended or at least have to be done carefully and after a detailed verification of
the affiliations. Finally, 771 similar profiles were identified in both samples. That means
that a 5% of the MAS profiles are presented in GSC, while just a 1% of the GSC
profiles are in MAS. According to the traditional overlap measure (Hood & Wilson,
2003), the overlap between both sources is .079%. However, these estimations are
based in samples of different representativeness and size. Thus, whereas the GSC
sample is a 78% of the registered scientists, the MAS sample represents just a .08% of
the total authors’ population. Other way to compute the overlap, and perhaps more
precise, would be to match directly each profile against the entire database of MAS or
GSC, but to do that it is necessary to extract all the profiles in both search engines and
to carry out the matching process. This procedure would be too expensive in time and
computing resources. Even in this case, the number of spurious matches (i. e. popular
names as López, Smith o Wong would produce multiple coincidences) could provoke a
large and tedious manual cleaning process.
However, although this approximation has to be cautiously considered, the observed
overlap in general is rather low. This can be due to MAS creates profiles automatically
from each author that appears in a new paper, while in GSC the profile should be
intentionally created by a user, provoking a disproportionately much larger number of
profiles in MAS than in GSC.
Results
Comparative Analysis
This comparative analysis was done from the total data that MAS can provide through
its search interface. According to the main page of MAS, it contains around 19 millions
of profiles or authors in August 2012. In the case of GSC, that information is unknown,
but the crawl carried out in June 2012 allows estimating in 106,246 the total number of
profiles. This means that our sample represents the 78.85% of that population. This
calculation shows that the number of profiles in MAS is almost 200 times the current
number of profiles in GSC. Two main reasons could explain this huge difference
between both providers: 1) MAS is working since 2009, while GSC started two years
later, in 2011; and 2) profiles in MAS are automatically created from the metadata
5Microsoft Academic Search and Google Scholar Citations
(Microsoft, 2012) of several bibliographic services (CrossRef, Elsevier, Springer, etc)
while the GSC profiles are only created when the end-user, an author, freely decide to
do it.
Google Scholar Citations Microsoft Academic Search
Subject Classes Authors % Categories Authors %
Authors Authors
Computer Sciences 20,122 21.4 Medicine 5,849,432 26.8
Biochemistry, Genetics and Molecular Biology 5,752 6.1 Biology 3,034,758 13.9
Engineering 5,936 6.3 Chemistry 2,774,794 12.7
Physics and Astronomy 5,218 5.5 Engineering 2,464,999 11.3
Mathematics 5,524 5.9 Computer Science 1,583,061 7.2
Medicine 4,687 5.0 Social Science 977,975 4.5
Multidisciplinary 4,015 4.3 Mathematics 384,713 1.8
Environmental Science 3,875 4.1 Geosciences 581,715 2.7
Agricultural and Biological Sciences 5,167 5.5 Physics 1,560,789 7.1
Social Sciences 4,403 4.7 Arts & Humanities 482,143 2.2
TOTAL 94,093 100.00 TOTAL 21,857,368 100.00
Table 1. Distribution of authors by disciplines in GSC and MAS
Table 1 shows a comparative distribution by disciplines of the number of authors
registered in both search engines. It is only contains the ten most frequent subjects.
These services do not use the same subject matter classification, as even GSC does not
utilize anyone at all, only uncontrolled labels supplied by the authors. Therefore, these
labels were used to classify each profile according to a defined classification scheme, in
this case the Subject Area categories of Scopus (2008). On the other hand, MAS indeed
uses its own classification scheme (Microsoft, 2011) that it is similar to the Scopus’
one, allowing a fair comparison between them. As the same profile can be classified
under several disciplines; the Total in Table 1 does not match with the total number of
profiles in MAS and GSC.
The most interesting aspect of both distributions is the huge presence of Computer
Science profiles in GSC, with a 21.4%, followed by Engineering (6.3%) and
Biochemistry, Genetics and Molecular Biology (6.1%), while important disciplines such
as Medicine (5%) and Chemistry (2.1%) are comparatively poorly represented. This fit
with the statement that the GSC may be seen as a database populated by scientists
interested in new information technologies, science 2.0 and scientific networking, which
causes an over-presence of Computer Science profiles (Ortega and Aguillo, 2012). On
the contrary, MAS shows a distribution more similar to the traditional citation indices,
in which the Medicine (26.8%), Biology (13.9%) and Chemistry (12.7%) are the
expected disciplines with the largest number of authors. This balanced distribution in
MAS is due to its more homogeneous data sources such as generalist scientific
editorials (Elsevier, Springer) and bibliographic services (CrossRef). However, the
different taxonomies used by MAS and GSC have to be considered when analysing
these discrepancies. For example, Medicine class in MAS is split up in Medicine,
Health Professions and Neurosciences in GSC. If these three categories are combined,
then Medicine will be the second most popular GSC discipline with 6.9%.
6Microsoft Academic Search and Google Scholar Citations
Google Scholar Citations Microsoft Academic Search
Affiliation authors % Affiliation authors %
University of California, Berkeley 473 .6 Russian Academy of Sciences 44,066 .2
University of Michigan 462 .6 Chinese Academy of Sciences 37,562 .2
Harvard University 435 .5 Harvard University 31,889 .2
University of Washington 433 .5 University of São Paulo 28,763 .2
University of Oxford 369 .4 Stanford University 25,586 .1
University of British Columbia 368 .4 ERNET India 24,305 .1
Stanford University 353 .4 University of Toronto 21,979 .1
Massachusetts Institute of Technology 325 .4 Assistance Publique Hôpitaux 22,156 .1
de Paris
University of Minnesota 314 .4 National Institutes of Health 20,940 .1
University of Cambridge 305 .4 University of California 20,696 .1
Berkeley
TOTAL 83,665 100 TOTAL 19,165,290 100
Table 2. Distribution of authors by affiliations in GSC and MAS
Table 2 shows the ten most important research institutions ranked by the number of
authors registered in GSC and MAS. Higher Education Institutions predominate in the
case of GSC, most of them from the United States. Hence the organizations with most
authors are University of California, Berkeley (.57%), University of Michigan (.55%)
and Harvard University (.52%). On the contrary, MAS profiles show a completely
different distribution in which the institutions with larger number of scientists are the
Russian Academy of Sciences (.23%), the Chinese Academy of Sciences (.20%) and
Harvard University (.17%). This distribution in MAS could be due to several data
processing mistakes. The first one is that MAS creates these profiles from several
bibliographic services, which do not unify the different author’s name variants. Thus, it
is very frequent that one same author can have two or even more different profiles
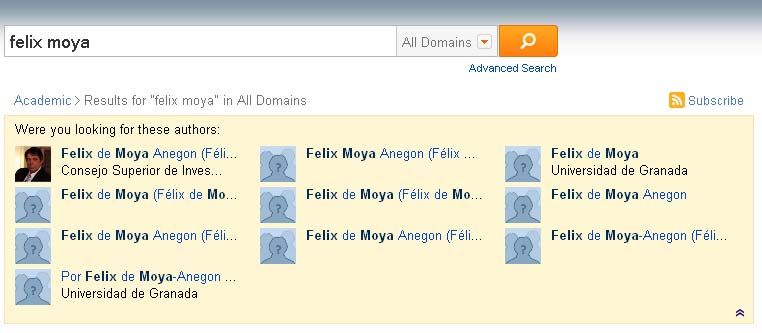
(Figure 1). This is especially true in languages with many possible name variants and
different translations such as Portuguese, Chinese or Russian. The second one is that the
low updating rates can cause that some authors show their previous or first addresses
when they are already working in other places. For instance, the 37,562 profiles from
Harvard University could be due to former alumni or retired professors, because now it
has only 2,100 faculty members (Harvard University, 2012). The third one is that MAS
contains also data from XXth and XIXth centuries, and it is possible that much of these
profiles are outdated or obsolete. A specific crawl of Stanford University’s profiles
brought that the 22% of the profiles was inactive since the year 2000. In spite of these
technical problems, this institutional distribution also reflects the emergence of new
research powers such as the BRIC countries (Brazil, Russia, India and China).
7Microsoft Academic Search and Google Scholar Citations
Figure 1. Example of multiples profiles for a same author (15-11-2012)
Profiles comparison
A comparison of the number of documents, citations and h-index values were done
from the 771 profiles that are present at the same time in both GSC and MAS to detect
the differences and similarities between each service. The aim is obtaining a relative
measure on the proportion of elements included in a group of profiles in both search
engines:
N
xi
∑y
i =1
Px , y = i
⋅ 100
N
Where Px,y is the average proportion of the number of items include in a search engine
(x) between the number of items in other search engine (y) from the same profile (i).
The summation of these proportions and its division by the total number of profiles
produces an average measure on the relative size of a search engine and the profile
completeness regarding to other search engines. When Px,y>1 means that profiles in x
contains in average more items than y and vice versa. This indicator avoids the size
effect bias when both magnitudes are compared in absolute terms. However, this
measurement can not be understood as an overlapping indicator between search engines,
because it does not count how many documents or citations are present in both services,
but what is the size of one profile in two search services according to the number of
assigned items.
According to the sample of 771 profiles, the GSC profiles show a higher proportion of
items than the MAS ones. Thus, GSC gathers 158.3% more documents per profile than
MAS, 327.4% more citations and 155.8% higher h-index values. On the contrary, MAS
only cover the 89.5% of GSC documents, the 76.7% of citations and the 72.1% of h-
index scores per profile.
If these proportions are observed according to research disciplines, it can be appreciated
significant differences in subjects’ coverage. Figure 2 shows the proportion of
documents and citations per profile between GSC and MAS by research disciplines.
Disciplines with less than 5 profiles were excluded, such as Arts and Humanities,
Environmental Sciences, Agriculture Science and Material Science. GSC has a larger
proportion of documents than MAS in every discipline, except in Chemistry
8Microsoft Academic Search and Google Scholar Citations
(MAS=200%) and Medicine (MAS=190%), in which MAS has more documents per
profile. On the contrary, the areas in which GSC has the largest proportion of
documents per profile are Social Sciences (GSC=390%) and Geosciences
(GSC=350%). These results confirm that the data sources of both services are rather
different and it thus produces significant differences in the number of documents and
citations by disciplines. While MAS is only based on meta-data from bibliographic
services, GSC considers a wide range of scientific and technical documents from
academic websites. The high proportion of Social Science and Geosciences documents
in GSC may be caused by books, technical reports or scholar materials. Another
candidate reason is the local nature of many of the contributions in these fields that can
be published in local journals not belonging to the mainstream group of international
titles. Perhaps, this difference is most noticeable in citations per profile in which GSC
shows the largest proportion of citation in every discipline, highlighting Social Sciences
(2200%) and Physics (930%). These high percentages in all disciplines confirm the
wide variety of document types indexed by GSC.
Figure 2. Proportion of documents and citations between GSC and MAS
Discussion
A few considerations can be derived from the obtained results concerning both
academic search engines. Microsoft Research Asia’s (the location of the lab is unrelated
with any geographical bias in the sources) product is an autonomous citation database
mainly built on bibliographic metadata of CrossRef (73%) and records from other
scientific publishers such as Elsevier (13%) and Springer (9%). As a consequence, its
disciplinary coverage is more balanced and similar to Scopus or WoS, because it just
gathers mostly journal articles and proceeding papers. This standard coverage and the
fact that MAS counts on a classification scheme, suggest that this search engine can be
a suitable tool for disciplinary studies.
MAS data shows that its number of documents is clearly smaller than those in GSC, a
fact that has a strong effect in the citation count and the derived bibliometric indicators
(g-index and h-index). However, MAS principal limitation is that after combination
these bibliographic metadata are not processed to remove duplicates, nor the affiliations
are updated when they change. We suspect that many of the 19 millions of authors are
duplicated because each profile is created whenever an author does not fit automatically
with a previous name. At the same time, the 41% of the affiliations seem outdated with
respect to GSC and the Table 2 shows a strange distribution of research institutions.
These technical faults along with the unusual mistakes detected by Jacso (2011) warn
against the use of this service as an evaluation tool mainly in organizational
benchmarking and even more for author’s evaluation.
9Microsoft Academic Search and Google Scholar Citations
GSC is populated, besides through contracts with a large number of editors and
database providers, with data obtained from a crawling process that recovers and
indexes academic documents in the public web in a similar fashion as any search engine
like its parent product Google. This fact explains that the numbers of documents are
significantly higher than in MAS, and therefore the number of citations and h-index
scores are larger too. Moreover, the GSC harvesting process not only includes journal
articles and proceeding papers, but every academic material on the Web such as reports,
books, presentations, etc. This goes beyond the formal scientific publishing channels,
and it explains that disciplines such as social or computer sciences, which produce a lot
of informal scholarly documents, have achieved a strong academic impact on the Web.
Kousha and Thelwall (2007) already advised of this fact, when they found that GS
citations were more numerous than ISI citations in social sciences and computer
science, suggesting that GS is a more comprehensive tool for citation tracking in the
social sciences and in high obsolescence fields. Meho and Yang (2007) also found that
GS stands out by the high number of citations due to its elevated coverage of
proceeding papers. However, its most important weakness as evaluation tool is that the
profiles are voluntarily created by the researcher him/herself which introduces a bias in
favour of authors strongly linked with the new information technologies and web 2.0
environments such as social networks and tools (Ortega and Aguillo, 2012), as well as it
may cause the intentional manipulation of indicators values (Delgado Lopez-Cozar,
Robinson-Garcia & Torres-Salinas, 2012). The larger than expected proportion of
Computer Science authors in GSC in Table 1 could thus be an evidence of this
unbalanced subject-matter distribution. Perhaps, another problem that affects to data
operations is that GSC does not use any taxonomy (or even preferred language) to
conceptualize the profiles and many of this information is expressed in free natural
language such as affiliations and labels, for which the data processing is noticeably
harder in GSC than in MAS.
Conclusions
The comparison between MAS and GSC makes possible to conclude that GSC contains
more academic materials, which produces more citations than MAS; whereas MAS is a
more thematic balanced service, GSC is biased in favour of the computer sciences
disciplines; the restrictive environment of MAS causes low updating rates and the
proliferation of multiple profiles of the same author, meanwhile the openness view of
GSC favours the accuracy of the data but makes more time expensive its data
processing. In view of these drawbacks and advantages between both search engines, it
is concluded that both introduce important improvements to the research evaluation,
such as a wider coverage of academic materials and therefore a wider discernment of
the research impact; a maintenance of public and free customizable profiles along the
time that reinforces personal evaluations; and an autonomous system that makes
possible the bibliometric analyses of huge populations. However, their technical
limitations such as duplicated profiles, spurious citations, and possible manipulations,
make advisable that the use of these citation indexes in research evaluation will be
jointly other citation databases that permit to detect biases or gaps that could undervalue
the analysis of an institution, discipline, or author. As many of these limitations are
probably due to the novelty of these platforms, it can be expected that future
developments would improve these services and they became stronger competitors of
the actual subscription-based citation databases.
Especially regarding the suitability of these services for bibliometric researches, we
conclude that MAS is better recommended for disciplinary studies than for analyses at
10Microsoft Academic Search and Google Scholar Citations
institutional and individual levels. On the contrary, GSC is a good tool for individual
assessment because it counts on a wider variety of documents and citations. However, it
is not yet recommended for disciplinary studies due to its unbalanced thematic
distribution.
References
Aguillo, I. F. (2012). Is Google Scholar useful for bibliometrics? A webometric
analysis. Scientometrics, 91(2): 343-351
Bakkalbasi, N., Bauer, K., Glover, J. & Wang, L. (2006).Three options for citation
tracking: Google Scholar, Scopus and Web of Science. Biomedical Digital Libraries,
3(7) http://www.bio-diglib.com/content/3/1/7
Bar-Ilan, J., Haustein, S., Peters, I., Priem, J., Shema, H. & Terliesner, J. (2012).
Beyond citations: Scholars’ visibility on the social Web. 17th International Conference
on Science and Technology Indicators (pp. 14). Montréal: Science-Metrix and OST
Delgado López-Cozar, E., Robinson-Garcia, N., Torres-Salinas, D. (2012).
Manipulating Google Scholar Citations and Google Scholar Metrics: simple, easy and
tempting. EC3 Working Papers 6:
Google Scholar blog (2011a). Google Scholar Citations
http://googlescholar.blogspot.com/2011/07/google-scholar-citations.html
Google Scholar blog (2011b). Google Scholar Citations open to all
http://googlescholar.blogspot.com/2011/11/google-scholar-citations-open-to-all.html
Harvard University (2012). Harvard at a Glance. http://www.harvard.edu/harvard-
glance
Harzing, A. W. K. & Van der Wal, R. (2008). Google Scholar as a new source for
citation analysis. Ethics in Science and environmental politics, 8(1): 61-73
Hirsch, J. E. (2005). An index to quantify an individual's scientific research output.
Proceedings of the National Academy of Sciences, 102(46): 16569–16572.
Hood, W. W. & Wilson, C. S. (2003). Overlap in bibliographic databases. Journal of the
American Society for Information Science and Technology, 54(12): 1091-1103.
Huang, Z. & Yuan, B. (2012). Mining Google Scholar Citations: An Exploratory Study.
Lecture Notes in Computer Science, 7389/2012: 182-189
Jacsó, P. (2008). Google Scholar revisited. Online Information Review, 32(1): 102 –
114
Jacsó, P. (2010). Metadata mega mess in Google Scholar. Online Information Review,
34(1): 175 – 191
11Microsoft Academic Search and Google Scholar Citations
Jacsó, P. (2011). The pros and cons of Microsoft Academic Search from a bibliometric
perspective. Online Information Review, 35(6): 983 – 997
Jacsó, P. (2012). Google Scholar Author Citation Tracker: Is it too little, too late?
Online Information Review, 36(1): 126-141.
Jiang, J., He, D. & Ni, C. (2011). Social Reference: Aggregating Online Usage of
Scientific Articles in CiteULike for Clustering Academic Resources. In: Newton, G.,
Wright, M. & Cassel, L. (eds.). Proceedings of the 11th annual international ACM/IEEE
joint conference on Digital libraries (pp. 401-402). New York: ACM
Kousha, K. & Thelwall, M. (2007). Google Scholar citations and Google Web-URL
citations: A multi-discipline exploratory analysis. Journal of the American Society for
Information Science and Technology, 58(7): 1055-1065
Krutchkoff, R. G. (1967). Classical and Inverse Regression Methods of Calibration.
Technometrics, 9(3): 425-439
Meho, L. I. & Yang, K. (2007). Impact of data sources on citation counts and rankings
of LIS faculty: Web of Science versus Scopus and Google Scholar. Journal of the
American Society for Information Science and Technology, 58(13): 2105–2125.
Microsoft (2011). Academic Categories in Microsoft Academic Search.
http://social.microsoft.com/Forums/en-US/mas/thread/bf20d54a-ede2-48a9-8bbb-
f6c1c1f30429
Microsoft (2012). Microsoft Academic Search Data Coverage
http://social.microsoft.com/Forums/en-US/mas/thread/7ed5d49d-65b7-4a2f-9adf-
4de9e23ee70e
Ortega, J. L. & Aguillo, I. F. (2012), Science is all in the eye of the beholder: keyword
maps in Google Scholar Citations. Journal of the American Society for Information
Science and Technology, 63(12): 2370-2377
Ortega, J. L. & Aguillo, I. F. (2013), Institutional and country collaboration in an online
service of scientific profiles: Google Scholar Citations. Journal of Informetrics, 7(2):
394-403
Fenner, M. (2011), Google Scholar Citations, Researcher Profiles, and why we need an
Open Bibliography. PLoS Blogs
http://blogs.plos.org/mfenner/2011/07/27/google-scholar-citations-researcher-profiles-
and-why-we-need-an-open-bibliography/
Priem, J., Piwowar, H., & Hemminger, B. (2011). Altmetrics in the wild: An
exploratory study of impact metrics based on social media. In Metrics 2011:
Symposium on Informetric and Scientometric Research. New Orleans, LA, USA
Scopus (2008). Subject Area Categories.
http://help.scopus.com/robo/projects/schelp/h_subject_categories.htm
12Microsoft Academic Search and Google Scholar Citations
Scopus (2013). Scopus | SciVerse.
http://www.info.sciverse.com/scopus
Thomson Reuters (2012). Web of Science: Factsheet.
http://thomsonreuters.com/content/science/pdf/Web_of_Science_factsheet.pdf
Waldrop, M. M. (2008). Science 2.0. Scientific American, 298: 68 – 73
Wikipedia (2013). Microsoft Academic Search.
http://en.wikipedia.org/wiki/Microsoft_Academic_Search
Zhang, S. (2011). Hirsch Index and a Co-authorship Network
http://scenic.princeton.edu/network20q/blog/?p=583
13You can also read