Modeling the Deformation and the Failure Process of Glass Woven Fabrics Based on the Fibre-Bundle-Cells Theory
←
→
Page content transcription
If your browser does not render page correctly, please read the page content below
Acta Materialia Transylvanica 4/1. (2021) 58–63.
                           DOI: Hungarian: https://doi.org/10.33923/amt-2021-01-10
                                English: https://doi.org/10.33924/amt-2021-01-10

   Modeling the Deformation and the Failure Process of Glass
   Woven Fabrics Based on the Fibre-Bundle-Cells Theory
   Ábris Dávid Virág,1 László Mihály Vas,2 Kolos Molnár3
   1 Budapest University of Technology and Economics, Faculty of Mechanical Engineering, Department of

   Polymer Engineering, Budapest, Hungary, viraga@pt.bme.hu
   2Budapest University of Technology and Economics, Faculty of Mechanical Engineering, Department of
   Polymer Engineering, Budapest, Hungary, vas@pt.bme.hu
   3Budapest University of Technology and Economics, Faculty of Mechanical Engineering, Department
   of Polymer Engineering, Budapest, Hungary and MTA–BME Research Group for Composite Science and
   Technology, Budapest, Hungary, molnar@pt.bme.hu

Abstract
In this study, we modeled the deformation and failure behavior of different glass woven fabrics under uni-
axial tension using the Fibre Bundle Cells-modeling method. The difference between the analytical, phenom-
enological model curve and the mean curve calculated from the measurement results was classified by the
relative mean squared error (RMSE), which is closely related to the coefficient of determination. This value
was less than 3.6% in all the examined cases, which indicated good modeling.
   Keywords: FBC modeling, glass woven, tensile test.

1. Introduction                                            1.1. Continuum models
  Nowadays, the application fields of polymer                Most woven fabric models are continuum mod-
composites are constantly expanding, and in ad-            els that treat fabric as a continuum material. Tra-
dition to fiber-reinforced polymer composites [1]          ditionally, layer models of composite mechanics
research on nano- [2], and biocomposites [3], as           are used to model fabrics. In order to describe the
well as on the destruction of composite structures         fabric-reinforced composites more accurately,
[4], is gaining prominence. The high use of poly-          several analytical and finite element 2D and 3D
                                                           models have been developed that already take into
mer composites is well illustrated by the fact that
                                                           account the fibrous structure of the fabrics and
more than 50% of the raw materials used in air-
                                                           the structure resulting from the weaving technol-
craft manufacturing are polymer composites (ex-
                                                           ogy. Examples are the mosaic model developed by
cluding engines) [5].
                                                           Ishikawa [6], and the fiber undulation model [7].
  A significant part of these are fabric-reinforced
                                                           The mosaic model first divides the fabric into two
composites, hence there is a huge demand for
                                                           layers perpendicular to each other and then sep-
models which can properly describe the mechan-             arates the warp and weft yarns within the layers.
ical and failure behavior of fabrics and fabric-re-        The fiber undulation model takes into account the
inforced composite materials and products al-              continuity, the unevenness of the yarns and the
ready in the design phase. However, this requires          intersection of warp and weft yarns as well. It de-
fabric models that allow a sufficiently accurate           scribes the fabric with a repeating unit consisting
description of the mechanical behavior of the              of three parts: a two-layer element where the two
fabrics. Continuous or discrete element models             layers are oriented perpendicularly (which is also
are basically used to model the behavior of wo-            used at the yarn intersections of the mosaic mod-
ven fabrics.                                               el), a corrugated element (which describes the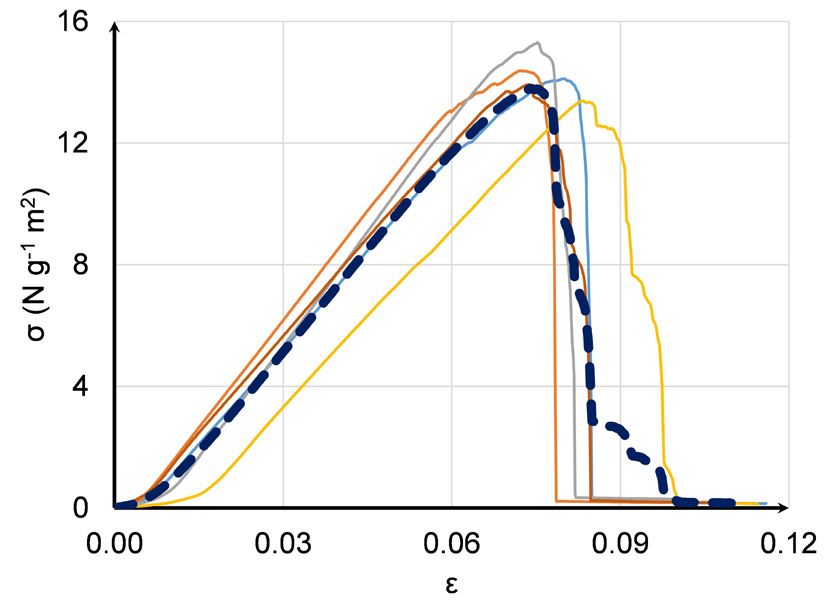
Virág Á. D., Vas L. M., Molnár K.. – Acta Materialia Transylvanica 4/1. (2021)                                      59

actual intersection of warp and weft yarns), and                2. The applied model
an element assuming pure matrix material. Later,
                                                                  In the model, the real fabric of warp and weft
2D and 3D modeling have developed from these
                                                                yarns was replaced by a model with only warp
basic models, and the models applied today can
                                                                yarns. This was possible because during the warp
be used to describe time- and temperature-depen-
                                                                direction strip tensile tests, the weft yarns essen-
dent behaviors as well [8].
                                                                tially do not take up the load, only modify the
1.2. Discrete element models                                    spatial arrangement and deformation behavior
  Discrete element models define fabric as a net-               of the warp yarns. Therefore, a model bundle is
work of a finite number of nodes (typically mass                required whose elements are virtual warp yarns
points), and nodes are usually connected by me-                 that also include the effect of weft yarns. For 0 °
chanical elements with specific properties (e.g.,               specimens, “strong” model yarns are obtained.
springs, dashpots, etc.). One such model is based               This step can also be done for 45 ° specimens, but
on a network of springs and dashpots connected                  in this case there is no yarn in the direction of the
in parallel by Gräff and Kuzmina [9]. In the mod-               load. Therefore, as a result of waviness and obliq-
el, discrete points of mass are connected by differ-            uity modifying the deformation behavior, “weak”
ent springs (structural, bending and shear). How-               (warp) model yarns are obtained.
ever, these are not simple springs, but essentially             2.1. Modeling with one nonlinear E-bundle
Kelvin-Voigt elements (since the spring branches
                                                                  A nonlinear E-bundle from the model set was
also contain dashpots). The model considers the
                                                                used to model the tensile tests on the 0 ° fabric
springs to have a linear characteristic and the
dashpots to be proportional to the speed, while                 bands. The E-bundle is a well-arranged, elastic,
not taking into account the friction between the                breaking bundle with independent fibers, ideal
yarns.                                                          grips at both ends (i.e., the fibers do not slip out of
  Another discrete element model suitable for de-               the grip and do not break in the grip), the fibers
scribing woven fabrics is the Vas’s fiber bundle                are parallel to each other and to the direction
cell model [10, 11]. The Fiber Bundle Cell-based                of pulling and are not pre-stressed (i.e. they are
modeling method offers a set of model elements                  stress-free but not loose). In this case, the tensile
that can be used to build a system for describing               characteristic (f(ε) (N∙g-1∙m2) is described by Equa-
the behavior of fibrous structures and composites               tion (1), where ε denotes the relative elongation,
reinforced with fibrous structures. The Fiber Bun-              a > 0 (N∙g-1∙m2), b > 0 (N∙g-1∙m2) are the parameters
dle Cell model is a discrete element model that                 representing the influence of the waviness of the
takes into account that the fabric used as a com-               yarn and the wrinkling of the woven strip on the
posite reinforcement is not a continuum struc-                  tensile characteristic, and c > 0 (N∙g-1∙m2) is the as-
ture. The model also considers that the yarns (as               ymptotic tensile stiffness:
fibers) that constitute the fabric form fiber bun-                f (ε) = c ε + a (1 – e-bε)                        (1)
dles (fiber bundle cells) at the microscopic level.               It can be seen that for a = 0 and/or b = 0, Equation
When describing fabrics, the model considers the                (1) also includes the linear case. However, Equa-
warp and weft yarns of the fabric as fiber bun-                 tion (1), like the tensile characteristics in general,
dles. At the macroscopic level, it describes woven              only describes the intact operation, which can be
fabrics as a concentrated parameter network of                  determined for most mechanical models. Fiber
mechanical elements (fiber bundle cells) with                   bundle cell-based modeling, on the other hand,
discrete, statistical, linear, or nonlinear charac-             assumes that there are defects in the test mate-
teristics. The model assumes that the fibers in a
                                                                rial. These are considered with a so-called reli-
partially ordered fiber bundle of the same type of
                                                                ability function (g(ε)) (2), where ε is the specific
fibers can be classified based on their initial state
                                                                elongation of the model yarn, εS is the specific
and environmental properties (gripping condi-
                                                                elongation at break of the model yarn, and           is
tions) and can be shifted along with their envi-
                                                                the distribution function of the specific elonga-
ronment (or into a similar environment). Fibers
                                                                tion at break:
in the same classes form a sub-fiber bundle (i.e. a
fiber bundle cell). The system of fiber bundle cells              g (ε) = (1 –     (ε))                             (2)
produced in this way, parallel to the direction of               In this case, the reliability function is a com-
stretching, models the structure and strength of                plementary distribution function of the specific
the original bundle.                                            elongation at break. The reliability function gives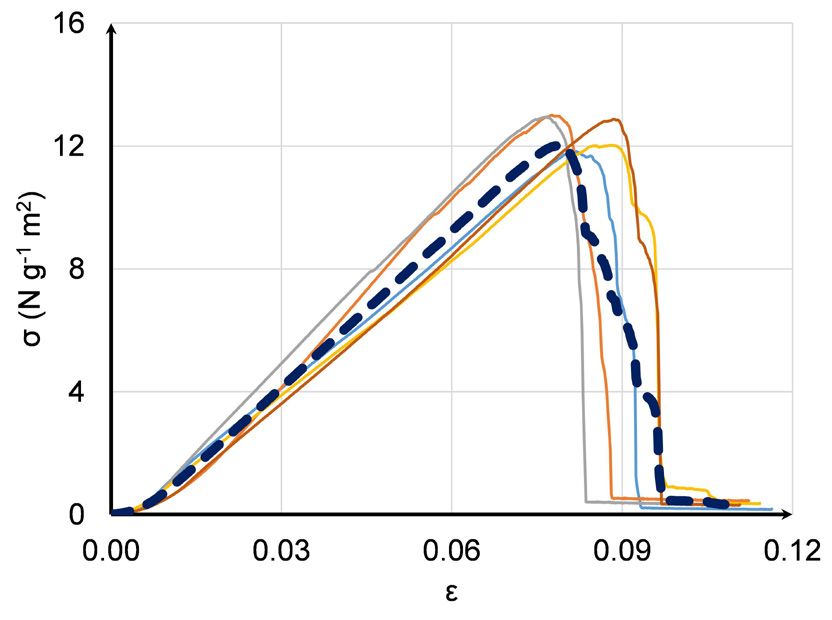
60 Virág Á. D., Vas L. M., Molnár K.. – Acta Materialia Transylvanica 4/1. (2021)
the ratio of the still operating, i.e. intact fibers at of the samples was performed on a universal ten-
the given load level (ε). In the present case, we sile machine (manufacturer: Zwick, type: Z005).
assumed the specific elongation at break (εS) of The grip length was 100 mm and the test speed
the model yarns to be normally distributed. Using was 25 mm/min, during the test, the force and
equations (1) and (2), the tensile stress σ(ε) can be the crosshead displacement were recorded. FBC
produced as the product of the tensile character- modeling was performed based on tensile tests.
istic f(ε) and the reliability function g(ε) (3), which The five force-crosshead displacement curves
significantly reduces the operation of the calcula- were first parameterized to the specific stress (ra-
tions for more complex calculations: tio of the measured force and the area density of
σ(ε) = f(ε) ∙ g(ε) (3) the specimen) – specific elongation (ratio of the
actual and initial clamping length of the speci-
2.2. Modeling with two nonlinear E-bundles men) curve, and then determined in each case
connected in parallel by the so-called smoothed mean curve (this was
Two parallel-connected nonlinear E-bundles obtained by moving average smoothing, where
were used in each case to model the mean curves the width of the smoothing window was ε = 0.01).
describing the deformation and failure behavior The resulting mean curves were used for model-
of 45 ° angled woven strips under uniaxial ten- ing. Using Equations (1) - (6), we performed the
sion. The use of the two bundles was necessary FBC modeling for the total specific stress -specific
due to the shape of the curves, as a very inaccu- elongation curve. The model parameters (ai, bi, ci,
rate result would have been obtained with a sin- di, and pi) in Equations (1) and (5) were optimized
gle bundle model. The two-bundle case is very by an iteration method, so that the difference
similar to the single bundle case, however, the between the model curve and the mean curve
tensile characteristic is described not by Equa- should be optimized to get a minimum RMSE val-
tion (1) but by Equation (4), where p1 and p2 are ue (Eq. 7), which is closely related to the coeffi-
weights for which it is true that p1 + p2 = 1: cient of determination:
f(ε) = p1 ∙ f1(ε) + p2 ∙ f2(ε) (4)
where the characteristic of each bundle is (5): (7)
(5)
where n is the number of measuring points,
where i ∈ {1, 2}, } and d is an offset that is zero σmeasured is the specific stress calculated from the
in one or both cases. It can be seen that Equation measured force values, and εi is the elongation
(5) also includes the single bundle case, where value corresponding to the stress measured at the
d = 0. In the two-bundle case, for example, for one given point.
bundle d > 0, and for the other d = 0. Thus, in the
two-bundle case, the tensile characteristic has 4. Results and discussion
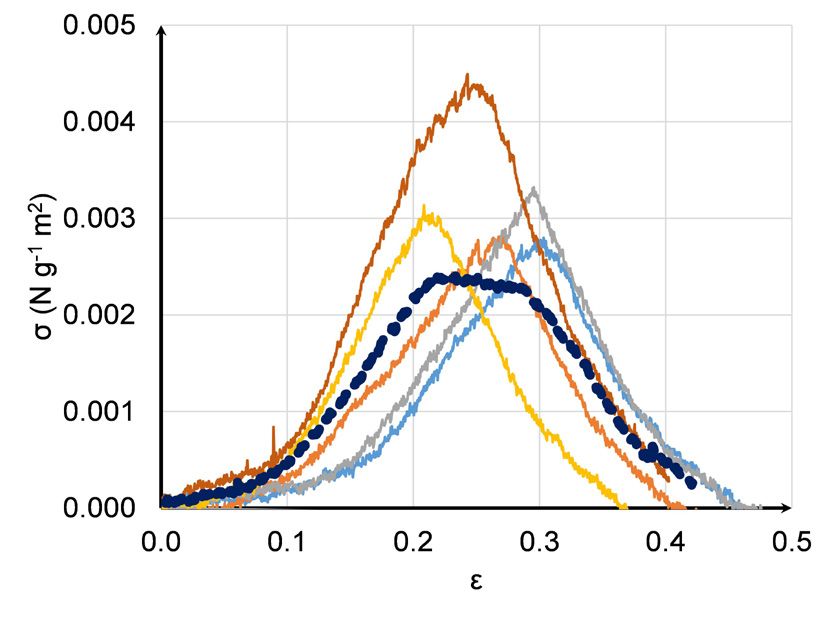
four parameters. In this case the specific tensile The specific stress (σ)-specific elongation (ε)
stress also can be obtained as the weighted sum curves calculated from the tensile tests for the
of the product of the tensile characteristic and the tested woven fabrics are shown in Figures
reliability function on the two nonlinear bundles 1-4. In the figures, the dashed line indicates the
E (E1 and E2) : smoothed mean curve required for the modeling.
The curves show that there is no significant
(6) difference between the force maxima of the test
specimens of the same size but with different
weaves in the warp direction. However, in the
3. Materials and methods case of ±45 degrees, there is an order of magni-
In the research, UTE195P from the manufactur- tude difference. Since there is no yarn in the di-
er Unique Textiles (area density: 195 g/m2, weave: rection of the load in this test, the maximum force
plain) and UTE195T (area density: 195 g/m2, is determined by the weave of the fabrics, since
weave: twill) glass fabrics were tested. Warp-di- all their other parameters are the same. These
rectional and ± 45° samples were prepared from measurement results also prove that twill weav-
the woven fabrics, with a width and length of 50 ing results in a much looser structure, which also
and 200 mm, respectively. Uniaxial tensile testing implies that it is much easier to transform into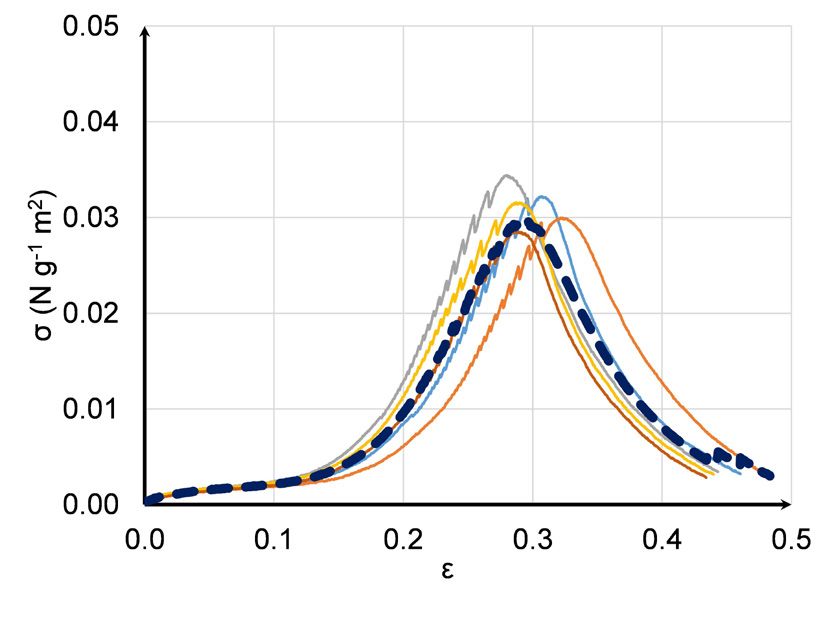
Virág Á. D., Vas L. M., Molnár K.. – Acta Materialia Transylvanica 4/1. (2021) 61
Figure 1. Warp directional tensile curves and the Figure 3. ±45 ° directional tensile curves and the
smoothed mean curve (dashed line) of plain smoothed mean curve (dashed line) of plain
fabric. fabric.
Figure 2. Warp directional tensile curves and the Figure 4. ±45 ° directional tensile curves and the
smoothed mean curve (dashed line) of twill smoothed mean curve (dashed line) of twill
fabric. fabric.
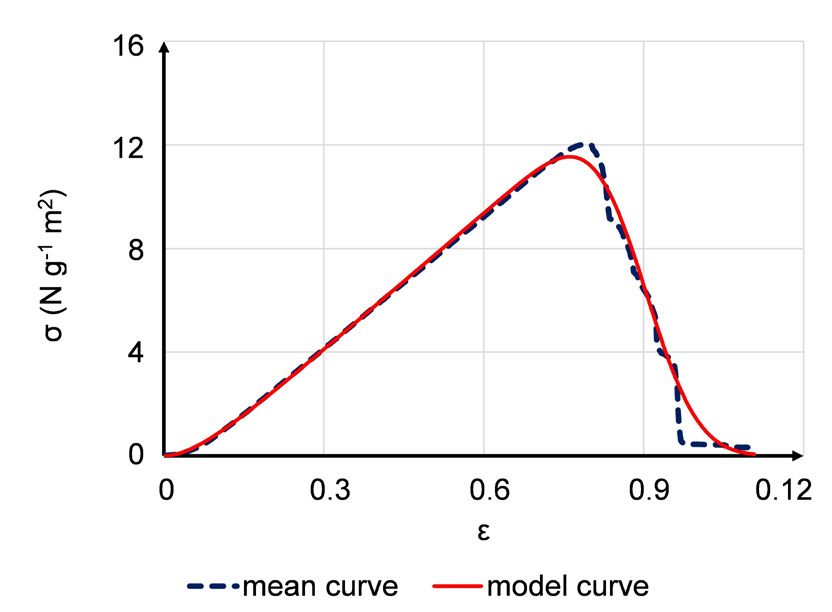
complex 3D shapes. Of course, this difference also curve and the curve calculated by the Fiber Bun-
occurs in the mechanical properties when used dle Cell theory is less than 3.6% in every case.
as an embedded reinforcement. The relationship Based on these results, the modeling can be con-
between the smoothed mean curves determined sidered exceptionally good, as the modeled curve
from each measurement curve and the modeled approximates the smoothed mean curve well
curves is shown in Figures 5–8. enough.
AThe quantified results of the modeling are
shown in Table 1. In the table, parameters a, b, 5. Conclusions
c, d are the variables in Equations (1) and (5), and Using the Fiber Bundle Cell theory, we created
E(εS), D(εS) and V(εS) are the expected value, stan- a discrete element, analytical, phenomenolog-
dard deviation, and relative standard deviation, ical model suitable for the mechanical model-
respectively. To characterize the relationship be- ing of the deformation and failure behavior of
tween the model curves and the smoothed mean the investigated composite reinforcing fabrics
curves, i.e. to determine the goodness of the mod- during uniaxial tensile testing. The relative mean
eling, we used the relative mean squared error squared error between the smoothed mean curve
(RMSE). determined from 5 tensile tests per material and
It can be seen from Table 1. that the relative the curve calculated from the model was less
mean squared error between the smoothed mean than 3.6% in each case.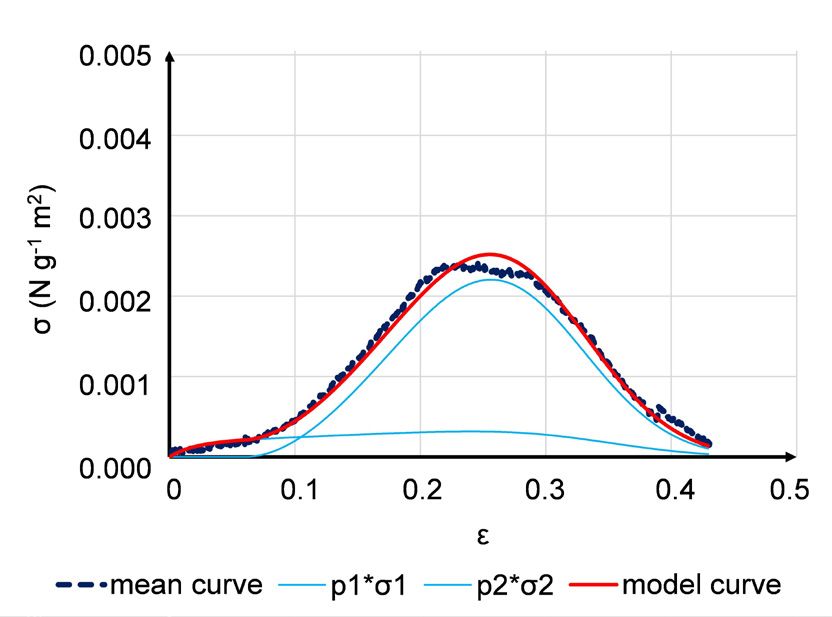
62                                         Virág Á. D., Vas L. M., Molnár K.. – Acta Materialia Transylvanica 4/1. (2021)

Table 1. Parameters characterizing the modeling of woven fabric strips

                                                             MODEL PARAMETERS
                                Model-         Tensile characteristics - intact
        Sample and grip                                                                        Failure           Fitting
                               structure                functioning
                       Azi-      Com-
             Grip
  Sam-                muth      ponent          a          b          c                                  V(εS)   RMSE
           distance                                                               d    E(εS)    D(εS)
   ple                angle     weight,     (N∙g-1∙m2) (N∙g-1∙m2) (N∙g-1∙m2)                              (%)     (%)
            (mm)
                       (°)         p
Plain        100          0       1.00         -220        1.5         330        0     0.09    0.008     9.0     3.05
Twill        100          0       1.00         -267        1.5         400        0     0.08    0.006     7.1     3.49
                                  0.40         0.3         2.0        0.08        0     0.44    0.033     7.5
Plain        100       45                                                                                         2.10
                                  0.60         -8.3        0.1        0.92       12     0.33    0.033    10.0
                                  0.12         0.3         0.5        0.01        0     0.34    0.063    18.5
Twill        100       45                                                                                         3.59
                                  0.88         -0.6        0.1        0.06        6     0.29    0.063    21.7

Figure 6. Warp directional mean curve and model            Figure 7. ±45 ° directional mean curve and model
          curve of twill fabric obtained from tensile                curve of plain fabric obtained from tensile
          tests.                                                     tests.

Figure 5. Warp directional mean curve and model            Figure 8. ±45 ° directional mean curve and model
          curve of plain fabric obtained from tensile                curve of twill fabric obtained from tensile
          tests.                                                     tests.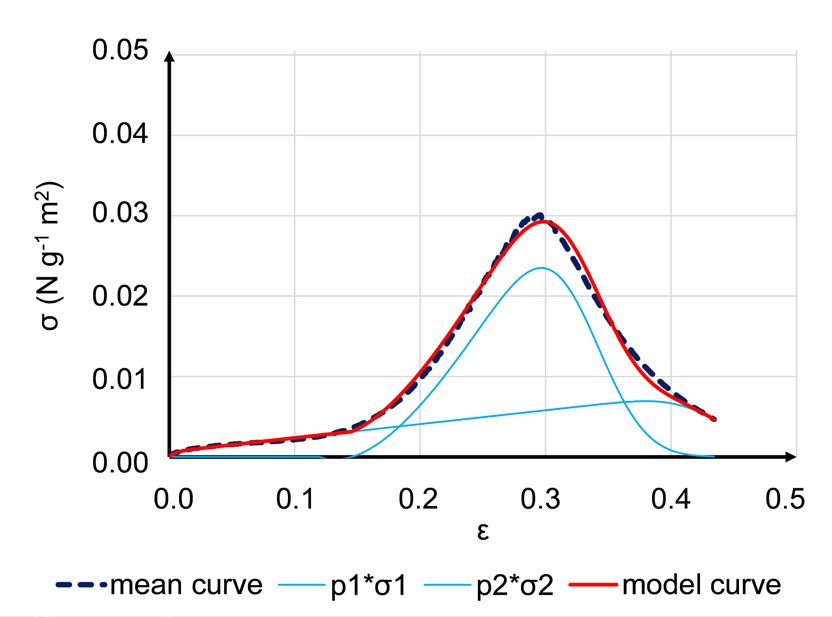
Virág Á. D., Vas L. M., Molnár K.. – Acta Materialia Transylvanica 4/1. (2021)                                       63

 Based on the results, the modeling method is                   [4] Takács L., Szabó F.: Experimental and Numerical
proven to be exceptionally good. It can be stated                    Failure Analysis of Adhesive Joint of Glass Fiber
that the FBC modeling is a fast, simple method                       Reinforced Polymer Composite. Periodica Poly-
with a small computing capacity, which is suit-                      technica Mechanical Engineering, 64/1. (2020)
able for describing the deformation and failure                      88–95.
behavior of fabrics under uniaxial tension.                          https://doi.org/10.3311/PPme.15106
                                                                [5] 1001Crash.com: Worries about new composite
Acknowledgements                                                     made airplane, 2011. (letöltve: 2021. február 17.).
This research was supported by the ÚNKP-20-3 and                     http://www.1001crash.com/index-page-compos-
ÚNKP-20-5 New National Excellence Program of the                     ite-lg-2.html
Ministry for Innovation and Technology. The re-                 [6] Ishikawa T.: Anti-symmetric Elastic Properties of
search reported in this paper and carried out at BME                 Composite Plates of Satin Weave Cloth. Fiber Sci-
has been supported by the NRDI Fund (TKP2020 NC,                     ence and Technology, 15/2. (1981) 127–145.
Grant No. BME-NC) based on the charter of bolster                    https://doi.org/10.1016/0015-0568(81)90066-X
issued by the NRDI Office under the auspices of the             [7] Ishikawa T., Chou T. W.: One-dimensional Micro-
Ministry for Innovation and Technology.                              mechanical Analysis of Woven Fabric Composites.
                                                                     AIAA, 21/12. (1983) 1714–1721.
References                                                           https://doi.org/10.2514/3.8314
[1] Rajak D. K., Pagar D. D., Menezes P. L. Linul E.: Fi-       [8] Shrotriya P., Sottos N. R.: Viscoelastic Response of
    ber-Reinforced Polymer Composites: Manufactur-                   Woven Composite Substrates. Composites Science
    ing, Properties, and Applications. Polymers, 11/10.              and Technology, 65/3–4. (2005) 621–634.
    (2019) 1667.                                                     https://doi.org/10.1016/j.compscitech.2004.09.002
    https://doi.org/10.3390/polym11101667                       [9] Gräff J., Kuzmina J.: Cloth Simulation Using Mass
[2] Singh R., Shrivastava A. K., Bajpai A. K.: CdSe rein-            and Spring Model. In: Material Science. Mechan-
    forced polythiophene nanocomposites as excellent                 ical Engineering 2004. Proceeding of 4th Confer-
    materials for diode applications. eXPRESS Poly-
                                                                     ence on Mechanical Engineering, Budapest, Hun-
    mer Letters, 15/1. (2021) 45–57.
                                                                     gary, Budapest, BUTE, (2004) 443–447.
    https://doi.org/10.3144/expresspolymlett.2021.6
                                                                [10] Vas L. M.: Idealizált statisztikus szálkötegcellák
[3] Akintayo O. S., Olajide J. L., Betiku O. T., Egoh A.
    J., Adegbesan O. O., Daramola O. O., Sadiku E. R.,               és alkalmazásuk szálas szerkezetek, kompozitok
    Desai D. A.: Poly(lactic acid)-silkworm silk fibre/fi-           modellezésére. MTA doktori értekezés (2007).
    broin bio-composites: A review of their processing,         [11] Vas L. M., Tamás P.: Modelling Method Based
    properties, and nascent applications. eXPRESS                    on Idealised Fibre Bundles. Plastics, Rubber and
    Polymer Letters, 14/10. (2020) 924–951.                          Composites, 37/5–6. (2008) 233–239.
    https://doi.org/10.3144/expresspolymlett.2020.76                 https://doi.org/10.1179/174328908X309411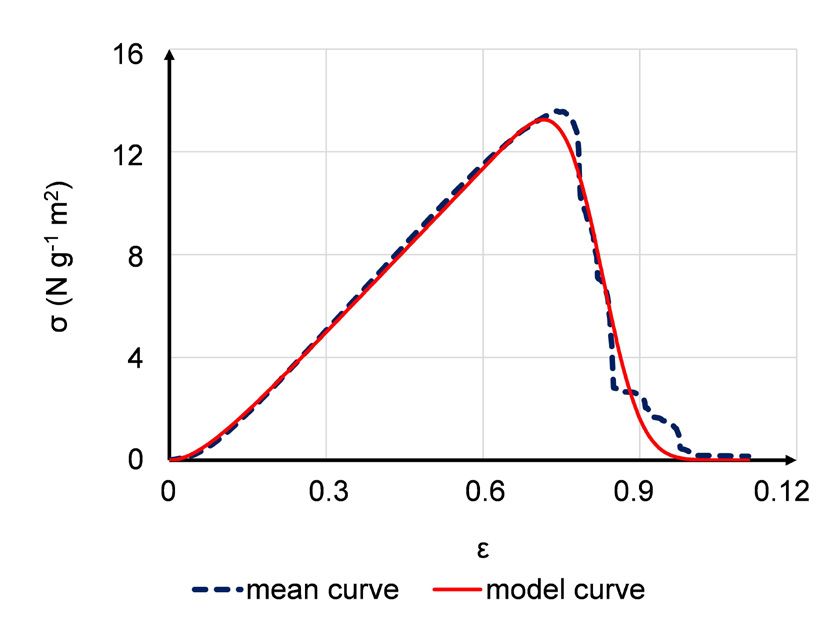
You can also read