An Independent Cascade Propagation Model of Vespa mandarinia Population with Propagation Index
←
→
Page content transcription
If your browser does not render page correctly, please read the page content below
Open Access Library Journal
                                                                                                            2021, Volume 8, e7345
                                                                                                           ISSN Online: 2333-9721
                                                                                                             ISSN Print: 2333-9705

An Independent Cascade Propagation
Model of Vespa mandarinia Population
with Propagation Index

Tong Zhou, Jin Gao, Tingzhen Liu, Yafei Jiang

College of Information Science and Engineering, Shenyang University of Technology, Shenyang, China

How to cite this paper: Zhou, T., Gao, J.,      Abstract
Liu, T.Z. and Jiang, Y.F. (2021) An Inde-
pendent Cascade Propagation Model of            The Vespa mandarinia disaster has been a problem all over the world. In the
Vespa mandarinia Population with Propa-         prevention and control of Vespa mandarinia, the efficiency is often low and a
gation Index. Open Access Library Journal,
                                                lot of social resources are wasted because of the inability to effectively predict
8: e7345.
https://doi.org/10.4236/oalib.1107345           the spread of Vespa mandarinia. Therefore, this paper proposes a propaga-
                                                tion model based on independent cascade. Based on the traditional propaga-
Received: March 24, 2021                        tion model, the habit factor and propagation index are added, which makes
Accepted: April 17, 2021
Published: April 20, 2021
                                                the habit and reproduction of wasps fully considered. Vespa mandarinia tend
                                                to migrate to the water edge, and the nodes closer to the water edge in the pro-
Copyright © 2021 by author(s) and Open          pagation model are more likely to be activated. The longer the Vespa manda-
Access Library Inc.
                                                rinia nests exist, the higher the probability of having more Vespa mandarinia,
This work is licensed under the Creative
Commons Attribution International               and the longer the nodes exist in the propagation model, the stronger the
License (CC BY 4.0).                            propagation ability. The model is validated by the real Vespa mandarinia dis-
http://creativecommons.org/licenses/by/4.0/     aster data in the United States in 2019, which proves that the propagation
               Open Access
                                                model considering Vespa mandarinia habits and reproduction will have bet-
                                                ter performance.

                                                Subject Areas
                                                Biophysics, Biotechnology

                                                Keywords
                                                Independent Cascade Model, Network Modeling and Simulation,
                                                Propagation Model, Ecological Informatics, Species Invasion

                                              1. Introduction
                                              Vespa mandarinia is the largest species of hornet in the world, and the occur-

DOI: 10.4236/oalib.1107345       Apr. 20, 2021                      1                                  Open Access Library Journal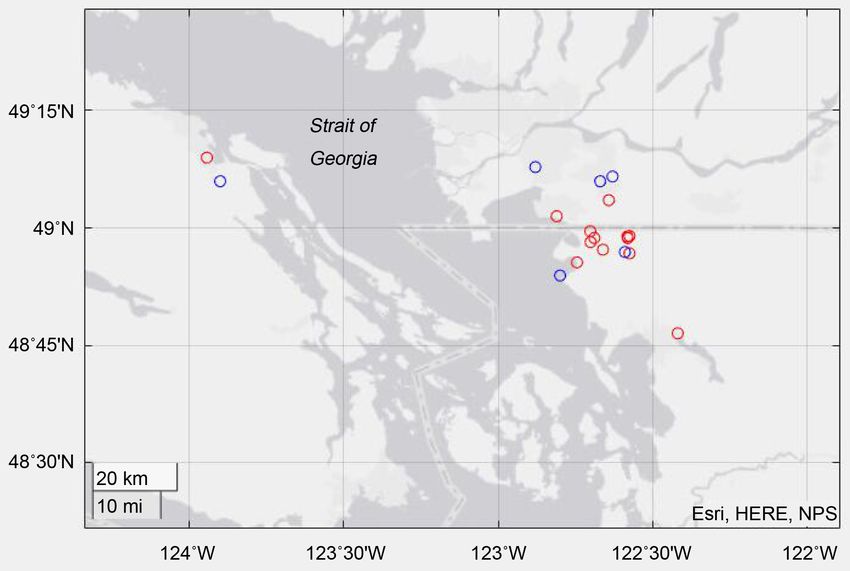
T. Zhou et al.

                             rence of the nest was alarming. Additionally, the giant hornet is a predator of
                             European honeybees, invading and destroying their nests. A small number of the
                             hornets are capable of destroying a whole colony of European honeybees in a
                             short time. At the same time, they are voracious predators of other insects that
                             are considered agricultural pests [1]. When Vespa mandarinia was first discov-
                             ered in Washington State, the United States, it had a serious impact on the local
                             agriculture. When Vespa mandarinia were first found in Washington State, they
                             had a serious impact on local agriculture [2]. So, it is very important to predict
                             the reproduction and spread of Vespa mandarinia accurately for the prevention
                             and control work, which is also the problem to be solved in this paper. Due to
                             the small amount of data in such tasks, it is difficult for large-scale spatiotem-
                             poral prediction models such as graph neural network model [3] [4] to converge.
                             Therefore, we introduce a traditional propagation model which only needs a small
                             amount of data to calculation the parameters. The habits and nests of Vespa
                             mandarinia were also considered.

                             2. Model
                             Classical propagation models include linear threshold model [5] and indepen-
                             dent cascade model [6]. The linear threshold model considers that when an ac-
                             tivated node cannot activate a neighbor node, its impact on the neighbor node is
                             cumulative rather than discarded, and this contribution continues until the node
                             is activated or the propagation process ends. The independent cascade model
                             considers that an active node attempts to activate a neighbor node through a
                             system variable: the probability of success, if it fails, the impact will be discarded
                             [7]. However, it is a probability problem that Vespa mandarinia propagate from
                             one location to another in this task, and there is no need for cumulative impact.
                             Therefore, we use independent cascade propagation model to predict propaga-
                             tion.
                               Place 1000 randomly distributed nodes within 11,000 square kilometers of the
                             Vespa mandarinia infestation area as checkpoints, and place these nodes in the
                             node graph along with the nodes that have been identified as having Vespa man-
                             darinia. When the distance between two nodes is less than the set threshold, an
                             edge is established between the random node and the random node, the con-
                             firmed node and the random node. The weight on the edge is obtained by the
                             weight formula between nodes.
                               In predicting Vespa mandarinia propagation, we use a directed graph to record
                             the nodes that have been propagated and their propagation directions. When in-
                             itializing that digraph, we put all the nodes that have been confirmed to appear
                             Vespa mandarinia into a digraph. Searched for nodes that appeared in Vespa
                             mandarinia on a directed graph, and conducted propagation operations for each
                             of their neighboring nodes that did not appear in Vespa mandarinia.
                                A node that has been propagated at t has only a single opportunity to propa-
                             gate its neighbors at t + 1 .

DOI: 10.4236/oalib.1107345                          2                                   Open Access Library Journal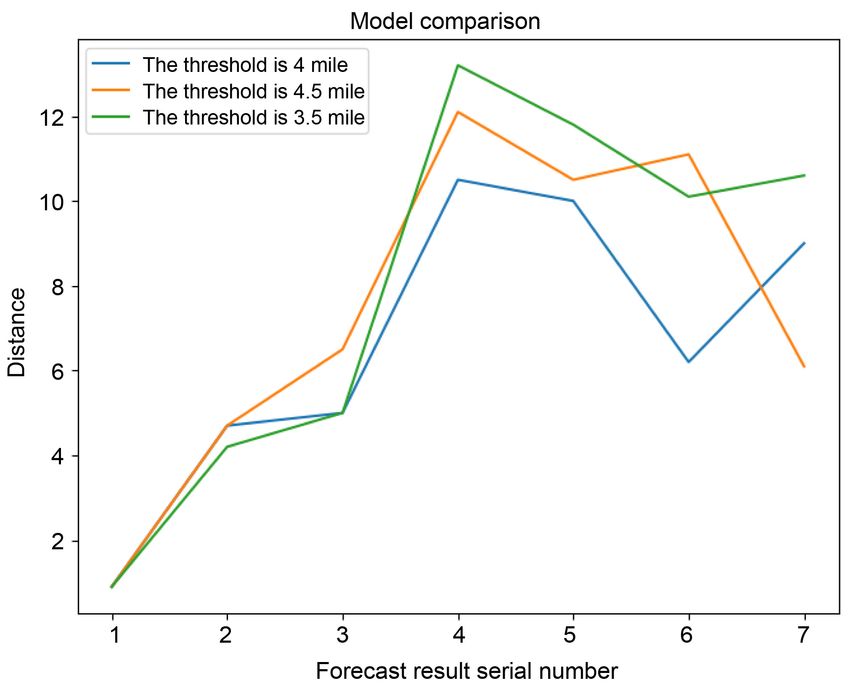
T. Zhou et al.
Assuming that node V is activated at t, for any neighbor w of V, the probabil-
ity that w is activated at t + 1 is Pvm .
The propagation diagram is shown below (Figure 1):
In the design of Pvm probabilities, We first need to consider the effect of dis-
tance on Vespa mandarinia migration [8]. The difficulty of migration of Vespa
mandarinia continues to rise as the distance increases. This in turn leads to
propagation that tends to be accomplished first at more distant nodes. ( x1 , y1 )
( x2 , y2 ) are latitude and longitude of two nodes, respectively. This was meas-
ured with the formula we formulated below:
x −x 2 y1 − y2
=L 2 R arcsin sin 2 1 2 + cos x1 cos x2 sin 2
2
Lmax − L
distScore =
Lmax
We need not only to consider the distScore obtained by the distance L be-
tween two nodes, but also the life habit of the Vespa mandarinia [9] [10]. Design
considerations incorporating this knowledge into Pvm probabilities are highly
advantageous for diffusion predictions. Through an in-depth exploration of the
habit of Vespa mandarinia, it was found to prefer activities at the water side.
This would be to bias Vespa mandarinia away from the water side more toward
migrating toward the water side. Therefore, we introduce the straight-line dis-
tance of the nodes from the water edge. Bias is a constant. The weight formula
for this term is shown below:
Sv + Bias
habitScore =
S w + Bias
We believe that the areas where Vespa mandarinia have been identified earlier
will have more Vespa mandarinia than the areas where Vespa mandarinia have
been identified later due to the continuous reproduction of Vespa mandarinia
[11] [12]. And the advantage of quantity makes the areas that have been con-
firmed earlier have stronger communication ability. Therefore, we set the prop-
agation index Eff for each node that has been propagated, and increase the pro-
pagation index of these nodes at the end of each round. The Pvm formula is shown
below:
S + Bias Lmax − L
=Pvm min v × Eff ,1
S + Bias
w Lmax
Propagation prediction for each round was performed as above, with nodes
Figure 1. Probability of node v propagating to node w.
DOI: 10.4236/oalib.1107345 3 Open Access Library Journal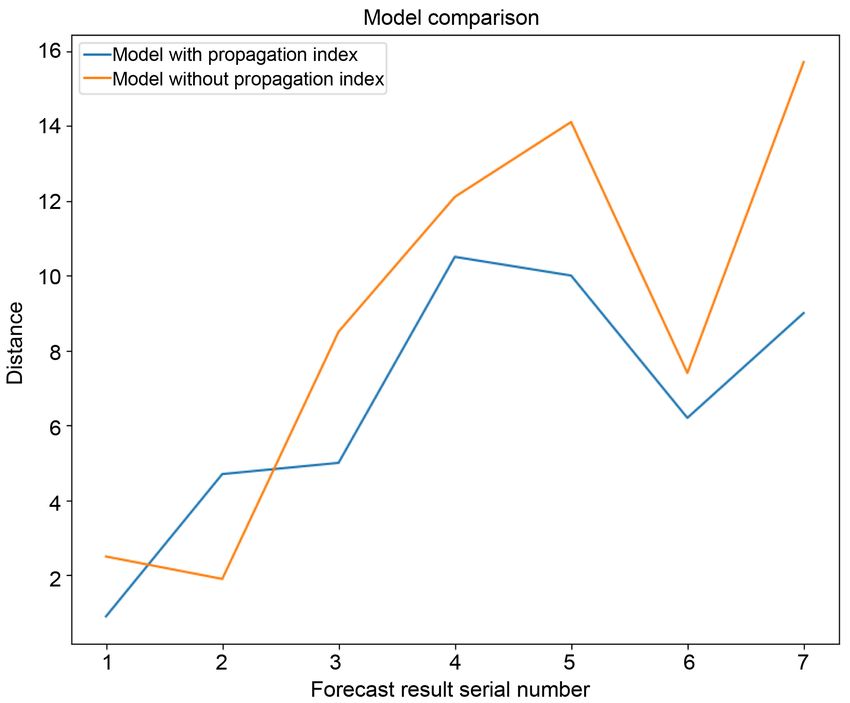
T. Zhou et al.

                             that were successfully propagated each round placed into a directed graph. In
                             the next round, these nodes that were propagated successfully also performed a
                             propagation operation on neighboring nodes to which they were not propagated.

                             3. Experiments
                             Our data set comes from the real Vespa mandarinia disaster in the United States
                             in 2020 [2]. In order to verify the correctness of the propagation model, we di-
                             vided fourteen confirmed Vespa mandarinia locations according to the time se-
                             quence. The first seven positions of Vespa mandarinia were used to predict the
                             position of Vespa mandarinia, and the last seven positions were used to verify
                             the prediction results. The quality of prediction results is measured by distance.
                             The time difference between the seventh node and the fourteenth node in the
                             dataset is about 150 days, while our model represents 50 days in a round of prop-
                             agation. Therefore, we take the result of three rounds of model propagation as
                             the prediction result. After three rounds, eight nodes are propagated, and we
                             compare the first seven with the verification set. The measurement results are
                             shown in the table below:
                                It can be seen from the Table 1 that the model has a good performance in
                             predicting the first few Vespa mandarinia occurrence sites. The first prediction
                             is only 0.903 miles away from the real data, and the average distance between the
                             first three predictions and the real data is 3.567 miles. This is because at the be-
                             ginning, the data obtained by the model are real and reliable. However, with the
                             increase of the number of propagation rounds, the proportion of the data gener-
                             ated by the model in all data increases. This leads to large data error, and con-
                             stantly in the accumulation. This brings the average distance between the seven
                             predictions and the real data to 6.657 miles.
                                We do sensitivity analysis on the threshold of node connection distance. By
                             changing the threshold value, we can see whether the model is stable. The com-
                             parison is shown below:
                                As can be seen from Figure 2, after changing the threshold, the prediction
                             results of the model are similar to those before changing the threshold, but the
                             effect decreases slightly. Therefore, it can be considered that our model is

                             Table 1. Comparison between predicted propagation point and real propagation point.

                                                         Label                        Prediction
                                  No.                                                                     Distance/mile
                                              Latitude           Longitude   Latitude        Longitude
                                   1         48.993892       −122.702242      48.98            −122.7         0.903
                                   2         48.927519       −122.745016      48.99            −122.7         4.775
                                   3         48.984269       −122.574809      48.93           −122.65         5.069
                                   4         48.979497       −122.581335      49.03            −122.8        10.507
                                   5         48.983375       −122.582465      49.01            −122.8        10.032
                                   6         48.984172       −122.57472       49.07           −122.62         6.286
                                   7         48.98422        −122.574726      49.01           −122.77         9.029

DOI: 10.4236/oalib.1107345                          4                                        Open Access Library Journal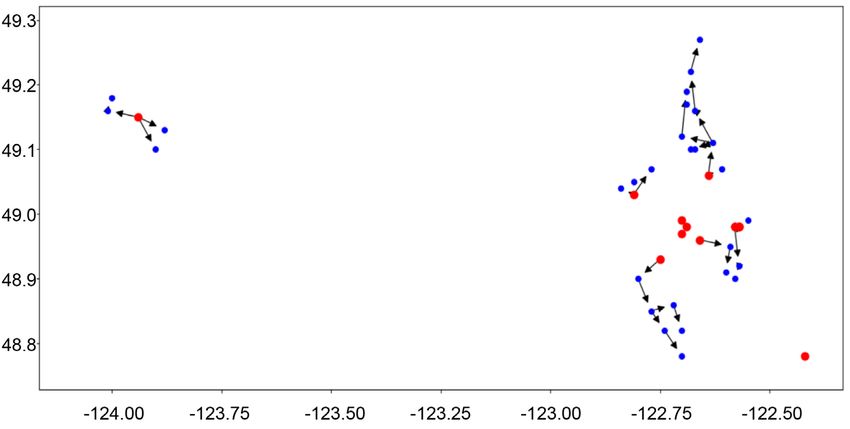
T. Zhou et al.
Figure 2. Sensitivity analysis of Vespa mandarinia propagation model for dis-
tance threshold parameters.
relatively stable. And the parameters we choose are almost optimal.
We also explore whether the communication index has a positive effect on the
model prediction. The blue curve in the figure below is the actual distance be-
tween the predicted result and the real result of the model considering the prop-
agation index, while the orange curve is the actual distance between the pre-
dicted result and the real result of the model not considering the propagation
index.
From Figure 3, we can see that the model considering the propagation index
performs better than the model not considering the propagation index for al-
most every predicted location. Therefore, the introduction of propagation index
is beneficial to the model.
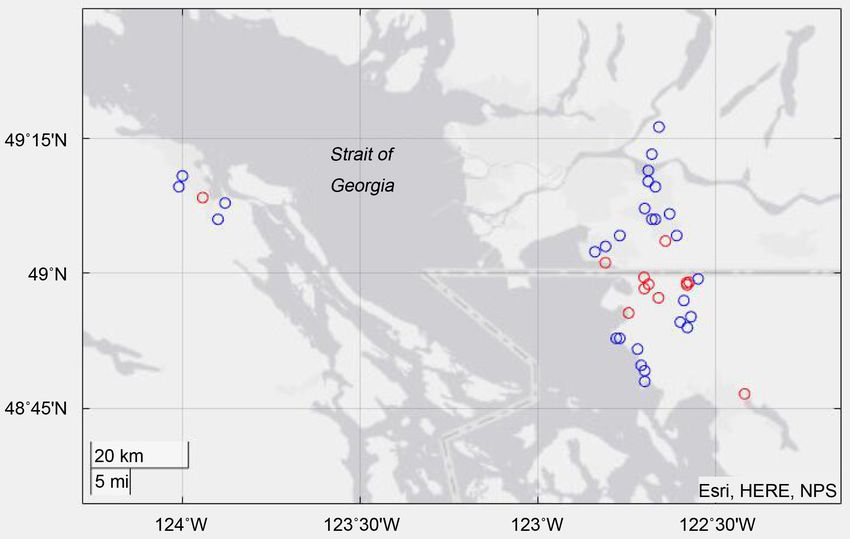
In our independent cascade propagation model. After the deduction and pre-
diction of the model, the prediction results after 100 days and 200 days are ob-
tained respectively. The results are shown in the Figure 4.
As can be seen from the above result diagram, Vespa mandarinia spread and
migrated to the nearby areas to a certain extent. There are some clusters of Ves-
pa mandarinia in the picture. This is because if there are many Vespa mandari-
nia in the vicinity of an area, it will have more chances to be spread. Because the
life habits of Vespa mandarinia are used to guide the propagation model, we can
see that the Vespa mandarinia migrate slowly to the water.
As can be seen from the diagram above (Figure 5), the Vespa mandarinia
have made further migration to the nearby areas. We can see that due to the en-
hancement of aggregation effect, more nodes are propagated in this iteration
than in the last one. That is, compared with the previous round, more Vespa
mandarinia were found in this round. We can also see that the Vespa mandarinia
DOI: 10.4236/oalib.1107345 5 Open Access Library JournalT. Zhou et al.
Figure 3. Error influence of propagation index on prediction propagation point.
Figure 4. Prediction of spatial and temporal distribution of Bumblebee after 100
days.
migrating to the water side continues to move to the water side, which makes its
migration path form a line in the picture.
We also draw the spread trend chart, we can see the trend of Vespa mandari-
nia spread more intuitively.
From the Figure 6, we can see how Vespa mandarinia propagate around step
by step, which can provide more targeted guidance for Vespa mandarinia con-
trol.
DOI: 10.4236/oalib.1107345 6 Open Access Library JournalT. Zhou et al.
Figure 5. Prediction of spatial and temporal distribution of Bumblebee after 200 days.
Figure 6. Diagram of Vespa mandarinia transmission after 200 days.
4. Conclusion
In this paper, we propose an independent cascade propagation model to predict
the propagation of Vespa mandarinia. It fully considered the habits and repro-
duction of Vespa mandarinia, and provided guidance for the prediction of propa-
gation model. The effectiveness of this guidance is verified by experiments. This
model can also be applied to the propagation of other pests to make the control
measures more effective.
Conflicts of Interest
The authors declare no conflicts of interest regarding the publication of this pa-
per.
References
[1] Kwon, O. and Choi, M.B. (2020) Interspecific Hierarchies from Aggressiveness and
DOI: 10.4236/oalib.1107345 7 Open Access Library JournalT. Zhou et al.
Body Size among the Invasive Alien Hornet, Vespa Velutina Nigrithorax, and Five
Native Hornets in South Korea. PLoS ONE, 15, e0226934.
https://doi.org/10.1371/journal.pone.0226934
[2] Wilson, T.M., Takahashi, J., Spichiger, S.E., et al. (2020) First Reports of Vespa man-
darinia (Hymenoptera: Vespidae) in North America Represent Two Separate Ma-
ternal Lineages in Washington State, United States, and British Columbia, Canada.
Annals of the Entomological Society of America, 4, 322-337.
https://doi.org/10.1093/aesa/saaa024
[3] Scarselli, F., Gori, M., Tsoi, A.C., et al. (2009) The Graph Neural Network Model.
IEEE Transactions on Neural Networks, 20, 61.
https://doi.org/10.1109/TNN.2008.2005605
[4] Baskararaja, G. and Manickavasagam, M. (2012) Subgraph Matching Using Graph
Neural Network. Journal of Intelligent Learning Systems and Applications, 4, 274-278.
https://doi.org/10.4236/jilsa.2012.44028
[5] Qiang, Z., Pasiliao, E.L. and Zheng, Q.P. (2019) Model-Based Learning of Informa-
tion Diffusion in Social Media Networks. Applied Network Science, 4, 80-82.
https://doi.org/10.1007/s41109-019-0215-3
[6] Saito, K., Nakano, R. and Kimura, M. (2008) Prediction of Information Diffusion
Probabilities for Independent Cascade Model. International Conference on Know-
ledge-Based Intelligent Information & Engineering Systems, Springer-Verlag.
[7] Ho, T.K.T., Bui, Q.V. and Bui, M. (2019) Information Diffusion on Complex Net-
works: A Novel Approach Based on Topic Modeling and Pretopology Theory. Viet-
nam Journal of Computer Science, 6, 285-309.
https://doi.org/10.1142/S2196888819500155
[8] Barrows, E. (2013) Habitat Abundances of a Cricket-Parasitizing Wasp Rhopaloso-
ma nearcticum (Hymenoptera: Rhopalosomatidae) in a United States Mid-Atlantic
park. Open Journal of Animal Sciences, 3, 311-313.
https://doi.org/10.4236/ojas.2013.34046
[9] Kojima, J.I., Hartini, S., Kahono, S., et al. (2002) Males, Mature Larvae, and Nests of
Ropalidia plebeja, a Nearly Solitary Paper Wasp Endemic to Sulawesi (Insecta: Hy-
menoptera: Vespidae), with Taxonomic Notes on the R. plebeja Group. Species Di-
versity: An International Journal for Taxonomy Systematics Speciation Biogeogra-
phy & Life History Research of Animals, 7, 1-28.
https://doi.org/10.12782/specdiv.7.1
[10] Phil, R. (1928) The Nesting Habits of the Wasp, Chalybion caeruleum. Annals of
the Entomological Society of America, 1, 25-35.
[11] Makino. Post-Hibernation Ovary Development in Queens of the Japanese Giant
Hornet Vespa mandarinia (Hymenoptera: Vespidae). Entomol, 19, 440-443.
https://doi.org/10.1111/ens.12205
[12] Takahashi, Akimoto, Martin, et al. (2004) Mating Structure and Male Production in
the Giant Hornet Vespa mandarinia (Hymenoptera: Vespidae). Applied Entomolo-
gy and Zoology, 39, 67-75.
DOI: 10.4236/oalib.1107345 8 Open Access Library JournalYou can also read