Modelling the Impact of Different COVID-19 Pandemic Waves on Real Estate Stock Returns and Their Volatility Using a GJR-GARCHX Approach: An ...
←
→
Page content transcription
If your browser does not render page correctly, please read the page content below
Journal of
               Risk and Financial
               Management

Communication
Modelling the Impact of Different COVID-19 Pandemic Waves
on Real Estate Stock Returns and Their Volatility Using a
GJR-GARCHX Approach: An International Perspective
Mateusz Tomal

                                          Department of Real Estate and Investment Economics, Cracow University of Economics, Rakowicka 27,
                                          31-510 Cracow, Poland; tomalm@uek.krakow.pl

                                          Abstract: This paper aims to investigate the impact of various COVID-19 pandemic waves on real
                                          estate stock returns and their volatility in developed (US, Australia), emerging (Turkey, Poland),
                                          and frontier (Morocco, Jordan) markets. A study using a GJR-GARCHX model revealed that the
                                          pandemic outbreak had a limited impact on real estate company stocks. The first pandemic wave
                                          only in the US caused a decline in stock returns. In turn, this was the case in Poland and Jordan
                                          during the second and third waves. Furthermore, in the aftermath of the pandemic development, an
                                          increase in the volatility of stock returns can be observed in the Polish financial market. However,

                                   this effect mainly applies to the period of the first disease wave.

Citation: Tomal, Mateusz. 2021.
                                          Keywords: real estate; stock returns; volatility; GJR-GARCHX; COVID-19
Modelling the Impact of Different
COVID-19 Pandemic Waves on Real
Estate Stock Returns and Their
Volatility Using a GJR-GARCHX
Approach: An International
                                          1. Introduction
Perspective. Journal of Risk and                The COVID-19 pandemic, one of the greatest humanitarian crises in recent years,
Financial Management 14: 374.             also caused distortions in economic activity (Jindřichovská and Uğurlu 2021), leading to a
https://doi.org/10.3390/                  recession in many countries. The emergence of the coronavirus had a significant impact
jrfm14080374                              on financial markets, as well. Namely, the COVID-19 pandemic lowered stock returns
                                          and increased their volatility (Baker et al. 2020). However, when considering the real
Academic Editors:                         estate sector, studies to date are inconclusive. For example, in the US, stocks of real estate
Irena Jindrichovska and
                                          companies drop significantly after the pandemic outbreak (Mazur et al. 2021). In contrast,
Anna Bialek-Jaworska
                                          in Australia and Turkey, the development of the pandemic did not result in changes in
                                          real estate stock returns (Öztürk et al. 2020; Narayan et al. 2021). This ambiguous impact
Received: 22 July 2021
                                          may be the effect of the relatively high resilience of some parts of the real estate sector
Accepted: 12 August 2021
                                          (e.g., the housing market) to the outbreak shock (Duca et al. 2021). In addition, the analysis
Published: 14 August 2021
                                          so far clearly shows that the influence of the pandemic on real estate stock returns and
                                          their volatility differs between countries, which is likely to be related to country-specific
Publisher’s Note: MDPI stays neutral
                                          financial market characteristics, as well as previous experiences of market participants to
with regard to jurisdictional claims in
published maps and institutional affil-
                                          similar pandemics and other crises (Milcheva 2021).
iations.
                                                The main objective of our study is to provide new evidence on the impact of various
                                          COVID-19 pandemic waves on real estate stock returns and their volatility. In order to
                                          accomplish this task, we use the GJR-GARCHX model, which, in addition to the capabilities
                                          of the standard GARCH model, allows to take into account the asymmetric impact of
                                          negative and positive shocks on volatility as well as offers the possibility of including extra
Copyright: © 2021 by the author.
                                          covariates in both the mean and the volatility equations.
Licensee MDPI, Basel, Switzerland.
                                                This study contributes to the current literature in several ways. First, unlike other
This article is an open access article
distributed under the terms and
                                          available analyses, this research seeks to indicate whether the impact of pandemic evolution
conditions of the Creative Commons
                                          on real estate stock returns during its various waves was changing. Second, while most
Attribution (CC BY) license (https://
                                          works focus on examining real estate stock returns in a single country, this study considers
creativecommons.org/licenses/by/          economies with different levels of development to understand the surveyed phenomenon
4.0/).                                    from an international perspective. Specifically, this analysis looks at the financial markets in

J. Risk Financial Manag. 2021, 14, 374. https://doi.org/10.3390/jrfm14080374                                 https://www.mdpi.com/journal/jrfm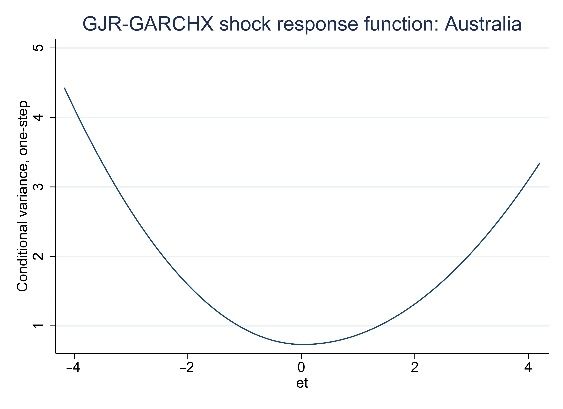
J. Risk Financial Manag. 2021, 14, 374                                                                                               2 of 9

                                         the US, Australia, Turkey, Morocco, Jordan, and Poland, and to the best of our knowledge
                                         for the latter two countries this is the first study of its kind. Finally, the issues addressed
                                         in this paper are still very vital due to the inconclusive results of previous research and
                                         dynamically changing trends in financial markets worldwide.

                                         2. Data and Software
                                                The analysis covers the period from March 2020 to April 2021 and concerns developed
                                         (US, Australia), emerging (Poland, Turkey), and frontier (Morocco, Jordan) markets. As
                                         a proxy of pandemic development, we apply the percentage change in COVID-19 new
                                         daily cases. Furthermore, in order to assess to what extent, the different pandemic waves
                                         affected stock returns and their volatility, we split the period under study into two. The
                                         first includes the first coronavirus wave from March 2020 to September 2020 and the second
                                         period from October 2020 to April 2021, during which the second and third waves of the
                                         pandemic occurred (see Figure 1). The analysis also uses time series on returns of real
                                         estate stocks and country-specific major stock market indices, which serve as regressands
                                         and controls, respectively. All time series are stationary (test results available upon request)
                                         and have been collected from Investing (https://www.investing.com, accessed on 5 May
                                         2021) and (Dong et al. 2020). Table 1 provides details of the country-specific data used for
                                         the analysis. Stata 14.1 software is used to perform all planned research tasks.

                                                            Table 1. Data description.

                                                Dependent Variable                                Control       Period
    Country                                                                                                                      N
                              Index                 S          K        Shapiro–Wilk Test         Variable     Analyzed
                                                                                                                2 March
                      S&P 500 Real Estate                                                         S&P 500
        US                                        −1.45      12.90            p < 0.01                          2020–30         295
                           returns                                                                returns
                                                                                                               April 2021
                                                                                                                2 March
                      S&P/ASX 200 Real                                                           S&P/ASX
    Australia                                     −1.52      10.31            p < 0.01                          2020–30         293
                        Estate returns                                                           200 returns
                                                                                                               April 2021
                                                                                                                9 March
                        WIG Real Estate
     Poland                                       −0.65       4.25            p < 0.01           WIG returns    2020–30         288
                           returns
                                                                                                               April 2021
                                                                                                               16 March
                       BIST Real Estate                                                           BIST 100
     Turkey                                       −0.73       3.40            p < 0.01                          2020–30         284
                     Invest Trusts returns                                                         returns
                                                                                                               April 2021
                                                                                                 FTSE CSE      11 March
                     Real Estate (IMMOB)
    Morocco                                       −0.32       2.35            p < 0.01           Morocco 15     2020–30         285
                            returns
                                                                                                  returns      April 2021
                                                                                                 Amman SE       10 May
                     Real Estate (AMREX)
     Jordan                                        0.26       0.70            p > 0.10            All Share     2020–29         237
                            returns
                                                                                                   returns     April 2021
                                                     Note: S means skewness, K means kurtosis.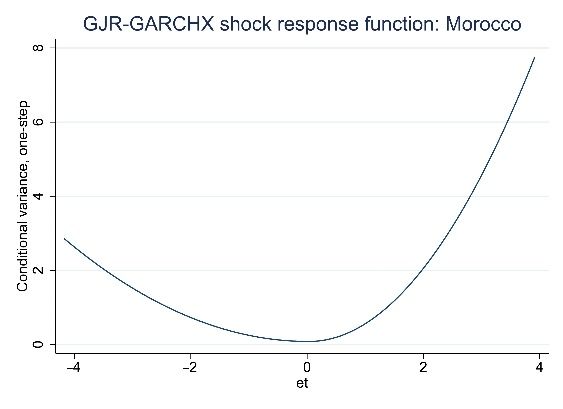
J. Risk Financial Manag. 2021, 14, 374 3 of 9
US Australia
350,000 2.00 800 4.00
300,000 1.50 700 3.00
600
250,000 1.00 2.00
500
200,000 0.50 1.00
400
150,000 0.00 0.00
300
100,000 –0.50 –1.00
200
50,000 –1.00 100 –2.00
0 –1.50 0 –3.00
Daily COVID-19 new cases (left axis) The percentage of change in COVID-19 new cases (right axis) Daily COVID-19 new cases (left axis) The percentage of change in COVID-19 new cases (right axis)
Poland Turkey
40,000 2.50 70,000 3.00
35,000 2.00 2.50
60,000
1.50
30,000 2.00
50,000
1.00
25,000 1.50
0.50 40,000
20,000 1.00
0.00 30,000
15,000 0.50
–0.50
20,000
10,000 0.00
–1.00
5,000 10,000 –0.50
–1.50
0 –2.00 0 –1.00
Daily COVID-19 new cases (left axis) The percentage of change in COVID-19 new cases (right axis) Daily COVID-19 new cases (left axis) The percentage of change in COVID-19 new cases (right axis)
Morocco Jordan
7000 3.00 10000 3.00
9000
6000 2.00 2.00
8000
5000 7000
1.00 1.00
6000
4000
0.00 5000 0.00
3000
4000
–1.00 –1.00
2000 3000
2000
1000 –2.00 –2.00
1000
0 –3.00 0 –3.00
Daily COVID-19 new cases (left axis) The percentage of change in COVID-19 new cases (right axis) Daily COVID-19 new cases (left axis) The percentage of change in COVID-19 new cases (right axis)
Figure 1. The development of COVID-19 in the studied countries.
3. Methodology
It is widely accepted in the academic literature to model stock returns and their
volatility using the generalized autoregressive conditional heteroskedasticity (GARCH)
model, which does not assume linearity, independence, and constant conditional variance.
This model consists of two equations, namely a mean and a conditional variance equation.
Based on the above model, the GARCHX approach was developed to allow for additional
covariates in both equations.
Our starting point for estimating a GARCH-based model is an ARMA(p, q) returns
process to calculate uncorrelated errors (see, for example, Apergis and Apergis 2020).
Next, we use the GJR-GARCH(1,1) approach developed by (Glosten et al. 1993) to account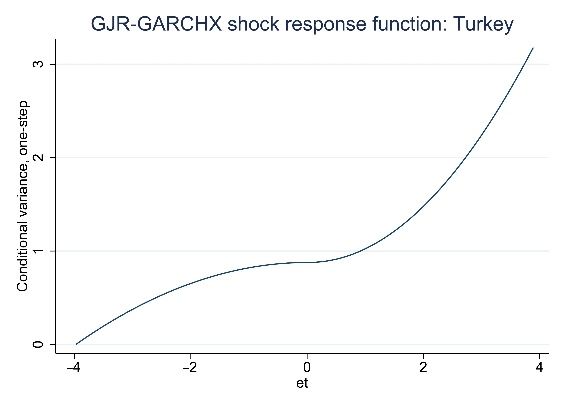
J. Risk Financial Manag. 2021, 14, 374                                                                                              4 of 9

                                         for the potential asymmetric impact of various economic shocks on volatility. Finally,
                                         including additional covariates describing the pandemic, our model under Stata software
                                         parametrization of GJR-GARCHX looks as follows:
                        p                 q
           rt = ϕ + ∑ φi rt−i +          ∑ θ j ε t− j + ϑControl + δ1 COV ID19 + δ2 CWave23 + δ3 COV ID19 × CWave23 + ε t             (1)
                       i =1              j =1

         ht = βε2t−1 + ρI (ε t−1 > 0)ε2t−1 + γht−1 + exp(α + µ1 COV ID19 + µ2 CWave23 + µ3 COV ID19 × CWave23)                        (2)
                                         where √I (ε t−1 > 0) is an indicator function, which is equal to 1 if ε t−1 > 0, and 0 otherwise,
                                         ε t = ht et with et ∼ iid( GED or N ). Moreover, the above model should meet the restric-
                                         tion that β + γ + 21 ρ < 1, which indicates that conditional volatility is stationary. Due to the
                                         fact that real estate stock returns are characterized by high kurtosis (except for the Jordan
                                         data) and low skewness (see Table 1), we employ a GJR-GARCHX model with a symmetric
                                         generalized error distribution (GED). The exception here is the model for Jordan, in which
                                         a normal distribution for the disturbances is assumed. These assumptions are supported
                                         by the Shapiro-Wilk test results shown in Table 1.
                                               In our GJR-GARCHX(1,1) model, the COVID19 variable represents the percentage
                                         change in the number of new cases and is intended to capture the impact of the pandemic
                                         development during its first wave on stock returns and their volatility. In contrast, the
                                         CWave23 covariate is a dummy variable taking the value 1 for observations from October
                                         2020 to April 2021, i.e., occurring during the second and third pandemic waves. Finally, by
                                         including the COVID19 × CWave23 interaction variable, it is possible to test whether the
                                         pandemic impact on stock returns and their volatility varied during its successive waves.
                                               Stata uses the method of maximum likelihood (ML) estimation to determine the
                                         parameters of the GJR-GARCHX model. Specifically, Stata employs a mixed algorithm to
                                         maximize the log-likelihood function, i.e., the first five iterations are performed applying
                                         the Berndt-Hall-Hall-Hausman algorithm and the next 10 iterations utilize the Broyden-
                                         Fletcher-Goldfarb-Shanno algorithm, after which the process is repeated (Charles and
                                         Darné 2019). As noted by (Lombardi and Gallo 2002), this type of approach can improve
                                         the model performance in terms of root mean square error.

                                         4. Results and Discussion
                                              The estimation results of the GJR-GARCHX models are presented in Table 2. First,
                                         the obtained coefficients satisfy the required condition, i.e., β + γ + 12 ρ < 1 indicating the
                                         stationarity of the conditional volatility. Second, the ARCH effect does not characterize
                                         Jordan’s data. Therefore, only the mean equation was estimated for this country. Third,
                                         among all models, the control variable is positively correlated with the dependent variable.
                                              The results reveal that the pandemic development during its first wave negatively
                                         affects the stock returns only in the US, while in Poland and Jordan during the second and
                                         third waves. In the remaining countries, there is no significant impact of the pandemic
                                         on the level of real estate stock returns. The above estimates are in full agreement with
                                         other studies analysing real estate stock returns in the US (Thorbecke 2020), Australia
                                         (Huynh et al. 2021), and Turkey (Öztürk et al. 2020). On the other hand, the results we
                                         obtained in the context of the financial market in Morocco contradict those presented
                                         by (Khalil 2021; Janndi and Moussamir 2021). These authors found that the pandemic
                                         negatively affected the real estate stock indices in Morocco.
J. Risk Financial Manag. 2021, 14, 374 5 of 9
Table 2. Estimates of GJR-GARCH models.
Variable US Australia Poland Turkey Morocco Jordan
Mean equation
Constant 0.000144 −0.000108 −0.001248 0.001766 0.001815 0.000765
Control 1.031600 *** 1.112680 *** 0.512053 ** 1.034670 *** 0.951915 *** 0.270696 ***
COVID19 −0.015908 *** −0.000398 0.002723 0.004504 0.001545 0.000430
CWave23 0.000260 −0.000237 0.002930 ** −0.002585 0.001285 −0.000099
COVID19 × CWave23 0.009304 0.001947 −0.007845 ** 0.000040 −0.001064 −0.003241 *
Diagnostics
q 2 3 2 3 2 1
p 3 3 2 2 1 0
Joint significance † p < 0.01 p > 0.10 p < 0.05 p > 0.10 p > 0.10 p > 0.10
ARCH effect p < 0.01 p < 0.01 p < 0.01 p < 0.05 p < 0.01 p > 0.10
Conditional volatility equation
Constant −9.544025 *** −11.174630 −10.019260 *** −12.093360 *** −8.776888 *** NA
***
COVID19 0.999685 1.020167 2.187499 *** 0.793015 0.007589 NA
CWave23 −0.410830 −0.741840 −0.256941 0.884779* −0.473977 ** NA
COVID19 × CWave23 −4.289059 * −2.223724 −2.434554 * −0.408110 0.172183 NA
β 0.072690 0.212285 ** 0.100403 −0.054744 0.156881 NA
ρ 0.159656 −0.064464 0.044493 0.209003 ** 0.351020 NA
γ 0.278839 0.732480 *** 0.428604 *** 0.878622 *** 0.080777 NA
Diagnostics
Joint significance † p < 0.05 p > 0.10 p < 0.01 p < 0.10 p > 0.10 NA
Joint significance ‡ p < 0.05 p < 0.01 p < 0.01 p < 0.01 p < 0.10 NA
GED shape parameter 2.003883 1.723155 1.530436 1.633107 1.571219 NA
β + γ + 12 ρ 0.431358 0.912532 0.551254 0.928379 0.413168 NA
Log–likelihood 945.4581 905.1113 917.9927 867.1617 820.9228 NA
N 295 293 288 284 285 237
Note: NA means not applicable. Significant at * 0.10; ** 0.05; *** 0.01 level. † The test was executed for parameters generated for COVID19,
CWave23, and COVID19 × CWave23 covariates. ‡ The test was executed for parameters β, ρ, and γ.
Analysing the estimated parameters for the conditional volatility equation, one may
notice that they are similar to those generated for the mean equation. In particular, there is
some evidence that in the period immediately after the epidemic outbreak, the development
of the disease caused a rise in the volatility of real estate stock returns only in Poland. These
results are consistent with the research done by (Buszko et al. 2021), who, using simple
measures based on the standard deviation, observed an increase in the volatility of the
WIG Real Estate index listed on the Warsaw Stock Exchange during the first wave of the
pandemic. In turn, in subsequent waves in Poland, one can see a significant reduction of
the pandemic impact on the volatility of stock returns, similar to what happened in the US.
Examining the results presented in Table 2, it should also be noted that in most
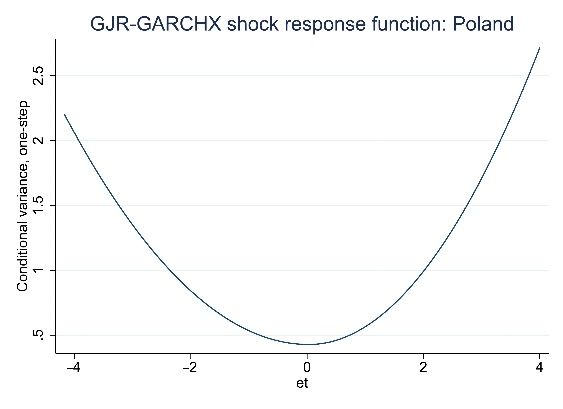
countries the impact of positive and negative shocks on volatility is quite similar. Only in
Turkey it is clear that an unexpected increase in real estate stock returns has the destabilizing
effect leading to elevated conditional variance (Figure 2).
The significant influence of the COVID-19 pandemic on real estate stock returns,
particularly in the US and Poland, can be explained for several reasons. In the US context,
it should be noted that the current crisis shows some similarities to the one in 2007–2008,
which caused significant declines in US stock markets. For example, in March 2020, the
spread between the yield on corporate bonds and 10-year US treasury bonds was wider
than during the financial crisis that started 14 years ago. Moreover, especially during the
first wave, the mortgage market froze, and banks started to increase credit requirements.
In the case of Poland, the substantial impact of the pandemic on stock returns during its
second and third waves may be due to the fact that the government introduced very far-
reaching restrictions in this period (Tomal and Marona 2021). At the same time, however,
the impact strength of the pandemic on the volatility of stock returns in Poland decreased,
which indicate that market participants in the wake of the increased incidence of the disease
tried to limit their actions in the stock market compared to the period of the first wave.reduction of the pandemic impact on the volatility of stock returns, similar to what hap-
pened in the US.
Examining the results presented in Table 2, it should also be noted that in most coun-
tries the impact of positive and negative shocks on volatility is quite similar. Only in Tur-
J. Risk Financial Manag. 2021, 14, 374key it is clear that an unexpected increase in real estate stock returns has the destabilizing
6 of 9
effect leading to elevated conditional variance (Figure 2).
Figure 2. GJR-GARCHX shock response functions for the studied countries.
Figure 2. GJR-GARCHX shock response functions for the studied countries.
In contrast, the lack of significant impact of the COVID-19 pandemic on real estate
stock returns in other countries is due to a variety of reasons. In the case of Australia, this
absence is likely to result from the assistance provided by the government to the property
sector, which consists of such things as commercial tenant relief, tax breaks for property
owners or financial assistance to build or buy a home (Huynh et al. 2021). In Turkey, on
the other hand, the resilience of the real estate financial market can be explained by the
very strong demand for residential properties generated by foreigners. In particular, as
(Ahsan and Sadak 2021) point out, the number of housing transactions declined in April
and May 2020 and then increased dramatically as a result of lowering interest rates and
launching government stimulus packages. A similar situation can be observed in the
Moroccan real estate market, where, despite the ongoing pandemic, interest in the purchase
of properties by foreigners is still very high, which is also due to very liberal regulations on
the acquisition of dwellings by aliens (Prevost 2021).
5. Robustness Checks
GARCH-type models depend on the initial values of the coefficients (Zivot 2009). It
may be that the estimated parameters correspond to local rather than global maximums.
Therefore, in order to check the stability of the estimates presented in Table 2, we re-
estimated GJR-GARCHX models for all the countries under study by changing the initial
coefficient values beforehand. Specifically, the parameters estimated in Table 2 were used asJ. Risk Financial Manag. 2021, 14, 374 7 of 9
a starting point and then increased or decreased by 5%, 10%, 15%, 20% or 25%, respectively.
No significant change in the generated parameters was observed in any of the analyzed
cases.
Furthermore, the GJR-GARCH model is only one of several GARCH-type models
that accounts for the asymmetric impact of positive and negative shocks. Taking this
into account, the following asymmetric models were additionally estimated to confirm
the reliability of the baseline results: The EGARCH of Nelson (1991), the SAARCH of
Engle (1990), and the TARCH of Zakoian (1994). The estimation results of the new models
(Table 3) are consistent with those presented in Table 2 which confirms the robustness of
the baseline GJR-GARCHX models.
Table 3. Estimates of additional asymmetric GARCH-type models.
Variable US Australia Poland Turkey Morocco Jordan
Conditional volatility equation (EGARCHX)
Constant −4.055683 * −0.576225 −6.666113 −13.101910 *** −4.837369 ** NA
COVID19 0.701977 0.395548 * 0.200734 0.501505 −0.237770 NA
CWave23 −0.115050 −0.059870 −0.484480 −0.343260 −0.012890 NA
COVID19 × CWave23 −2.463610 ** −0.480260 −0.410610 −0.791810 −0.047360 NA
Joint significance † p > 0.10 p > 0.10 p > 0.10 p > 0.10 p > 0.10 NA
Log–likelihood 945.9369 905.5441 915.6624 863.0055 820.4674 NA
Conditional volatility equation (SAARCHX)
Constant −9.553358 *** −11.198190 *** −9.994610 *** −8.851563 *** NA
COVID19 1.013982 1.024124 2.162423 *** Not enough 0.041785 NA
CWave23 −0.445330 * −0.738190 −0.261250 observations −0.424921 * NA
COVID19 × CWave23 −3.858470 * −2.235790 −2.380910 * to estimate the 0.080146 NA
Joint significance † p < 0.05 p > 0.10 p < 0.01 model p > 0.10 NA
Log–likelihood 945.767 905.0433 917.945 821.1242 NA
Conditional volatility equation (TARCHX)
Constant −9.234961 *** −11.165170 *** −10.04424 *** −9.478187 *** −8.845685 *** NA
COVID19 0.983270 1.033758 2.203767 *** 0.497031 0.013858 NA
CWave23 −0.521980 ** −0.762210 −0.267080 0.323462 −0.445720 * NA
COVID19 × CWave23 −2.537060 * −2.365700 −2.538890 * 0.963047 0.175666 NA
Joint significance † p < 0.01 p > 0.10 p < 0.01 p < 0.10 p > 0.10 NA
Log–likelihood 945.845 904.2689 918.9061 864.776 821.3933 NA
N 295 293 288 284 285 237
Note: NA means not applicable. Significant at * 0.10; ** 0.05; *** 0.01 level. † The test was executed for parameters generated for COVID19,
CWave23, and COVID19 × CWave23 covariates. Only the results for the conditional variance equation are provided since following Jiang
(2012) the GARCH-type models are estimated for ε̂ t from Equation (1).
6. Conclusions
Research shows that the impact of the pandemic on real estate stock returns varies
both spatially and temporally. The pandemic outbreak was felt most strongly in the US and
Poland financial markets, where an increase in infections caused a decline in stock returns
and for the latter country increased their volatility. However, during the second and third
waves of infections, only Poland and Jordan showed a negative correlation between the
growth in the number of daily cases and the dependent variable. Looking at the results as
a whole, we can say that, similarly to earlier studies, the real estate sector demonstrates a
high resilience to the shock of the coronavirus outbreak.
This study has several limitations that are related to both data availability and method-
ological issues. In particular, due to the relatively short time series used in this study,
it was not possible to use the high-order GJR-GARCHX model, which could potentially
better explain the volatility of the analyzed real estate stock returns. In addition, the
data we examined show little skewness, therefore, future research may consider the GJR-
GARCHX model with the skewed GED. Additionally, further investigations can apply a
panel GARCH model to control for the prospective dependence between real estate stock
returns in different countries. Finally, it is also important to test how the currently observed
fourth wave of the pandemic caused by the delta variant affects stock markets.J. Risk Financial Manag. 2021, 14, 374 8 of 9
The results obtained in this study are important for all actors involved in the func-
tioning of the stock market, including investors, portfolio managers, companies, and
policy-makers. The latter can successfully limit or completely minimize the impact of
the pandemic on the real estate sector through appropriate monetary or fiscal actions, as
demonstrated by the experience of the countries analyzed in this paper.
Funding: The publication is financed by a subsidy granted to the Cracow University of Economics.
Institutional Review Board Statement: Not applicable.
Informed Consent Statement: Not applicable.
Data Availability Statement: Data is available upon request.
Conflicts of Interest: The author declares no conflict of interest.
References
Ahsan, Md Moynul, and Cihan Sadak. 2021. Exploring housing market and urban densification during COVID-19 in Turkey. Journal of
Urban Management. [CrossRef]
Apergis, Nicholas, and Emmanuel Apergis. 2020. The role of Covid-19 for Chinese stock returns: Evidence from a GARCHX model.
Asia-Pacific Journal of Accounting & Economics, 1–9. [CrossRef]
Baker, Scott, Nicholas Bloom, Steven Davis, Kyle Kost, Marco Sammon, and Tasaneeya Viratyosin. 2020. The Unprecedented Stock
Market Reaction to COVID-19. The Review of Asset Pricing Studies 10: 742–58. [CrossRef]
Buszko, Michał, Witold Orzeszko, and Marcin Stawarz. 2021. COVID-19 pandemic and stability of stock market—A sectoral approach.
PLoS ONE 16: e0250938. [CrossRef] [PubMed]
Charles, Amélie, and Olivier Darné. 2019. The accuracy of asymmetric GARCH model estimation. International Economics 157: 179–202.
[CrossRef]
Dong, Ensheng, Hongru Du, and Lauren Gardner. 2020. An interactive web-based dashboard to track COVID-19 in real time. The
Lancet Infectious Diseases 20: 533–34. [CrossRef]
Duca, John, Martin Hoesli, and Joaquim Montezuma. 2021. The resilience and realignment of house prices in the era of Covid-19.
Journal of European Real Estate Research. [CrossRef]
Engle, Robert. 1990. Stock volatility and the crash of’87: Discussion. The Review of Financial Studies 3: 103–6. [CrossRef]
Glosten, Lawrence, Ravi Jagannathan, and David Runkle. 1993. On the Relation between the Expected Value and the Volatility of the
Nominal Excess Return on Stocks. The Journal of Finance 48: 1779–801. [CrossRef]
Huynh, Nhan, Dat Nguyen, and Anh Dao. 2021. Sectoral Performance and the Government Interventions during COVID-19 Pandemic:
Australian Evidence. Journal of Risk and Financial Management 14: 178. [CrossRef]
Janndi, Widad, and Abdelhak Moussamir. 2021. Stock market reactions to COVID-19: Evidence from Morocco. International Journal of
Management Sciences 4: 579–93.
Jiang, Wei. 2012. Using the GARCH Model to Analyse and Predict the Different Stock Markets. Masters’ dissertation, Department of
Statistics, Uppsala University, Uppsala, Sweden.
Jindřichovská, Irena, and Erginbay Uğurlu. 2021. EU and China trends in trade in challenging times. Journal of Risk and Financial
Management 14: 71. [CrossRef]
Khalil, Nait. 2021. The COVID-190 s Spillover Effects on Industry Indices Returns: Evidence from Casablanca Stock Exchange. African
Scientific Journal 3: 505–24.
Lombardi, Marco, and Giampiero Gallo. 2002. Analytic Hessian matrices and the computation of FIGARCH estimates. Statistical
Methods and Applications 11: 247–64. [CrossRef]
Mazur, Mieszko, Man Dang, and Miguel Vega. 2021. COVID-19 and the march 2020 stock market crash. Evidence from S&P1500.
Finance Research Letters 38: 101690. [CrossRef] [PubMed]
Milcheva, Stanimira. 2021. Volatility and the Cross-Section of Real Estate Equity Returns during Covid-19. The Journal of Real Estate
Finance and Economics, 1–28. [CrossRef]
Narayan, Paresh, Qiang Gong, and Huson Ahmed. 2021. Is there a pattern in how COVID-19 has affected Australia’s stock returns?
Applied Economics Letters. [CrossRef]
Nelson, Daniel. 1991. Conditional heteroskedasticity in asset returns: A new approach. Econometrica: Journal of the Econometric Society
59: 347–70. [CrossRef]
Öztürk, Özkan, Muhammet Şişman, Hakan Uslu, and Ferhat Çıtak. 2020. Effect of COVID-19 outbreak on Turkish stock market: A
sectoral-level analysis. Hitit University Journal of Social Sciences Institute 13: 56–68.
Prevost, Lisa. 2021. House Hunting in Morocco: A Marrakesh Riad for Under $500,000. The New York Times. Available online: https:
//www.nytimes.com/2021/05/12/realestate/house-hunting-in-morocco-a-marrakesh-riad-for-under-500000.html (accessed on
5 August 2021).
Thorbecke, Willem. 2020. The impact of the COVID-19 pandemic on the US Economy: Evidence from the stock market. Journal of Risk
and Financial Management 13: 233. [CrossRef]J. Risk Financial Manag. 2021, 14, 374 9 of 9
Tomal, Mateusz, and Bartłomiej Marona. 2021. The Impact of the COVID-19 Pandemic on the Private Rental Housing Market in
Poland: What Do Experts Say and What Do Actual Data Show? Critical Housing Analysis 8: 24–35. [CrossRef]
Zakoian, Jean-Michel. 1994. Threshold heteroskedastic models. Journal of Economic Dynamics and Control 18: 931–55. [CrossRef]
Zivot, Eric. 2009. Practical issues in the analysis of univariate GARCH models. In Handbook of Financial Time Series. Berlin and
Heidelberg: Springer, pp. 113–55. [CrossRef]You can also read