Multiple Spatial Coordinates Influence the Prediction of Tactile Events Facilitated by Approaching Visual Stimuli
←
→
Page content transcription
If your browser does not render page correctly, please read the page content below
Multisensory Research 34 (2021) 531–551                                   brill.com/msr

Multiple Spatial Coordinates Influence the Prediction of
Tactile Events Facilitated by Approaching Visual Stimuli

                                               Tsukasa Kimura ∗
The Institute of Scientific and Industrial Research (ISIR), Osaka University, Ibaraki, 567-0047,
                                              Japan
                     Received 2 October 2020; accepted 23 February 2021

Abstract
Interaction with other sensory information is important for prediction of tactile events. Recent stud-
ies have reported that the approach of visual information toward the body facilitates prediction of
subsequent tactile events. However, the processing of tactile events is influenced by multiple spatial
coordinates, and it remains unclear how this approach effect influences tactile events in different spa-
tial coordinates, i.e., spatial reference frames. We investigated the relationship between the prediction
of a tactile stimulus via this approach effect and spatial coordinates by comparing ERPs. Participants
were asked to place their arms on a desk and required to respond tactile stimuli which were presented
to the left (or right) index finger with a high probability (80%) or to the opposite index finger with
a low probability (20%). Before the presentation of each tactile stimulus, visual stimuli approached
sequentially toward the hand to which the high-probability tactile stimulus was presented. In the
uncrossed condition, each hand was placed on the corresponding side. In the crossed condition, each
hand was crossed and placed on the opposite side, i.e., left (right) hand placed on the right (left) side.
Thus, the spatial location of the tactile stimulus and hand was consistent in the uncrossed condition
and inconsistent in the crossed condition. The results showed that N1 amplitudes elicited by high-
probability tactile stimuli only decreased in the uncrossed condition. These results suggest that the
prediction of a tactile stimulus facilitated by approaching visual information is influenced by multiple
spatial coordinates.
Keywords
prediction, crossing the hands, spatial coordinate, tactile remapping, ERP

1. Introduction
Interaction with other sensory information is important for tactile process-
ing. Physical contact with dangerous objects often hurts our body. We can

 *   E-mail: kimura@ai.sanken.osaka-u.ac.jp

© Kimura, 2021                                                                          DOI:10.1163/22134808-bja10045
This is an open access article distributed under the terms of the CC BY 4.0 license.

                                                                                  Downloaded from Brill.com09/03/2021 04:57:04PM
                                                                                                                   via free access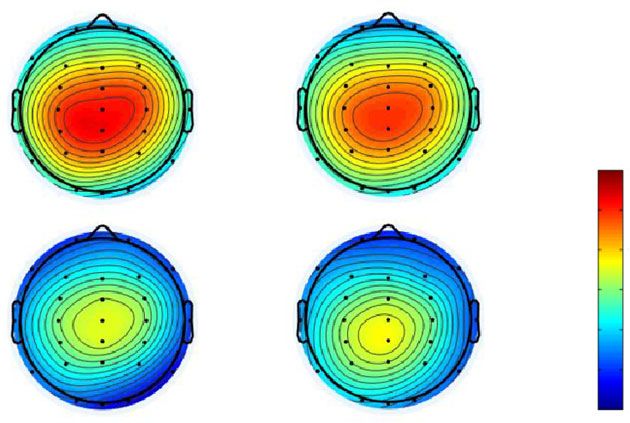
532              T. Kimura / Multisensory Research 34 (2021) 531–551

avoid dangerous objects and protect our bodies by predicting ‘where’, ‘when’,
and ‘what’ tactile events will occur prior to contact; however, predicting these
events is difficult in the tactile modality, because tactile sensation is evoked
after physical contact has occurred. Therefore, it is thought that the prediction
of tactile events is enabled by using other sensory information. In particular,
many studies have reported that visual information influences the processing
of subsequent tactile sensation (for a review, see Spence, 2010).
   In addition, recent electrophysiological studies reported that prior visual
stimuli approaching the body facilitate prediction spatially, temporally, and
in terms of the type (i.e., ‘where’, ‘when’, and ‘what’) of subsequent tactile
events (Kimura and Katayama, 2015, 2017, 2018). In a study by Kimura and
Katayama (2015), participants were instructed to respond to a tactile stim-
ulus to the hand; the left (or right) hand usually received the stimulus, and
the opposite hand rarely received it. Before the tactile stimuli were presented,
visual stimuli approached the hand where the tactile stimuli were frequently
presented, or they did not move; e.g., if the frequent tactile stimulus was pre-
sented to the left hand, visual stimuli were presented from the right to the
left in the approach situation. The comparison of event-related brain poten-
tials (ERPs) for tactile stimuli showed that the approaching visual stimuli
facilitated the prediction of tactile stimuli presented on the approach side and
increased the deviant response for the opposite side. This approach effect of
the visual and the tactile also facilitated prediction of timing and type (Kimura
and Katayama, 2017, 2018). These studies suggest that the spatial relationship
between external visual information and the body is important for the predic-
tion of tactile events.
   The previous studies reported that the approach of visual information facili-
tates the prediction of subsequent tactile events; however, it is unclear how this
approach effect influences tactile events in different spatial coordinates (i.e.,
spatial reference frames). The processing of tactile events is influenced by
multiple spatial coordinates. In particular, the hands relate to body-centered
coordinates (i.e., anatomical sagittal midline-based spatial frame) and body
parts-centered coordinates (i.e., skin-based spatial frame; see Heed et al., 2015
for a review). In the majority of situations, our left (right) hand operates on the
left (right) side of the workspace, and the body parts-centered coordinate and
the body-centered coordinate are congruent; however, we can move the left
(right) hand to the right (left) side (i.e., the opposite side) because hands are
mobile sensory organs. For example, we can use our right hand to pick up
an object on the left side if we cannot use our left hand, and we can hit a
right-side tennis ball back with our left backhand. In this situation, the body
parts-centered coordinate and the body-centered coordinate are incongruent,
and the processing of tactile events is influenced by this spatial coordinate mis-
match. For example, many studies reported that crossing the hands impaired

                                                          Downloaded from Brill.com09/03/2021 04:57:04PM
                                                                                           via free access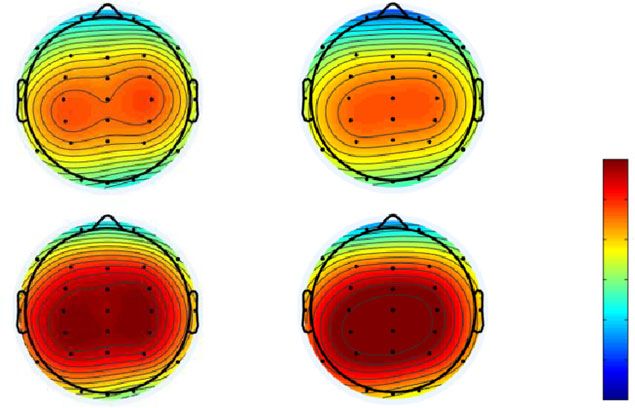
T. Kimura / Multisensory Research 34 (2021) 531–551                       533

performance on tactile temporal-order judgment (TOJ) tasks (e.g., Heed et al.,
2012; Shore et al., 2002; Yamamoto and Kitazawa, 2001). In addition, several
studies reported that this crossing-the-hands effect also occurs between a prior
visual cue (or distractor) and a subsequent tactile target (e.g., Holmes et al.,
2006; Spence et al., 2004). These crossing-the-hands effects may be explained
by theories of touch remapping (see Heed and Azañón, 2014 for a review). For
example, we refer to a body-centered coordinate first and then remap it to a
body parts-centered coordinate (space-to-body projection account; Kitazawa,
2002; Yamamoto and Kitazawa, 2001) or vice versa (spatial conflict account;
Cadieux et al., 2010; Shore et al., 2002), or both coordinate activation at the
same time and are influenced by top-down modulation (spatial integration
account; Badde et al., 2014). These theories suggest that the processing of tac-
tile events and visuo-tactile events are influenced by both spatial coordinates.
Therefore, it is possible that this crossing-the-hands effect also influences pre-
diction of tactile events facilitated by the approach of visual information.
    To test this hypothesis, we manipulated hand positions when participants
saw visual stimuli approaching their hands and responded to subsequent tac-
tile stimuli, and compared the resulting ERPs. It is known that visual stimuli
approaching the hands influence the predictions of a subsequent tactile stim-
ulus and ERPs elicited by that stimulus (e.g., Kimura and Katayama, 2015,
2017, 2018). We investigated the relationship between the prediction of a
tactile stimulus facilitated by this approach effect and the crossing-the-hands
effect using the paradigm of these studies.
    In this study, participants were required to respond to tactile stimuli which
were presented to the left (or right) index finger with a high probability (80%)
or to the opposite index finger with a low probability (20%). Before the presen-
tation of each tactile stimulus, visual stimuli approached sequentially toward
the hand to which the high-probability tactile stimulus was presented. In the
uncrossed condition, each hand was placed on its usual side. In the crossed
condition, each hand was placed on the opposite side, i.e., left (right) hand
placed on the right (left) side. Thus, the spatial locations of the tactile stimulus
and the hand were consistent in the uncrossed condition and inconsistent in
the crossed condition. Two conditions were administered in separate blocks.
The frequency with which the tactile stimuli would be presented to each index
finger was told to participants before each block. Therefore, the approach of
the visual stimuli was irrelevant information in this simple reaction time task.
    We focused on ERPs, especially N1, N2, P3, and contingent negative varia-
tion (CNV), as an index of the crossing-the-hand effect and prediction caused
by approaching visual stimuli. These ERPs are known to have a high level of
sensitivity to prediction and deviation from it. N1 is elicited by a tactile stimu-
lus; habituation occurs with repeated presentation of the stimulus, and then this
amplitude decreases (e.g., Kekoni et al., 1997). We predicted that amplitudes

                                                         Downloaded from Brill.com09/03/2021 04:57:04PM
                                                                                          via free access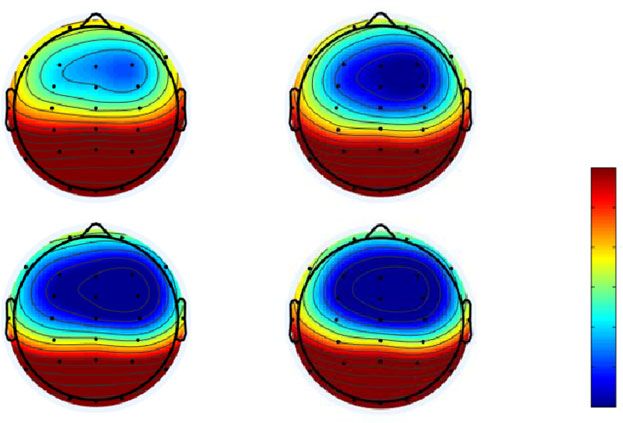
534              T. Kimura / Multisensory Research 34 (2021) 531–551

of N1 with high-probability tactile stimuli decrease under both conditions if
only one spatial coordinate is used, because visual stimuli approach one hand
or one side, and then the tactile stimulus is repeatedly presented (i.e., high
probability) to this hand or space. If both spatial coordinates are used, we pre-
dicted that the habituation occurs and N1 amplitude decreases in the uncrossed
condition because the coordinates are congruent and high-probability tac-
tile stimuli are processed as the same stimuli presented at the same location
for both coordinates, and that the habituation does not occur and N1 ampli-
tude does not decrease in the crossed condition because the coordinates are
incongruent and high-probability tactile stimuli are not processed as the same
stimuli presented at the same location.
    Moreover, N2 is elicited by the deviation from stimulus context and
reflects pre-attentional processing (e.g., Kekoni et al., 1996, 1997; Kimura and
Katayama, 2018). We predicted that N2 amplitude does not differ between
both conditions if only one spatial coordinate is used, because prediction of
the high-probability tactile stimulus is facilitated by the approaching visual
stimuli, and the low-probability tactile stimulus presented at the opposite hand
or space deviates from this context. If both spatial coordinates are used, we
predicted that N2 is elicited by the low-probability stimulus in the uncrossed
condition in which both coordinates are congruent: the N2 is not elicited or its
amplitude decreases in the crossed condition.
    Furthermore, P3 is elicited by deviation from prediction. P3 is elicited by
an unpredicted stimulus, and this amplitude reflects the intensity of a deviation
from prediction (e.g., Donchin, 1981; Duncan-Johnson and Donchin, 1977;
Katayama and Polich, 1996). In addition, when the prediction is facilitated
by the approaching visual stimuli, the stimulus deviating from this prediction
increases the P3 amplitude (e.g., Kimura and Katayama, 2015). We predicted
that P3 amplitudes do not differ between the two conditions if only one spatial
coordinate is used, because prediction of the high-probability tactile stimulus
is facilitated by the approaching visual stimuli, and the intensity of deviation
for the low-probability tactile stimulus presented at the opposite hand or space
is the same. If both spatial coordinates are used, we predicted that P3 is elicited
by the low-probability stimulus in the uncrossed condition in which both coor-
dinates are congruent; the P3 is not elicited or this amplitude decreases in the
crossed condition.
    Finally, CNV is elicited between the prior stimulus and subsequent stimulus
when the timing of the subsequent stimulus can be predicted by the previous
stimulus (e.g., Walter et al., 1964). A previous visuo-tactile study reported
that CNV was elicited between a prior visual stimulus and a subsequent tactile
stimulus (e.g., Kimura and Katayama, 2015). Therefore, if participants are
able to predict the timing of tactile stimulus in both conditions, CNV will not
differ between conditions.

                                                          Downloaded from Brill.com09/03/2021 04:57:04PM
                                                                                           via free access
T. Kimura / Multisensory Research 34 (2021) 531–551 535
2. Method
2.1. Participants
Fifteen undergraduate and graduate students (7 females, 8 males; 19–24 years
of age; mean: 21.93 years; standard error: 1.39) participated in the experi-
ment. All participants were right-handed, according to their self-report, and
had normal or corrected-to-normal vision. This experiment was approved by
The Institute of Scientific and Industrial Research’s Research Ethics Review
Board under Osaka University Regulations. Written informed consent was
obtained from all participants, and their rights as experimental subjects were
protected.
2.2. Stimuli and Apparatus
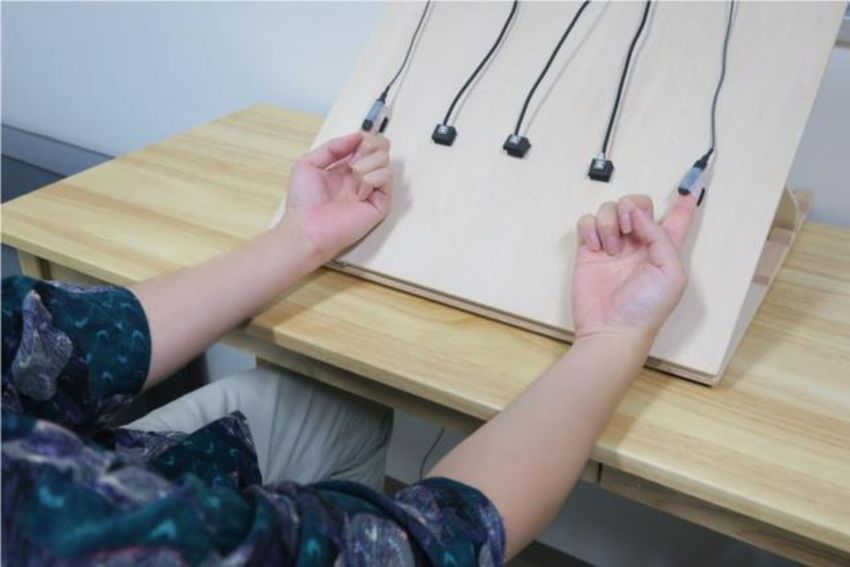
Figure 1 shows the positioning of the tactile and visual stimuli. The partici-
pants were seated and put their hands and forearms on an obliquely oriented
board in front of them. Tactile stimuli were generated by a vibration stimulus
generator (FB-2006D, Uchida Denshi Corporation, Tokyo, Japan). To present
tactile stimuli to participants, solenoid vibrators (FB-1005, Uchida Denshi
Corporation) were put on their index fingers. The vibration was 250 Hz with
a duration of 200 ms. These stimuli were presented to the left (or right) index
finger with a high probability (80%), and to the opposite index finger with a
low probability (20%). These stimuli were presented in random order from
trial to trial, and the order of the location (left or right) of the stimulus presen-
tation at high (or low) probability was counterbalanced across blocks.
Figure 1. The positions of stimulus presentation. The tactile stimuli were applied to the index
fingers. The visual stimuli were placed at equal distances (each interval 8.0 cm) between the
arms on an obliquely oriented board.
Downloaded from Brill.com09/03/2021 04:57:04PM
via free access536 T. Kimura / Multisensory Research 34 (2021) 531–551
Three white light-emitting diodes (LEDs) were used as visual stimuli. Each
LED was a square with 0.8 cm sides. Three LEDs were placed at equal dis-
tances (8.0 cm intervals) between the arms on an obliquely oriented board.
The visual stimuli were single block pulses of 200 ms in duration. The light
intensity was 25 cd.
2.3. Procedure
Each trial was composed of three visual stimuli and one tactile stimulus. The
stimulus interval (SOA) was set to 1000 ms. The interval between trials was
either 1000 or 1200 ms at random with equal probability. Each block was com-
posed of 84 trials (high-probability tactile stimuli: 64 trials; low-probability
tactile stimuli: 16 trials; no tactile stimuli (catch trial): 4 trials), which took
approximately 7 min. Two blocks were presented for each condition. The
interval between blocks was 2 min, and after the second block, the partici-
pants rested for 10 min and then started the remaining two blocks. The order
of conditions was randomized between participants.
The two conditions were distinguished by the position of the hands, and this
position was administered in separate blocks. Figure 2 shows the procedure
for each condition. In the uncrossed condition, each hand was placed on the
same side, i.e., left (right) hand placed on the left (right) side. LEDs flashed
sequentially toward the hand where the high-probability tactile stimulus was
presented (i.e., if the high-probability tactile stimulus was set at the left index
Figure 2. The procedures of (a) the uncrossed condition and (b) the crossed condition.
Downloaded from Brill.com09/03/2021 04:57:04PM
via free accessT. Kimura / Multisensory Research 34 (2021) 531–551 537
finger, the LED flashed sequentially right, center, and left), and the subsequent
tactile stimulus was presented to the left (or right) index finger. In the crossed
condition, each hand was crossed and placed on the opposite side, i.e., left
(right) hand placed on the right (left) side. The spatial locations of the tactile
stimulus and the hand were inconsistent in the crossed condition; thus, if the
high-probability tactile stimulus was set at the right index finger, the LED
flashed sequentially toward the right hand placed on the left side (i.e., LED
flashed sequentially right, center, and left).
In the experimental room, the participants were asked to sit in a chair and
to place their hands and forearms on an obliquely oriented board in front of
them. The distance between their hands was 32.0 cm. In addition, they were
required to gaze at the center LED, in order to control their eye movements,
and not to move their eyes and bodies more than necessary in each condition.
Moreover, the participants were instructed to respond by pressing a button with
the left (or right) foot whenever the tactile stimuli were presented, and to not
respond when tactile stimuli were not presented (i.e., the catch trials). Half of
the participants used the left foot and the other half used the right foot. Finally,
they were told at the start of each block which hand would be presented with
the high- (low-) probability stimuli.
2.4. Recording and Analyses
EEG data were recorded by Polymate AP1132 (Miyuki Giken, Tokyo, Japan)
and an electrode cap (Easycap GmbH, Wörthsee, Germany) using Ag/AgCl
electrodes at 26 sites (Fp1, Fp2, F7, F3, Fz, F4, F8, FC3, FCz, FC4, T7, C3,
Cz, C4, T8, CP3, CPz, CP4, P7, P3, Pz, P4, P8, O1, Oz, O2) according to
the modified 10–20 System. In addition, electrodes were also placed on both
earlobes (A1 and A2). The reference electrode was on the tip of the nose, and
the ground electrode site was AFz. The data from all channels were recorded
using the Mobile Acquisition Monitor Program (Miyuki Giken). The electrode
impedances were kept below 10 k. A DC filter was used at recording. The
sampling rate was 1000 Hz.
To analyze the EEG data, the EEGLAB toolbox (Delorme and Makeig,
2004) and ERPLAB toolbox (Lopez-Calderon and Luck, 2014) on MATLAB
(MathWorks Inc, Natick, MA, USA) were used. The data were digitally band-
pass filtered at 0.01–30 Hz (6 dB/octave) using an IIR Butterworth analog
simulation filter. Artifacts derived from eye movements and eye blinks were
rejected using an automatic EEG artifact detector based on the joint use of spa-
tial and temporal features (ADJUST) of the EEGLAB toolbox (Mognon et al.,
2011). To extract N1, N2 and P3, the EEG epoch was set at 1000 ms (includ-
ing a 200 ms prestimulus baseline). Epochs in which the EEG signal variation
exceeded ±100 μV were excluded from averaging. Additionally, trials with
RTs shorter than 200 ms or longer than 1500 ms and trials with incorrect
Downloaded from Brill.com09/03/2021 04:57:04PM
via free access538 T. Kimura / Multisensory Research 34 (2021) 531–551
responses were discarded from the analysis. After artifact rejection, the num-
ber of remaining trials ranged from 118 to 128 (0–7.2% of trials were rejected)
for the high-probability stimulus and from 28 to 32 (0–12.5% rejected) for
the low-probability stimulus. The time range of N1, N2, and P3 was defined
(N1: 70–150 ms; N2: 180–230 ms; P3: 260–380 ms). These time ranges were
decided by peak latencies of grand-averaged waves for all conditions used in
the analysis.
In addition, to investigate CNV, the EEG epoch was set at 1200 ms (the
baseline was a 200–0 ms prestimulus of the third visual stimulus, and the
onset of the tactile stimulus occurred at 1000 ms). Epochs in which the EEG
signal variation exceeded ±100 μV and trials with errors were excluded from
averaging. After artifact rejection, the number of remaining trials was 155–
160 (0–3.2% rejected). The mean CNV amplitude was obtained from a latency
window of 500–1000 ms. The appropriate latency window was defined based
on observation of the resultant ERP waveforms.
Two-way repeated measures analysis of variance (ANOVA) of reaction
times (RTs) in response to the tactile stimuli was conducted with the two
conditions (uncrossed condition and crossed condition) × two stimulus prob-
abilities [high probability (80%) and low probability (20%)]. Moreover, the
N1, N2, and P3 mean amplitudes were assessed with a three-way repeated
measures ANOVA [2 conditions × 2 stimulus probabilities × 3 electrodes
(Fz, Cz and Pz)]. These electrodes were chosen to check the distribution of
N1, N2, and P3 amplitudes at the midline. These ANOVAs were conducted by
applying Greenhouse–Geisser corrections to the degrees of freedom (Green-
house and Geisser, 1959) when Mauchly’s sphericity test was significant. The
effect sizes have been indicated in terms of partial eta squared (η). Post-hoc
comparisons were made using Shaffer’s modified sequentially rejective mul-
tiple test procedure, which extends Bonferroni t tests in a stepwise fashion
(Shaffer, 1986). In addition, the mean CNV amplitudes at Cz, where the CNV
was elicited at maximum amplitude, were compared between conditions by a
paired t test. The effect size was calculated by computing Cohen’s d (Cohen,
1988). The significance level was set at p < 0.05 for all statistical analyses.
3. Results
3.1. Behavioral Data
Table 1 shows the mean RTs of all participants. The results of the ANOVA
are summarized in Table 2 and revealed that the interaction effect was sig-
nificant (p < 0.05). Post-hoc comparisons indicated that the RT to the low-
probability stimulus was longer than the RT to the high-probability stimulus
in the uncrossed condition (p < 0.05). Moreover, the RT to the low-probability
Downloaded from Brill.com09/03/2021 04:57:04PM
via free accessT. Kimura / Multisensory Research 34 (2021) 531–551 539
Table 1.
Mean RTs (ms) for somatosensory stimuli and standard errors of RTs in
each condition
Uncrossed condition Crossed condition
High probability stimulus 382 (15.34) 364 (11.39)
Low probability stimulus 399 (17.96) 368 (13.55)
Table 2.
The results of ANOVA for RTs
Interaction and main effect F df p ηp 2
Conditions × stimulus probabilities 5.27 1, 14 0.03∗ 0.28
Conditions 3.22 1, 14 0.09 0.18
Stimulus probabilities 4.88 1, 14 0.04∗ 0.26
∗ , p < 0.05.
stimulus in the uncrossed condition was longer than the RT to the low-
probability stimulus in the crossed condition (p < 0.05). In addition, the main
effect of stimulus probabilities was significant (p < 0.05), and the RT to the
low-probability stimulus was longer than the RT to the high-probability stim-
ulus. The main effect of conditions was not significant.
3.2. Electrophysiological Data
3.2.1. N1
Figure 3 shows the grand averages for ERPs elicited by tactile stimuli during
the high-probability stimulus (black lines) and low-probability stimulus (red
lines) from Fz, Cz, and Pz. The first negative deflection showed peak latency at
about 110 ms (N1), the second negative deflection in the low-probability stim-
ulus was at about 180–230 ms (N2), and the last positive deflection showed
peak latency at about 320 ms (P3).
Figure 4 illustrates (a) the topographic map at the time range of N1 (70–
150 ms), and (b) the N1 mean amplitude in both conditions and probabilities.
In the N1 analysis, a smaller amplitude means a larger N1 response. The
results of the ANOVA are summarized in Table 3 and revealed that the main
effect of stimulus probabilities was significant (p < 0.05), and that the N1
amplitude of the low-probability stimulus was larger than that of the high-
probability stimulus. Moreover, the main effect of electrodes was significant
(p < 0.05). Post-hoc comparisons showed that the N1 amplitudes at Fz and Cz
were larger than at Pz (ps < 0.05). Furthermore, the interaction of conditions
and stimulus probabilities was significant (p < 0.05). Post-hoc comparisons
Downloaded from Brill.com09/03/2021 04:57:04PM
via free access540 T. Kimura / Multisensory Research 34 (2021) 531–551
Figure 3. Grand average ERP waveforms for each condition at the Fz, Cz, and Pz electrode
sites. The gray areas denote the time range of N1 (70–150 ms), N2 (180–230 ms) and P3 (260–
380 ms).
showed that the N1 amplitude of the high-probability stimulus in the uncrossed
condition was smaller than that of the high-probability stimulus in the crossed
condition (p < 0.05). The N1 amplitude of the high-probability stimulus was
smaller than that of the low-probability stimulus in the uncrossed condition
(p < 0.05). In addition, the interaction of stimulus probabilities and electrodes
was significant. Post-hoc comparisons showed that the N1 amplitude of the
low-probability stimulus was larger than that of the high-probability stimulus
at Fz and Cz (ps < 0.05). The largest N1 amplitude was at Fz, followed in
order by Cz and Pz in the high-probability stimulus, and the N1 amplitudes at
Fz and Cz were larger than at Pz in the low-probability stimulus (ps < 0.05).
In addition, the interaction of conditions, stimulus probabilities, and elec-
trodes was significant. Table 4 shows the simple interaction effects and
simple–simple main effects.
In the factor of uncrossed condition, the simple–simple main effect of
stimulus probabilities was significant (p < 0.05), and the N1 amplitude of
the high-probability stimulus was smaller than the N1 amplitude of the low-
probability stimulus. Moreover, the simple–simple main effect of electrodes
was significant (p < 0.05), and the largest N1 amplitude was at Fz, followed
in order by Cz and Pz (ps < 0.05). In the factor of crossed condition, the
Downloaded from Brill.com09/03/2021 04:57:04PM
via free accessT. Kimura / Multisensory Research 34 (2021) 531–551 541 Figure 4. (a) The topographic map of the N1 time range (70–150 ms), and (b) mean N1 ampli- tude in both conditions. The error bars indicate the standard errors (SEs) of the means across participants. Table 3. The results of ANOVA for N1 Interaction and main effect F df p ε ηp 2 Conditions × stimulus probabilities × electrodes 4.54 2, 28 0.04∗ 0.67 0.24 Conditions × stimulus probabilities 5.89 1, 14 0.03∗ 0.30 Conditions × electrodes 1.08 2, 28 0.34 0.71 0.07 Stimulus probabilities × electrodes 8.73 2, 28 0.004∗∗ 0.73 0.38 Conditions 2.86 1, 14 0.11 0.17 Stimulus probabilities 8.34 1, 14 0.01∗ 0.37 Electrodes 96.95 2, 28
542                 T. Kimura / Multisensory Research 34 (2021) 531–551

Table 4.
Simple interaction and simple–simple main effect of the N1

Simple interaction and simple–simple main effect    F         df           p            ε       ηp 2

Uncrossed conditions
  Stimulus probabilities × electrodes               3.85     2, 28  0.06              0.66      0.22
  Stimulus probabilities                           10.67     1, 14  0.006∗∗                     0.43
  Electrodes                                       85.60     2, 28
T. Kimura / Multisensory Research 34 (2021) 531–551                       543

condition was smaller than in the crossed condition. Moreover, the simple–
simple main effect of electrodes was significant (p < 0.05), and the largest N1
amplitude was at Fz, followed in order by Cz and Pz (ps < 0.05). In the factor
of low-probability stimulus, the simple–simple main effect of electrodes was
significant (p < 0.05), and the N1 amplitudes at Fz and Cz were larger than at
Pz (ps < 0.05).
   In the factor of Fz, the simple–simple main effect of stimulus probabili-
ties was significant (p < 0.05), and the N1 amplitude of the high-probability
stimulus was smaller than that of the low-probability stimulus. In the factor
of Cz, the simple interaction was significant (p < 0.05). Post-hoc compar-
isons showed that the N1 amplitude of the high-probability stimulus in the
uncrossed condition was smaller than that of the high-probability stimulus in
the crossed condition (p < 0.05). The N1 amplitude of the high-probability
stimulus was smaller than that of the low-probability stimulus in the uncrossed
condition (p < 0.05). In the factor of Pz, the simple interaction was signifi-
cant (p < 0.05). Post-hoc comparisons showed that the N1 amplitude of the
high-probability stimulus in the uncrossed condition was smaller than that of
the high-probability stimulus in the crossed condition (p < 0.05). The N1
amplitude of the high-probability stimulus was smaller than that of the low-
probability stimulus in the uncrossed condition (p < 0.05). In summary, N1
amplitude of the high-probability stimulus was smaller than that of the low-
probability stimulus in both conditions, and the amplitudes of N1 at the frontal
and central electrodes were larger than at the parietal electrode. In addition, the
N1 amplitude of the high-probability stimulus in the uncrossed condition was
smaller than in the crossed condition.
3.2.2. N2
Figure 5 shows (a) the topographic map at the time range of N2 (180–230 ms),
and (b) the N2 mean amplitude in both conditions and probabilities. In the
N2 analysis, a smaller amplitude means a larger N2 response. The results of
the ANOVA are summarized in Table 5 and revealed that the main effect of
stimulus probabilities was significant (p < 0.05), and that the N2 amplitude
of the low-probability stimulus was larger than that of the high-probability
stimulus. Moreover, the main effect of electrodes was significant (p < 0.05).
Post-hoc comparisons showed that the N2 amplitudes at Fz and Pz were larger
than at Cz (ps < 0.05).
3.2.3. P3
Figure 6 shows (a) the topographic map at the time range of P3 (260–380 ms),
and (b) the P3 mean amplitude in both conditions and probabilities. In the
P3 analysis, a larger amplitude means a larger P3 response. The results of
the ANOVA are summarized in Table 6 and revealed that the main effect of
stimulus probabilities was significant (p < 0.05), and that the P3 amplitude

                                                         Downloaded from Brill.com09/03/2021 04:57:04PM
                                                                                          via free access
544 T. Kimura / Multisensory Research 34 (2021) 531–551
Figure 5. (a) The topographic map of the N2 time range (180–230 ms), and (b) mean N2
amplitude in both conditions. The error bars indicate the standard errors (SEs) of the means
across participants.
Table 5.
The results of ANOVA for N2
Interaction and main effect F df p ε ηp 2
Conditions × stimulus probabilities × electrodes 2.74 2, 28 0.08 0.95 0.16
Conditions × stimulus probabilities 0.49 1, 14 0.50 0.03
Conditions × electrodes 2.12 2, 28 0.16 0.68 0.13
Stimulus probabilities × electrodes 0.44 2, 28 0.62 0.83 0.03
Conditions 0.06 1, 14 0.81 0.01
Stimulus probabilities 14.56 1, 14 0.002∗∗ 0.51
Electrodes 6.03 2, 28 0.02∗ 0.67 0.30
∗ , p < 0.05; ∗∗ , p < 0.01.
Downloaded from Brill.com09/03/2021 04:57:04PM
via free accessT. Kimura / Multisensory Research 34 (2021) 531–551 545
Figure 6. (a) The topographic map of the P3 time range (260–380 ms), and (b) mean P3 ampli-
tude in both conditions. The error bars indicate the standard errors (SEs) of the means across
participants.
Table 6.
The results of ANOVA for P3
Interaction and main effect F df p ε ηp 2
Conditions × stimulus probabilities × electrodes 5.28 2, 28 0.02∗ 0.76 0.27
Conditions × stimulus probabilities 0.30 1, 14 0.59 0.02
Conditions × electrodes 2.67 2, 28 0.11 0.63 0.16
Stimulus probabilities × electrodes 1.20 2, 28 0.31 0.72 0.08
Conditions 0.23 1, 14 0.64 0.02
Stimulus probabilities 9.94 1, 14 0.007∗∗ 0.42
Electrodes 6.52 2, 28 0.006∗∗ 0.92 0.32
∗ , p < 0.05; ∗∗ , p < 0.01.
Downloaded from Brill.com09/03/2021 04:57:04PM
via free access546 T. Kimura / Multisensory Research 34 (2021) 531–551
of the low-probability stimulus was larger than that of the high-probability
stimulus. Moreover, the main effect of electrodes was significant (p < 0.05).
Post-hoc comparisons showed that the P3 amplitudes at Cz and Pz were larger
than at Fz (ps < 0.05).
In addition, the interaction of conditions, stimulus probabilities, and elec-
trodes was significant (p < 0.05). Table 7 shows the simple interaction effects
and simple–simple main effects.
In the factor of uncrossed condition, the simple–simple main effect of stim-
ulus probabilities was significant (p < 0.05), and the P3 amplitude of the
Table 7.
Simple interaction and simple–simple main effect of the P3
Simple interaction and simple–simple main effect F df p ε ηp 2
Uncrossed conditions
Stimulus probabilities × electrodes 0.36 2, 28 0.62 0.67 0.02
Stimulus probabilities 4.67 1, 14 0.04∗ 0.25
Electrodes 2.54 2, 28 0.10 0.99 0.15
Crossed condition
Stimulus probabilities × electrodes 3.97 2, 28 0.04∗ 0.78 0.22
Stimulus probabilities 11.46 1, 14 0.004∗∗ 0.45
Electrodes 7.56 2, 28 0.004∗∗ 0.89 0.35
High probability stimulus
Conditions × electrodes 0.67 2, 28 0.47 0.71 0.05
Conditions 0.01 1, 14 0.94 0.01
Electrodes 5.85 2, 28 0.009∗∗ 0.94 0.29
Low probability stimulus
Conditions × electrodes 4.15 2, 28 0.06 0.61 0.23
Conditions 0.63 1, 14 0.44 0.04
Electrodes 5.67 2, 28 0.009∗∗ 0.98 0.29
Fz
Conditions × stimulus probabilities 0.08 1, 14 0.79 0.05
Conditions 0.20 1, 14 0.66 0.01
Stimulus probabilities 11.48 1, 14 0.004∗∗ 0.45
Cz
Conditions × stimulus probabilities 0.65 1, 14 0.43 0.04
Conditions 0.70 1, 14 0.41 0.05
Stimulus probabilities 7.48 1, 14 0.02∗ 0.35
Pz
Conditions × stimulus probabilities 1.01 1, 14 0.33 0.07
Conditions 0.90 1, 14 0.36 0.06
Stimulus probabilities 10.13 1, 14 0.007∗∗ 0.42
∗ , p < 0.05; ∗∗ , p < 0.01; ∗∗∗ , p < 0.001.
Downloaded from Brill.com09/03/2021 04:57:04PM
via free accessT. Kimura / Multisensory Research 34 (2021) 531–551 547
low-probability stimulus was larger than that of the high-probability stimu-
lus. In the factor of crossed condition, the simple interaction was significant
(p < 0.05). Post-hoc comparisons indicated that the P3 amplitude of the low-
probability stimulus was larger than that of the high-probability stimulus at
all electrodes (ps < 0.05). Moreover, the P3 amplitudes at Cz and Pz were
larger than at Fz for the low-probability stimulus (ps < 0.05). Furthermore,
the simple–simple main effects of stimulus probability and electrodes were
significant (p < 0.05). Post-hoc comparisons showed the same result of the
simple interaction for the stimulus probabilities at all electrodes and for the
electrodes to the low-probability stimulus (ps < 0.05).
In the factor of high-probability stimulus, the simple–simple main effect of
electrodes was significant (p < 0.05), and the P3 amplitude at Cz was larger
than at Fz (p < 0.05). In the factor of low-probability stimulus, the simple–
simple main effect of electrodes was significant, and the P3 amplitudes at Cz
and Pz were larger than at Fz (ps < 0.05).
In the factor of Fz, Cz, and Pz, the simple–simple main effect of electrodes
was significant (p < 0.05), and the P3 amplitude of the low-probability stim-
ulus was larger than that of the high-probability stimulus (ps < 0.05). In
summary, P3 amplitude of the low-probability stimulus was larger than that
of the high-probability stimulus in both conditions, and the amplitudes of P3
at the central and parietal electrodes were larger than at the frontal electrode
in the low-probability stimulus.
3.2.4. CNV
Figure 7 illustrates the grand average CNV elicited in all trials at Cz, where
the CNV was elicited at maximum amplitude. The gray area indicates the time
range of CNV (500–1000 ms). Comparisons between conditions by paired t
tests of mean amplitude of CNV revealed no significant difference [t(14) =
0.11, p = 0.91, d = 0.02].
Figure 7. Grand average ERP waveforms for each condition at the Cz electrode sites. The gray
area denotes the time range of contingent negative variation (CNV; 500–1000 ms).
Downloaded from Brill.com09/03/2021 04:57:04PM
via free access548 T. Kimura / Multisensory Research 34 (2021) 531–551
4. Discussion
The present study aimed to investigate the relationship between the predic-
tion of tactile stimulus facilitated by approaching visual information and the
crossing-the-hands effect. For this purpose, ERPs were compared between an
uncrossed condition and a crossed condition. Similar to findings from previous
research (e.g., Kekoni et al., 1997), our results showed that N1 amplitudes in
the front-central region (Fz and Cz electrodes) were larger than in the parietal
region (Pz electrode). Moreover, N1 amplitudes elicited by high-probability
tactile stimuli decreased in the uncrossed condition. N1 is elicited by tac-
tile stimuli; habituation occurs with repeated presentation of the stimulus, and
then this amplitude decreases (e.g., Kekoni et al., 1997). In our study, visual
stimuli approached one hand or one side where the high-probability tactile
stimulus was presented in both conditions. The only difference between the
conditions was whether participants crossed their hands or not; therefore, the
difference in the N1 amplitude between the conditions is caused by the con-
sistency of the spatial coordinates. This result indicates that the consistency
between the coordinates influences the early stage of the stimulus process-
ing in which habituation occurs and suggests that inconsistencies between the
coordinates interferes in this stage.
N2 and P3 were elicited by low-probability tactile stimuli in both condi-
tions, and these amplitudes did not differ between conditions. Previous studies
reported that N2 reflects pre-attentional processing of a deviation from stimu-
lus context (e.g., Kekoni et al., 1996, 1997) and that P3 reflects the intensity
of a deviation from prediction (e.g., Donchin, 1981; Duncan-Johnson and
Donchin, 1977; Katayama and Polich, 1996). Moreover, these amplitudes
increased with the tactile stimulus deviating from this prediction of visual
approaching effect (e.g., Kimura and Katayama, 2015, 2018). This result indi-
cated that consistency between the coordinates did not influence the attentional
stage of the stimulus processing and suggested that inconsistencies between
the coordinates are integrated in this stage.
The amplitude of CNV did not differ across the conditions, which is the
same finding as in the previous visual approach study (Kimura and Katayama,
2015). This result indicates that the participants could predict the timing of the
presentation of the tactile stimuli under both conditions, regardless of whether
their hands were crossed.
In contrast to the N1 and CNV results, RT was shorter in the crossed
condition than in uncrossed condition and the difference in RT between the
high-probability tactile stimulus and the low-probability tactile stimulus was
smaller in the crossed condition. Previous studies reported that the facilitation
of RT by the congruency of location between cue and target (i.e., cuing effect)
Downloaded from Brill.com09/03/2021 04:57:04PM
via free accessT. Kimura / Multisensory Research 34 (2021) 531–551 549
did not occur in the crossed-hands condition. Moreover, the RT of the crossed-
hands condition was shorter than that of the uncrossed-hands condition (e.g.,
Azañón and Soto-Faraco, 2008; Azañón et al., 2010). This phenomenon is
called ‘the inverse cuing effect’ and is considered to reflect processing before
the integration of the spatial coordinates (for a review, see Heed and Azañón,
2014). Our results suggest that this effect and processing also occur in pre-
diction facilitated by approaching visual stimuli and in deviation from this
prediction.
In summary, the present study indicated that body-centered coordinates
and body parts-centered coordinates influence the facilitation effect of pre-
diction of subsequent tactile events by visual stimuli approaching the hand
and that the crossing-the-hands effect generated by inconsistency between the
two coordinates also influences the prediction of tactile events. Moreover, this
crossing-the-hands effect occurred only in the early stage (N1) of tactile stimu-
lus processing and not in the pre-attention (N2) and evaluation (P3) processing
stages. In other words, this effect influenced the bottom-up stage of sensory
processing of stimuli, but it did not influence the stages of detecting changes
in stimuli or of evaluation. These results suggest that there is a gradual process
of integration of body-centered coordinate and body parts-centered coordinate
information in prediction linking a visual and tactile modality.
5. Conclusion
In conclusion, the crossing-the-hands effect also influences prediction of sub-
sequent tactile events facilitated by visual stimuli approaching the hand. This
study extended our understanding of the process of integration of spatial coor-
dinates and multisensory processing and prediction processing by examining
ERPs for each processing stage.
Acknowledgements
This study was supported by a Grant-in-Aid for Scientific Research from
the Japan Society for the Promotion of Science (No. 19K23363) to Tsukasa
Kimura.
Conflicts of Interest
The author declares that the research was conducted in the absence of any
commercial or financial relationship that could be construed as a potential
conflict of interest.
Downloaded from Brill.com09/03/2021 04:57:04PM
via free access550 T. Kimura / Multisensory Research 34 (2021) 531–551
References
Azañón, E. and Soto-Faraco, S. (2008). Changing reference frames during the encoding of
tactile events, Curr. Biol. 18, 1044–1049. DOI:10.1016/j.cub.2008.06.045.
Azañón, E., Camacho, K. and Soto-Faraco, S. (2010). Tactile remapping beyond space, Eur.
J. Neurosci. 31, 1858–1867. DOI:10.1111/j.1460-9568.2010.07233.x.
Badde, S., Heed, T. and Röder, B. (2014). Processing load impairs coordinate integration for
the localization of touch, Atten. Percept. Psychophys. 76, 1136–1150. DOI:10.3758/s13414-
013-0590-2.
Cadieux, M. L., Barnett-Cowan, M. and Shore, D. I. (2010). Crossing the hands is more con-
fusing for females than males, Exp. Brain Res. 204, 431–446. DOI:10.1007/s00221-010-
2268-5.
Cohen, J. (1988). Statistical Power Analysis for the Behavioral Sciences, 2nd edn. Laurence
Erlbaum Associates, Hillsdale, NJ, USA.
Delorme, A. and Makeig, S. (2004). EEGLAB: an open source toolbox for analysis of single-
trial EEG dynamics including independent component analysis, J. Neurosci. Methods 134,
9–21. DOI:10.1016/j.jneumeth.2003.10.009.
Donchin, E. (1981). Surprise!. . . surprise?, Psychophysiology 18, 493–513. DOI:10.1111/j.
1469-8986.1981.tb01815.x.
Duncan-Johnson, C. C. and Donchin, E. (1977). On quantifying surprise: the variation of event-
related potentials with subjective probability, Psychophysiology 14, 456–467. DOI:10.1111/
j.1469-8986.1977.tb01312.x.
Greenhouse, S. W. and Geisser, S. (1959). On methods in the analysis of profile data, Psychome-
trika 24, 95–112. DOI:10.1007/BF02289823.
Heed, T. and Azañón, E. (2014). Using time to investigate space: a review of tactile temporal
order judgments as a window onto spatial processing in touch, Front. Psychol. 5, 76. DOI:10.
3389/fpsyg.2014.00076.
Heed, T., Backhaus, J. and Röder, B. (2012). Integration of hand and finger location in external
spatial coordinates for tactile localization, J. Exp. Psychol. Hum. Percept. Perform. 38, 386–
401. DOI:10.1037/a0024059.
Heed, T., Buchholz, V. N., Engel, A. K. and Röder, B. (2015). Tactile remapping: from coor-
dinate transformation to integration in sensorimotor processing, Trends Cogn. Sci. 19, 251–
258. DOI:10.1016/j.tics.2015.03.001.
Holmes, N. P., Sanabria, D., Calvert, G. A. and Spence, C. (2006). Multisensory interactions
follow the hands across the midline: evidence from a non-spatial visual–tactile congruency
task, Brain Res. 1077, 108–115. DOI:10.1016/j.brainres.2005.11.010.
Katayama, J. and Polich, J. (1996). P300 from one-, two-, and three-stimulus auditory
paradigms, Int. J. Psychophysiol. 23, 33–40. DOI:10.1016/0167-8760(96)00030-x.
Kekoni, J., Hämäläinen, H., McCloud, V., Reinikainen, K. and Näätänen, R. (1996). Is the
somatosensory N250 related to deviance discrimination or conscious target detection?, Elec-
troencephalogr. Clin. Neurophysiol. 100, 115–125. DOI:10.1016/0013-4694(95)00231-6.
Kekoni, J., Hämäläinen, H., Saarinen, M., Gröhn, J., Reinikainen, K., Lehtokoski, A. and Näätä-
nen, R. (1997). Rate effect and mismatch responses in the somatosensory system: ERP-
recordings in humans, Biol Psychol. 46, 125–142. DOI:10.1016/S0301-0511(97)05249-6.
Downloaded from Brill.com09/03/2021 04:57:04PM
via free accessT. Kimura / Multisensory Research 34 (2021) 531–551 551
Kimura, T. and Katayama, J. (2015). Approach of visual stimuli modulates spatial expectations
for subsequent somatosensory stimuli, Int. J. Psychophysiol. 96, 176–182. DOI:10.1016/j.
ijpsycho.2015.04.002.
Kimura, T. and Katayama, J. (2017). Visual stimuli approaching toward the body influence
temporal expectations about subsequent somatosensory stimuli, Brain Res. 1664, 95–101.
DOI:10.1016/j.brainres.2017.03.030.
Kimura, T. and Katayama, J. (2018). The approach of visual stimuli influences expectations
about stimulus types for subsequent somatosensory stimuli, Exp. Brain Res. 236, 1563–
1571. DOI:10.1007/s00221-018-5244-0.
Kitazawa, S. (2002). Where conscious sensation takes place, Conscious. Cogn. 11, 475–477.
DOI:10.1016/s1053-8100(02)00031-4.
Lopez-Calderon, J. and Luck, S. J. (2014). ERPLAB: an open-source toolbox for the analysis
of event-related potentials, Front. Hum. Neurosci. 8, 213. DOI:10.3389/fnhum.2014.00213.
Mognon, A., Jovicich, J., Bruzzone, L. and Buiatti, M. (2011). ADJUST: an automatic EEG
artifact detector based on the joint use of spatial and temporal features, Psychophysiology
48, 229–240. DOI:10.1111/j.1469-8986.2010.01061.x.
Shaffer, J. P. (1986). Modified sequentially rejective multiple test procedures, J. Am. Stat. Assoc.
81, 826–831.
Shore, D. I., Spry, E. and Spence, C. (2002). Confusing the mind by crossing the hands, Cogn.
Brain Res. 14, 153–163. DOI:10.1016/s0926-6410(02)00070-8.
Spence, C. (2010). Crossmodal spatial attention, Ann. N. Y. Acad. Sci. 1191, 182–200. DOI:10.
1111/j.1749-6632.2010.05440.x.
Spence, C., Pavani, F. and Driver, J. (2004). Spatial constraints on visual-tactile cross-modal dis-
tractor congruency effects, Cogn. Affect. Behav. Neurosci. 4, 148–169. DOI:10.3758/cabn.
4.2.148.
Walter, W. G., Cooper, R., Aldridge, V. J., McCallum, W. C. and Winter, A. L. (1964). Contin-
gent negative variation: an electric sign of sensorimotor association and expectancy in the
human brain, Nature 203, 380–384. DOI:10.1038/203380a0.
Yamamoto, S. and Kitazawa, S. (2001). Reversal of subjective temporal order due to arm cross-
ing, Nat. Neurosci. 4, 759–765. DOI:10.1038/89559.
Downloaded from Brill.com09/03/2021 04:57:04PM
via free accessYou can also read