MY SCHOOL INFORMATION DESIGN CHALLENGE: Building a Better School Performance Report Card for Parents & Students

Page created by Jordan Brady
 
CONTINUE READING
MY SCHOOL INFORMATION DESIGN CHALLENGE: Building a Better School Performance Report Card for Parents & Students
MY SCHOOL
                               INFORMATION
                              DESIGN
                             CHALLENGE:
                              Building a Better School Performance
                                  Report Card for Parents &
                                     Students

ExcelinEd.org | @ExcelinEd
MY SCHOOL INFORMATION DESIGN CHALLENGE: Building a Better School Performance Report Card for Parents & Students
TABLE OF CONTENTS
                             1         FOREWORD
                             2         BACKGROUND
                             3         WHY REPORT CARDS MATTER
                             5         CURRENT LANDSCAPE: WHAT ARE TODAY’S SCHOOL REPORT CARDS LIKE?
                                       6 What Does the Research Say?
                                         According to Researchers, Are Report Cards Findable, Readable and
                                       7	
                                         Understandable?
                                       8 According to Parents, Are Report Cards Easy to Read and Useful?
                                         According to Experts, What Indicators are Essential for Measuring
                                       9	
                                         School and District Performance?

                             12        CALL TO ACTION: MY SCHOOL INFORMATION DESIGN CHALLENGE
                                       12        Why a Design Challenge?
                                       14        The Challenge
                                       15        Required Components of the My School Information Design Challenge

                             17        CONCLUSION

My School Information Design Challenge: Building A Better School Performance Report Card For Parents & Students   Foundation for Excellence in Education
MY SCHOOL INFORMATION DESIGN CHALLENGE: Building a Better School Performance Report Card for Parents & Students
FOREWORD
                                   Across the nation, the scene plays out the same in every home, as parents ask
                                   their children, “What did you do at school today?” The answer usually comes back
                                   as a blank stare, or some version of “I don’t know” or “I can’t remember.” As par-
                                   ents, we want to know not only how our own children are doing, but also how well
                                   our schools are working for all the students in their care. Often, getting or under-
                                   standing the details we need about our schools can be just as difficult as getting
                                   the details we want from our children.

                                   In most cases, our children aren’t intentionally keeping details about their day a
                                   secret. It’s just that there’s a lot to report, and all of the teachers, classmates and
                                   assignments they interact with each day can get jumbled up into one big blur. The
                                   same can happen with school- and district-level information. There’s so much to
                                   gather and report, from so many different sources, that putting it all together in a
                                   readable and easy-to-understand format can be an enormous and complex task.

                                   State departments of education across the country have been grappling with this
                                   issue in their own unique ways—creating a diverse landscape of school informa-
                                   tion “report cards” that vary widely from state to state. Despite their best efforts,
                                   these departments often lack the capacity to tackle what is essentially a design
                                   challenge. In an effort to help address this challenge and to give parents access
                                   to useful school information, the Foundation for Excellence in Education (Ex-
                                   celinEd) has found a creative way to build on existing efforts and inspire a new
                                   generation of school report cards.

                                   The report that follows describes why report cards matter and what the research
                                   says about the current challenges associated with reporting school information.
                                   This context builds support for an important call to action—the announcement of
                                   the My School Information Design Challenge. We are eager to invite thought lead-
                                   ers and design experts to reimagine the presentation of school information. And
                                   we hope you will join us in this exciting venture!

                                   Patricia Levesque
                                   Chief Executive Officer, Foundation for Excellence in Education

My School Information Design Challenge: Building A Better School Performance Report Card For Parents & Students   Foundation for Excellence in Education   1
MY SCHOOL INFORMATION DESIGN CHALLENGE: Building a Better School Performance Report Card for Parents & Students
BACKGROUND
                                   Today, most decisions begin with an Internet search for information. Few people
                                   select a hotel without visiting TripAdvisor or a similar site. Most don’t choose a
                                   restaurant before checking in with Zagat or Yelp. In fact, many people are unwill-
                                   ing to spend $10 on a movie ticket without scrutinizing reviews on Rotten Toma-
                                   toes. And yet our education system forces most parents to send their children
                                   to a school without having a clear understanding of that school’s strengths and
                                   weaknesses.

                                   In an effort to provide transparent information to the public and improve student
                                   performance, the federal Elementary and Secondary Education Act (ESEA)
                                   requires that all states publish an annual report card for each school with infor-
                                   mation about student demographics, performance, graduation rates and other
                                   academic indicators. Unfortunately, research indicates—and the experiences
                                   of far too many parents confirm—that many of today’s school report cards are
                                   difficult to find online and often impossible to understand once found. Too often
                                   school information is presented in an unwieldy and unintelligible way that makes
                                   it difficult for parents and community members to use.

                                   There is a greater need than ever before for easy-to-understand information
                                   about school performance. Transitioning to new, higher standards presents new
                                   challenges to communicate to parents these higher expectations and subsequent
                                   changes. New accountability systems require parents to understand the key
                                   metrics that inform them. And a growing array of options for parents requires that
                                   they have information to make informed decisions.

                                   ExcelinEd believes that parents, students and policymakers deserve better. That
                                   is why ExcelinEd is seeking the help of the design community to bring school
                                   performance report cards into the modern information era—and onto the comput-
                                   ers and mobile devices of parents and the public at large. Offering prizes totaling
                                   $35,000, ExcelinEd’s My School Information Design Challenge seeks to attract
                                   top talent from across numerous fields—including design, technology, education
                                   and parental advocacy—to reimagine a 21st-century school report card and cre-
                                   ate a better user experience.

My School Information Design Challenge: Building A Better School Performance Report Card For Parents & Students   Foundation for Excellence in Education   2
MY SCHOOL INFORMATION DESIGN CHALLENGE: Building a Better School Performance Report Card for Parents & Students
WHY REPORT
     CARDS MATTER
                                   Every day, parents, teachers, policymakers and community members seek
                                   information about their schools.

                                        »»   A parent wants to know more about the elementary school that her
                                             kindergartner will attend in the fall.

                                        »»   A group of parents needs to understand complicated performance
                                             data to help them be more effective advocates at the next school
                                             board meeting.

                                        »»   An eighth grader works with his parents to choose a high school that
                                             meets his unique interests and needs.
         “Simple can                    »»   A parent wants to know whether the local charter school might be a
      be harder than                         better option for his fourth grader.
  complex: You have                     »»   A veteran teacher is looking for a job with a higher-performing school.
     to work hard to                    »»   A state legislator wants her policy decisions to be informed by the
   get your thinking                         performance of local schools.

    clean to make it                    »»   A community member contemplates a run for the local school board.

     simple. But it’s                   »»   A policymaker wants to understand a state’s school rankings.

  worth it in the end                   »»   An advocate wants to know if all students in a city have equal access

   because once you                          to high-quality schools.

  get there, you can                    »»   The local newspaper is trying to identify schools that “beat the odds”
                                             in terms of serving low-income students with higher-than-average
  move mountains.”
                                             performance.

                                        »»   A philanthropic funder is trying to identify a set of schools for a
           Steve Jobs                        specific grant.

My School Information Design Challenge: Building A Better School Performance Report Card For Parents & Students   Foundation for Excellence in Education   3
MY SCHOOL INFORMATION DESIGN CHALLENGE: Building a Better School Performance Report Card for Parents & Students
All of these individuals—and many additional stakeholders within our education
                                   system—should be able to evaluate any public school after a click of a mouse
                                   or a swipe of a mobile device. And what we have learned is that it is not enough
                                   to merely publish the data—the numbers of school performance. Design—the
                                   way this information is presented and visualized—is critically important to helping
                                   individuals make decisions and take action.

                                             PARENTS WEIGH IN ON SCHOOL PERFORMANCE REPORT CARDS

                                            “I’ll be honest, I really don’t understand all of the information. I don’t think a lot
                                           of parents where I’m from can understand it. All I want to know is how the kids are
                                           performing. Are they growing and exceling each year? Are the teachers doing what
                                         they are supposed to do? How does the school compare to other schools with the same
                                         type of children, who come from the same background and circumstances? I want to be
                                                          educated and know what is going on in these schools.”

                                                                  “I have known many parents that have moved so their children
                                                                 can attend a higher- performing school. A report card makes the
                                                                   information easily accessible and highlights performance.”

                                                                                      “[Report cards] matter because they keep
                                                                                         everyone responsible accountable.”

                                                                                      “Report cards are good for accountability,
                                                                                       informing the public whether schools are
                                                                                    meeting goals set for them. Report cards can
                                                                                      be used to improve the areas that are not
                                                                                      satisfactory and commend areas that are
                                                                                   outstanding. [I] would like to see a summary of
                                                                                   changes happening at the school on the report
                                                                                    card: what are the things that have been done
                                                                                               to make improvements.”

My School Information Design Challenge: Building A Better School Performance Report Card For Parents & Students   Foundation for Excellence in Education   4
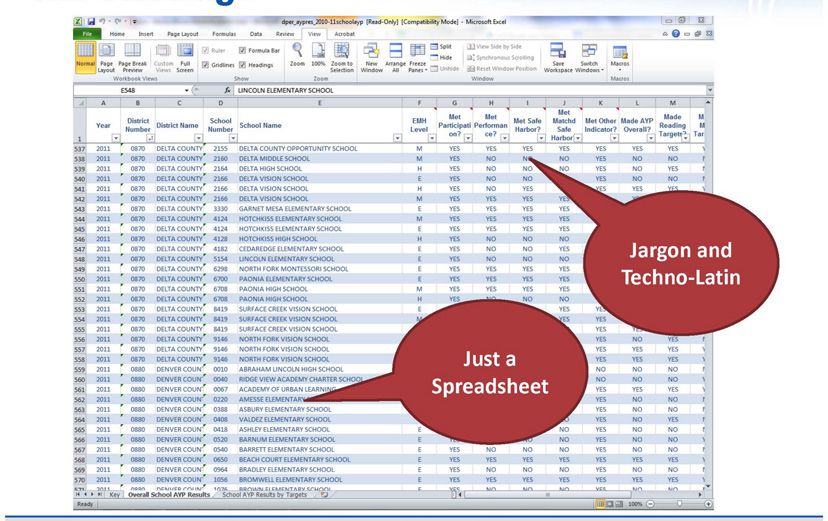
MY SCHOOL INFORMATION DESIGN CHALLENGE: Building a Better School Performance Report Card for Parents & Students
CURRENT LANDSCAPE:
     WHAT ARE TODAY’S
     SCHOOL REPORT
     CARDS LIKE?
                                   Creating an effective, easy-to-understand report card is an incredibly difficult
                                   task. ESEA requires all states to publish an annual report card for each school in
                                   the state using a variety of complex data calculations, and in many cases, state
                                   laws add to these requirements. The report cards must contain demographic
                                   information and student performance data, including proficiency rates (broken out
                                   by race, ethnicity, socioeconomic status and disability status), graduation rate (for
                                   high schools), teacher quality data, and performance on the National Assessment
                                   of Educational Progress (NAEP).

                                   These requirements were modified as part of the U.S. Department of Educa-
                                   tion’s ESEA waivers awarded to 43 states and the District of Columbia. These
                                   waivers have allowed states to create new accountability systems that incorpo-
                                   rate additional components, including student growth and complex indices that
                                   award points to schools based on their performance on a variety of metrics such
                                   as student proficiency, growth by subgroups, and graduation rates. While these
                                   changes are likely improving the mechanics and incentive structures of state
                                   accountability systems, they are also making it increasingly challenging for states
                                   to explain these systems through school report cards.1

                                   1. For a detailed description of current federal requirements for school performance report cards, see the U.S. De-
                                   partment of Education’s State and Local Report Cards Non-regulatory Guidance (Feb. 2013) at http://www2.ed.gov/
                                   programs/titleiparta/state_local_report_card_guidance_2-08-2013.pdf.

My School Information Design Challenge: Building A Better School Performance Report Card For Parents & Students              Foundation for Excellence in Education   5
MY SCHOOL INFORMATION DESIGN CHALLENGE: Building a Better School Performance Report Card for Parents & Students
States are also wrestling with how to use these report cards as a way to facilitate
                                   the public’s understanding of changes that will be introduced as they transition
                                   to new higher standards, such as the Common Core State Standards, teacher
                                   evaluation systems, and results from new assessments, such as the PARCC and
                                   SBAC.

                                   All of these are immensely complicated systems that require sophisticated data
                                   analysis and calculations. States have appropriately focused on getting these
                                   systems right. Often, the presentation of this information, such as on the school
                                   report cards, is viewed as a secondary concern. Even when presentation is a
                                   priority, states are finding that there is a difference between simply publishing a
                                   chart and making data intuitively understandable. What makes sense to a policy
                                   expert may not necessarily translate for a parent.

                                   Research by the Education Commission of the States (ECS)—as well as Exce-
                                   linEd’s own observations—confirms the results of this mix of challenges. Despite
                                   their best efforts, far too many states publish annual school report cards that are
                                   difficult to find on the Web, are poorly designed, are awkward to navigate, and
                                   lack key pieces of data—or they include so much information that parents are
                                   overwhelmed.

                                   At the same time, some states have overcome legal, political and financial hur-
                                   dles and have created thoughtful, well-designed, understandable school report
                                   cards. And some are making efforts to think creatively about design, including
                                   Arizona, Colorado, Illinois and the District of Columbia. What lessons can be
                                   learned and replicated from real-life examples of usable report cards?

                                    Rating States,
                                    Grading Schools
                                    What Parents and Experts say States Should Consider
                                                                                             What Does the Research Say?
                                    to Make School Accountability Systems Meaningful

                                                                                             In June 2014, ECS published an influential re-
                                                                                             port on the state of school report cards. In Rating
                                                                                             States, Grading Schools: What Parents and
                                                                                             Experts say States Should Consider to Make
                                                                                             School Accountability Systems Meaningful, ECS
                                                                                             convened panels of researchers, parents and
                                                                               AUGUST 2014
                                                                                             experts to answer three key questions:

My School Information Design Challenge: Building A Better School Performance Report Card For Parents & Students              Foundation for Excellence in Education   6
MY SCHOOL INFORMATION DESIGN CHALLENGE: Building a Better School Performance Report Card for Parents & Students
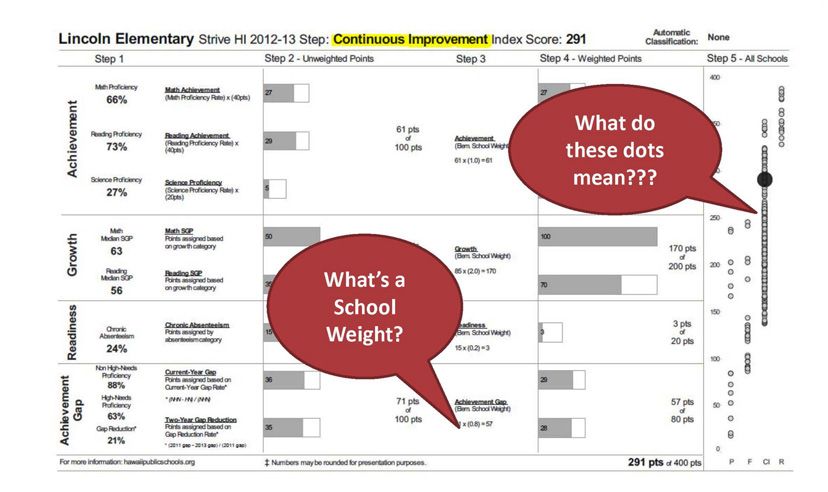
»»   Of researchers—Are the report cards findable, readable and
                                             understandable?

                                        »»   Of parents—Are the report cards easy to read and useful?

                                        »»   Of experts—What indicators are essential for measuring school and
                                             district performance?

                                   Inspired by the important findings in the ECS report, ExcelinEd conducted its
                                   own report card review. To replicate the parent experience, we asked a colleague
                                   to locate the school report card for Lincoln Elementary School in each state (45
                                   states have a Lincoln Elementary School). Our colleague started by searching
                                   on Google; and, when that failed, she navigated to the report cards through state
                                   department of education websites. She noted how long it took to find each report
                                   card, the effectiveness of a Google search, and how easy (or difficult) it was to
                                   navigate to and within the report cards. As explained below, our observations
                                   echoed many ECS findings.

                                   For illustrative purposes, page 10 includes samples of Lincoln Elementary
                                   School report cards from 12 different states. These examples demonstrate the
                                   enormous design challenges facing states and help capture the diversity of
                                   ways—some more successful than others—that states have approached these
                                   challenges.

                                   According to Researchers, Are Report Cards
                                   Findable, Readable and Understandable?
                                   ECS asked education researchers to identify state report cards that were find-
                                   able, readable, understandable, and used effective graphics. The researchers
                                   identified eight states with report cards that were above average in all four cate-
                                   gories: Arizona, Delaware, Illinois, Kentucky, Louisiana, Massachusetts, Maine
                                   and Ohio. One researcher noted that Arizona’s format was “reader-friendly” and
                                   that “[t]he graphics are well-done and convey information at a glance.”

                                   Unfortunately, even the experienced researchers struggled to locate many online
                                   report cards. One frustrated participant complained, “Could not find using a Goo-
                                   gle search—lots of confounding search results.” The researchers also noted that
                                   some report cards were “clearly not designed with parents in mind. It looks like
                                   it’s just to meet federal/state reporting requirements.”

My School Information Design Challenge: Building A Better School Performance Report Card For Parents & Students   Foundation for Excellence in Education   7
MY SCHOOL INFORMATION DESIGN CHALLENGE: Building a Better School Performance Report Card for Parents & Students
ExcelinEd’s observations were similar. Fewer than half the states were judged
                                   “easy to find” in that the report cards could be located through a quick Google
                                   search or via a few clicks from a state’s department of education homepage. On
                                   the other hand, finding report cards from 10 states took more than five minutes,
                                   and for three states, finding report cards took more than 10 minutes.

                                   According to Parents, Are Report Cards Easy to
                                   Read and Useful?
                                   ECS selected 14 parents representing a mix of educational attainment, ethnicity,
                                   income levels and geography to evaluate whether states’ report cards were easy
                                   to read, useful, and provided sufficient data. Their favorites were from Arkansas,
                                   Delaware, the District of Columbia, Illinois, Ohio and Wisconsin.

                                   The parents preferred these report cards because they include a high-level sum-
                                   mary of school performance and have clear graphics accompanied by plain lan-
                                   guage explanations and the option of consulting additional resources for deeper
                                   exploration. Parents also praised these report cards because they offer the
                                   option of drilling down into particular data points and provide context by allowing
                                   parents to compare their school to district and state averages.

                                   However, far too many school report cards failed to give parents the informa-
                                   tion they needed to judge the quality of the school in several main
                                   respects:

                                        »»   Lack of context for data. One ECS parent stated: “Not
                                             much reference or explanation of the ‘B’ grade…”, and
                                             another noted that there was “[n]o growth comparison from
                                             years past.” Similarly, the ExcelinEd analysis found that one
                                             state’s report card labeled Lincoln Elementary as having a
                                             “continuous improvement” status based on an index score of
                                             291 without easy-to-find explanations of the
                                             total number of possible points, or whether
                                             “continuous improvement” is good or bad.

                                        »»   Failure to explain report card
                                             components. In many states, accountability
                                             decisions are now based on complex
                                             indices. School report cards should help
                                             parents understand how a school’s grade

My School Information Design Challenge: Building A Better School Performance Report Card For Parents & Students   Foundation for Excellence in Education   8
or score is calculated and what each individual component of the grade or
                                              score means. Unfortunately, as one ECS parent noted, report cards often
                                              “use words that are not meaningful to the general public.” ExcelinEd found
                                              an example in which a state awarded its Lincoln Elementary School 17.29
                                              points for an “average growth z score” without further explanation.

                                         »»   Too much information. In some cases, parents were overwhelmed by the
                                              volume of data, describing one report card as “[l]ike reading a corporate
                                              financial report of 20 pages.”

                                   The sample of report cards on page 11 illustrates a number of these weakness-
                                   es.

                                   A ccording to Experts, What Indicators are
                                    Essential for Measuring School and District
                                    Performance?
                                   ECS also convened a panel of 12 educational experts to identify the essential
                                   indicators of school quality. The panel concluded that every state report card
                                   should include the following indicators:

                                         »»   Student achievement
                                         »»   Student academic growth
                                         »»   Achievement gap closure
                                         »»   Graduation rates
                                         »»   College and career readiness

                                   According to the experts, just 14 states include all five essential indicators:
                                   California, Colorado, Florida, Kentucky, Louisiana, Nevada, New Mexico, North
                                   Dakota, Ohio, Oklahoma, Pennsylvania, Tennessee, Utah and Wisconsin.

                                   Notably, there was little overlap between the states picked by parents, researchers
                                   and experts as having the best report cards. This may indicate that most of
                                   the report cards containing all of the components essential to an effective
                                   accountability system lack the transparency and accessibility that parents want
                                   and deserve. ExcelinEd’s My School Information Design Challenge will attempt to
                                   bridge that gap.

My School Information Design Challenge: Building A Better School Performance Report Card For Parents & Students   Foundation for Excellence in Education   9
LINCOLN ELEMENTARY SCHOOL REPORT CARD EXAMPLES
                                                                                                                                                                                                       (12 STATES)
                                                                                                                                                                                                                                                                                                                                                                                                       9/3/2014                                                                                           IDOE: Compass

                                                                                                                                                                                                                                                                                                                                                                                                          IDOE HOME

                                                                                                                                                                                                                                                                                                                                                                                                                                                                                                         Com pass Help       AYP    PL221     Grad Rate

                                                                                                                                                                                                                                                                                                                                                                                                                                           Search School and Corporation Reports
                                                                                                                                                                                                                                                                                                                                                                                                                                                                                                                           Advanced Search
                                                                                                                                                                                                                                                                                                                                                                                                                                                                                                                Search
                                                                                                                                                                                                                                                                                                                                                                                                                                                                                                                           State Report
                                                                                                                                                                                                                                                                                                                                                                                                                                           Where we are and where we are heading.
                                                                            Alabama AYP Accountability Reports
                                                                                         School Status Report
                                                                                                                                                                                                                                                                                                                                                                                                           Lincoln Elementary School (0270)
                                                                                                                                                                                                                                                                                                                                                                                                                                                                                                                                                                                                                            2013 Massachusetts School Report Card Overview
                Alabama Department of Education
                Adequate Yearly Progress Status for 2012-2013                                                                                                                                                                                                                                                                                                                                                                                                                                                                                                                                                               LINCOLN (02810120)
                                                                                                                                                                                                                                                                                                                                                                                                             1001 E Cook Rd                                           Principal: Mr Frank Kline                        Allen County
                Based on School Year 2011-2012 Data                                                                                                                                                                                                                                                                                                                                                                                                                                                                                                                                                                         Springfield Public School District (02810000)                   732 Chestnut Street , Springfield, MA 01107
                                                                                                                                                                                                                                                                                                                                                                                                             Fort Wayne, IN 46825-3699                                franklin.kline@fwcs.k12.in.us                    Fort Wayne Community Schools (0235)
                                                                                                                                                                                                                                                                                                                                                                                                                                                                                                                                                                                                                            Sharon Ralls, Principal                                         Phone: 413.787.7314
                                                                                                                                                                                                                                                                                                                                                                                                             Phone: (260) 467-5400 Fax: (260) 467-5441                Grade Levels KG - 05
                061 Talladega County - 0165 Lincoln Elementary School                                                                                                                                                                                                                                                                                                                                                                                                                                                   Other Schools in Fort Wayne Community Schools                                                       Grades Served: K,01,02,03,04,05                                 Website: http://sps.springfield.ma.us
                                                                                              This school met 21 goals out of 21 (100%).                                                                                                                                                                                                                                                                     School Homepage                                          Accreditation Status: State Accredited

                                                                                                                                                                                                                                                                                                                                                                                                                                                                                                                                                                                                             Report cards help parents/guardians and the general public see where schools and districts are
                 2012-2013 AYP Status                                                                           Made AYP                                                                                                                                                                                                                                                                                 Overview          Enrollment & Attendance                  Student Performance              Accountability           School Personnel                                                               succeeding and where there is still work to do. This report card overview answers important questions
                                                                                                      Not in School Improvement                                                                                                                                                                                                                                                                           IREAD-3         Report Card          AMAO         NCLB        State Reports            Annual Performance Report                                                                                   about our school's performance. For the complete report card containing additional data contact the
                                                                                                                                                                                                                                                                                                                                                                                                          Report Card                                                                                                                                                                                        school's principal or visit the Massachusetts Department of Elementary and Secondary Education’s
                  Reading                                                                                                                                                                                                                                                                                                                                                                                                                                                                                                                                                                                    website at http://profiles.doe.mass.edu.
                            Made AYP                                   Percent                      Met
                                                                                                                                                                                                                                                                                                                                                                                                            Year:   2012-13
                      Not in School Improvement
                                                                     Participation
                                                                     Goal = 95%
                                                                                                Participation
                                                                                                    Goal
                                                                                                                                  Proficiency Index
                                                                                                                                     Goal = 0.00
                                                                                                                                                                         Met Proficiency
                                                                                                                                                                              Goal                                                                                                                                                                                                                                                                                                                                                                                                                           How is our school doing overall?
                                                                                                                                                                                                                                                                                                                                                                                                                                                                                                     PL 221 History                                                                                                    Accountability and assistance levels                                      School percentile
                                            All Students                    100                       Yes                                 6.01                                 Yes
                                    Special Education                       100                       Yes                                -10.05                              Yes(CI)                                                                                                                                                                                                                                                                                2008-09                  2009-10                  2010-11                  2011-12                  2012-13                                                                                                   School percentiles (1-99) indicate how a school
                                                                                                                                                                                                                                                                                                                                                                                                                                                                                                                                                                                                                                                Meeting gap narrowing             is performing overall compared to other schools
                                                                            ~                         N/A                                   ~                                  N/A                                                                                                                                                                                                                                                                                                                                       A                                                                                    Our school
                 American Indian / Alaskan Native                                                                                                                                                                                                                                                                                                                                                                                       Final PL 221
                                                                                                                                                                                                                                                                                                                                                                                                                                                                Not Assessed
                                                                                                                                                                                                                                                                                                                                                                                                                                                                                            Academic
                                                                                                                                                                                                                                                                                                                                                                                                                                                                                                                    (Exemplary                     A                        B
                                                                                                                                                                                                                                                                                                                                                                                                                                                                                                                                                                                                                                                goals                             that serve the same or similar grades. Our
                             Asian / Pacific Islander                       ~                         N/A                                   ~                                  N/A                                                                                                                                                                                                                                                         Status                                           Progress                                                                                                                                                                              school's percentile is below.
                                                                                                                                                                                                                                                                                                                                                                                                                                                                                                                     Progress)
                                                     Black                  100                       Yes                                 3.78                                 Yes                                                                                                                                                                                                                                                                                                                                                                                                                                                              One or more schools in
                                                                                                                                                                                                                                                                                                                                                                                                                                                  Due to a change to spring testing, PL 221 was not calculated for the 2008-09 school year.
                                                 Hispanic                   100                       N/A                                 3.82                                 N/A                                                                                                                                                                                                                                                                                                                                                                                                                            Our district                      the district classified into
                                                                                                                                                                                                                                                                                                                                                                                                                                                                                                                                                                                                                                                Level 4                           Lowest performing                                Highest
                                                     White                  100                       Yes                                 6.97                                 Yes
                                                                                                                                                                                                                                                                                                                                                                                                                                                                                                                                                                                                                                                                                                                                performing

                                                                                                                                                                                                                                                                                                                                                                                                                                                            2012-2013 Report Card
                        Limited English Proficient                      No Data                   No Data                               No Data                              No Data                                                                                                                                                                                                                                                                                                                                                                                                                           Most schools are assigned a level from 1-5, with
                                                                                                                                                                                                                                                                                                                                                                                                                                                                                                                                                                                                               those meeting their proficiency gap-narrowing                           Overall progress in narrowing gaps
                                                                            100                       Yes                                 5.60                                 Yes
                               Free / Reduced Meals
                                                                                                                                                                                                                                                                                                                                                                                                                                                                                                                                                                                                               goals in Level 1 and the lowest performing in
                                                                                                                                                                                                                                                                                                                                                                                                                                                                                                                                                                                                                                                                                  Massachusetts aims to reduce proficiency gaps
                                                                                                                                                                                                                                                                                                                                                                                                                                                                                                                                                                                                               Levels 4 and 5. A district is typically assigned a
                                                                                                                                                                                                                                                                                                                                                                                                                                                                                                                                                                                                                                                                                  by half between 2011 and 2017.

                                                                                                                                                                                                                                                                                                                                                                                                                  B                     Lincoln Elementary School
                  Mathematics                                                                                                                                                                                                                                                                                                                                                                                                                                                                                                                                                                                  level based on the level of its lowest performing
                            Made AYP                                   Percent                      Met
                                                                                                                                  Proficiency Index                      Met Proficiency                                                                                                                                                                                                                                                                                                                                                                                                                       school. Placing schools and districts into levels                  All students                              Met Target
                      Not in School Improvement
                                                                     Participation              Participation
                                                                                                                                     Goal = 0.00                              Goal                                                                                                                                                                                                                                                      Lincoln Elementary School received a B as its final letter grade for school accountability.                                                                            helps districts know which schools need more                       High needs students                       Met Target
                                                                     Goal = 95%                     Goal
                                                                                                                                                                                                                                                                                                                                                                                                                                                                                                                                                                                                               support, and helps the state know which districts                   Low income students                      Met Target
                                            All Students                    100                       Yes                                 11.02                                Yes
                                                                                                                                                                                                                                                                                                                                                                                                            Letter Grade                This is a one letter grade decrease from last year.                                                                                                                    need the most assistance. More information is                       Students with                            -
                                    Special Education                       100                       Yes                                 -2.88                              Yes(CI)                                                                                                                                                                                                                                                                                                                                                                                                                           available here:                                                     disabilities
                                                                                                                                                                                                                                                                                                                                                                                                                                        The final grade reflects student performance and growth on Indiana's English/Language Arts and Math basic skills tests. Student growth is
                 American Indian / Alaskan Native                           ~                         N/A                                   ~                                  N/A                                                                                                                                                                                                                                                      analyzed for three groups: (1) Bottom 25%, (2) Top 75% and (3) Overall.
                                                                                                                                                                                                                                                                                                                                                                                                                                                                                                                                                                                                               http://www.doe.mass.edu/apa/accountability.                         English language                         Met Target
                             Asian / Pacific Islander                       ~                         N/A                                   ~                                  N/A
                                                                                                                                                                                                                                                                                                                                                                                                                                                                                                                                                                                                                                                                                   learners & former ELLs
                                                     Black                  100                       Yes                                 7.66                                 Yes                                                                                                                                                                                                                         Student Performance
                                                                            100                       N/A                                 8.09                                 N/A                                                                                                                                                                                                                         A school's letter grade is established by the percent of students passing state assessments.
                                                                                                                                                                                                                                                                                                                                                                                                                                                                                                                                                                                                             How does our school's achievement over time compare to the district
                                                 Hispanic
                                                     White                  100                       Yes                                 12.46                                Yes                                                                                                                                                                                                                         Mathematics                                                                                     English/Language Arts
                        Limited English Proficient                      No Data                   No Data                               No Data                              No Data
                                                                                                                                                                                                                                                                                                                                                                                                           84.9% of students passed the assessment.                                                        83.3% of students passed the assessment.                                                          and the state?
                                                                                                                                                                                                                                                                                                                                                                                                           This rate is above the state average.                                                           This rate is above the state average.
                               Free / Reduced Meals                         100                       Yes                                 9.76                                 Yes                                                                                                                                                                                                                         This rate is below the state goal.                                                              This rate is below the state goal.                                                                Percentage of students scoring proficient or above on Massachusetts Comprehensive Assessment
                                                                                                                                                                                                                                                                                                                                                                                                                                                                                                                                                                                                             System (MCAS), 2010-2013.
                 Additional Academic Indicator - Attendance Rate
                                                                                                                                                                                                                                                                                                                                                                                                           Student Growth                                                                                                                                                                                                                English language arts                    Mathematics                                 Science
                                    Made AYP                                                                                                                                                                                                                                                                                                                                                               A school's letter grade may increase, decrease, or remain the same based on student growth.                                                                                                                                    2010 2011 2012 2013               2010 2011 2012 2013                       2010 2011 2012 2013
                                                                                     Attendance Rate Goal = 95%                             Met Additional Academic Indicator
                         Not in School Improvement
                                                                                                                                                                                                                                                                                                                                                                                                           Mathematics                                                                                           English/Language Arts                                                                       Our school
                                                             All Students                       97%                                                                Yes

                                                                                                                                                                                                                                                                                                                                                                                                                                                                                                                                                                                                                                     %     35   48    35    41               38        56    44        61              27     14    24   31
                                                                                                                                                                                                                                                                                                                                                                                                                                                                                                                                                                                                             Elementary
                                                                                                                                                                                                                                                                                                                                                                                                                                                                                                                                                                                                             Schools in
                                                                                                                                                                                                                                                                                                                                                                                                                                                                                                                                                                                                             our district
                                                                                                                                                                                                                                                                                                                                                                                                                                                                                                                                                                                                                                     %     31   37   35     36               28        34    35        42              25     26    28   33
                                                                                                                                                                                                                                                                                                                                                                                                                                                                                                                                                                                                             Elementary
                 Legend                                                                                                                                                                                                                                                                                                                                                                                      Student Performance                                                                                                                                                                             Schools in
                  ~    Fewer than 10 students                                                         SH    Safe Harbor                                                                                                                                                                                                                                                                                                                                                                                                                                                                                      MA
                                                                                                                                                                                                                                                                                                                                                                                                           Mathematics                                                                                     English/Language Arts
                 N2    Small school rule for participation                                            CI    Confidence Interval                                                                                                                                                                                                                                                                                                                                                                                                                                                                                                      %     57   62    62    61               49        59    59        62              56     52    54   54
                  *    Small school rule for proficiency                                              IM    Improvement
                 ¯     Small school rule for AAI                                                      N/A Not applicable (for subgroups), fewer than 40 students                                                                                                                                                                                                                                       http://compass.doe.in.gov/dashboard/reportcard.aspx?type=school&id=0270                                                                                                                                   1/2
                 UA Uniform Averaging                                                                                                                                                                                                                                                                                                                                                                                                                                                                                                                                                                        How does our school's growth compare to the district and the state?
                                                                                                                                                                                                                                                                                                                                                                                                                                                                                                                                                                                                             Student Growth Percentiles (SGPs) measure gains in student achievement from year to year. Growth
                                                                                                                                                                                                                                                                                                                                                                                                                                                                                                                                                                                                             between 40 and 60 is considered typical. SGPs above 60 represent better than typical gains, while SGPs
                                                                                                                                                                                                                                                                                                                                                                                                                                                                                                                                                                                                             below 40 indicate lower than typical gains. Our school's median SGPs for 2013 are below. (Note: Growth
                                                                                                                                                                                                                                                                                                                                                                                                                                                                                                                                                                                                             values are truncated.)
                                                                                                                                                                                                                                                                                                                                                                                                                                                                                                                                                                                                                                                 English language arts                                     Mathematics
                                                                                                                                                                                                                 Nevada School                                                                                                                                                                                Elementary/Middle-Level English Language Arts Results for Accountability                                                                                                                                                    Lower growth          Higher growth                   Lower growth         Higher growth
                                                                                                                                                                                                                 Performance Framework
                                                                                                                                                                                                                                                                                                                                                                                                            All accountability groups made AYP: NO                                                                                                                                                                                        1                50              99                   1              50               99

                                                                                                                                                                                                                                                                                                                                                                                                                                                                                        Students            Percent of
                                                                                                                                                                                                                                                                                                                                                                                                                                                                                                                                                                                                             Our school
                                                                                                                                                                                                                                                                                                                                                     School Year: 2012-13                                                                                                                                                                             Tested
                                                                                                                                                                                                                                                                      School Overview Report                                                                                                                              Student Group                       Made       Tested
                                                                                                                                                                                                                                                                                                                                                                                                                                                                                     Enrolled During
                                                                                                                                                                                                                                                                                                                                                                                                                                                                                        the Test
                                                                                                                                                                                                                                                                                                                                                                                                                                                                                                             Enrolled
                                                                                                                                                                                                                                                                                                                                                                                                                                                                                                         Students with
                                                                                                                                                                                                                                                                                                                                                                                                                                                                                                                           PI >= EAMO
                                                                                                                                                                                                                                                                                                                                                                                                                                                                                                                          or Safe Harbor
                                                                                                                                                                                                                                                                                                                                                                                                                                                                                                                                                     Students
                                                                                                                                                                                                                                                                                                                                                                                                                                                                                                                                                                          PI       EAMO
                                                                                                                                                                                                                                                                                                                                                                                                                                                                                                                                                                                                Safe
                                                                                                                                                                                                                                                                                                                                                                                                                                                                                                                                                                                               Harbor        Elementary
                                                                                                                                                                                                                                                                                                                                                                                                                                                              AYP         95%        Administration     Valid Test Scores                           Enrolled on
                                                                                                                                                                                                                                                                  Lincoln Elementary School (02222.1)                                                                                                                                                                                    Period
                                                                                                                                                                                                                                                                                                                                                                                                                                                                                                                              Target                 BEDS Day                                  Target
                                                                                                                                                                                                                                                                                                                                                                                                                                                                                                                                                                                                             Schools in our
                                                                                                                                                                                                                                                                                         Title I                                                                                                                                                                                                                                                                                                             district
                                                                                                                                                                                                                                                                                                                                                                                                            All Students                                        ✔           ✔              182                 99%                   ✔                     161            79          74          74         Elementary
                                                                                                                                                                                                                                                                                                                                                                                                                                                                                                                                                                                                             Schools in MA
                                                                                                                                                                                             3 Star School:                                                                                                                                                                                                 American Indian or Alaska Native                    ―          ―                1                   ―                    ―                     0              ―           ―           ―
                                                                                                                                                                                             A 3-Star School has some areas of success as well as some areas that need improvement relative to student proficiency and/or student growth on the
                                                                                                                                                                                             State assessments. The school has negotiated flexibility with the school district in decision-making and, when appropriate, is acknowledged for its                                                            Black or African American                           ―          ―                2                   ―                    ―                     1              ―           ―           ―
                                                                                                                                                                                             successes with public recognition.
                                                                                                                                                                                                                                                                                                                                                                                                            Hispanic or Latino                                  ―          ―                21                  ―                    ―                     17             ―           ―           ―          How does our school's enrollment compare to the district and the
                                                                                                                                                                                                                                                                                                                                                                                                            Asian or Native Hawaiian/Other
                                                                                                                                                                                                                   Performance Indicators                                  Points Earned Points Eligible                                  Percentage of Points Earned                                       Pacific Islander                                    ―          ―                1                   ―                    ―                     1              ―           ―           ―

                                                                                                                                                                                                  Growth Measure of Achievement                                                    26.0                     40                 65.0%                                                                        White                                               ✘           ✔              139                 99%                   ✘                     129            83          96          96

                                                                                                                                                                                                  Status Measure of Achievement                                                    18.0                     30                 60.0%                                                                        Multiracial                                         ―          ―                18                  ―                    ―                     13             ―           ―           ―
                                                                                                                                                                                                  Reductions in Achievement Gaps                                                   14.7                     20                 73.4%
                                                                                                                                                                                                                                                                                                                                                                                                            Students With Disabilities                          ―          ―                32                  ―                    ―                     25             ―           ―           ―
                                                                                                                                                                                                  Other Indicator                                                                  6.0                      10                 60.0%
                                                                                                                                                                                                                                                                                                                                                                                                            Limited English Proficient                          ―          ―                3                   ―                    ―                     2              ―           ―           ―
                                                                                                                                                                                                  Total Index Score                                                            [Points Earned(64.67)/Points Eligible(100)] X 100 = 64.67
                                                                                                                                                                                                                                                                                                                                                                                                            Economically Disadvantaged                          ✘           ✔              107                 99%                   ✘                     91             54          56          56
                                                                                                                                                                                                  Reading/ELA Test Participation                                        99.7%                                    Math Test Participation                                       99.7%
                                                                                                                                                                                                                                                                                                                                                                                                              Results for the following groups are NOT used to determine AYP.

                                                                                                                                                                                                                                                                      Whole School Demographics (N = 665)                                                                                                                                                     Students Enrolled During the              Percent of Enrolled Students               Tested Students Enrolled on
                                                                                                                                                                                                                                                                                                                                                                                                                          Student Group                                                                                                                                                          PI
                                                                                                                                                                                                                                                                                                                                                                                                                                                               Test Administration Period                  with Valid Test Scores                           BEDS Day
                                                                                                                                                                                                                                                             Am Indian/                              Black/             Hispanic/              Pacific            Two or More   White/
                                                                                                                                                                                                      IEP               ELL                  FRL                                   Asian
                                                                                                                                                                                                                                                             AK Native                           Afr American            Latino               Islander              Races     Caucasian                     Not American Indian or Alaska
                                                                                                                                                                                                                                                                                                                                                                                                            Native                                                            181                                      99%                                        161                           79
                                                                                                                                                                                                  6.6%                 59.8%               96.1%                0.0%               0.3%                  6.0%              89.0%                0.0%                    1.1%            3.6%
                                                                                                                                                                                                                                                                                                                                                                                                            Not Black or African American                                     180                                      99%                                        160                           78

                                                                                                                                                                                             What do the performance indicators mean?                                                                                                                                                                       Not Hispanic or Latino                                            161                                      99%                                        144                           83
                                                                                                                                                                                                                                                                                                                                                                                                            Not Asian or Native Hawaiian/Other
                                                                                                                                                                                                                       Growth Measure of Achievement                                                                        Status Measures of Achievement                                                  Pacific Islander                                                  181                                      99%                                        160                           78
                                                                                                                                                                                                Student Growth is a measure of performance on the State                                                Status is a measure of student performance based on a single
                                                                                                                                                                                                assessments over time. Students who perform similarly on the first                                     administration of the State assessment. Cut scores are set that                                      Not White                                                           43                                    100%                                         32                           63
                                                                                                                                                                                                administration of the test are compared to each other after the second.                                determine the achievement level needed to be proficient on the
                                                                                                                                                                                                Each student's relative performance to each other is measured as a                                     assessments. Status Measures of Achievement are determined by                                        Not Multiracial                                                   164                                      99%                                        148                           80
                                                                                                                                                                                                percentile. This value is called the Student Growth Percentile or SGP.                                 calculating the percent of students in the school who met or exceeded
                                                                                                                                                                                                Separate SGP determinations are made for Reading/ELA and Math.                                         standards on the State assessments. School-level calculations are                                    General Education                                                 150                                     100%                                        136                           93
                                                                                                                                                                                                                                                                                                       made for Reading/ELA and Math.
                                                                                                                                                                                                                       Reductions in Achievement Gaps                                                                                    Other Indicator                                                    English Proficient                                                179                                      99%                                        159                           80
                                                                                                                                                                                                Student achievement targets to meet proficiency on the State                                           Currently, the Other Indicator is a measure of the student average daily                             Not Economically Disadvantaged                                      75                                    100%                                         70                          111
                                                                                                                                                                                                assessments within three years are determined for each elementary                                      attendance or ADA for a school.
                                                                                                                                                                                                and middle school student. These targets are called Adequate Growth
                                                                                                                                                                                                Percentiles or AGP. Reduction in Achievement Gap is based on the                                                                                                                                            Male                                                              107                                      99%                                         92                           73
                                                                                                                                                                                                percent of IEP, ELL or FRL students who meet their AGP targets.
                                                                                                                                                                                                Separate calculations are made for Reading/ELA and Math.                                                                                                                                                    Female                                                              75                                    100%                                         69                           87
                                                                                                                                                                                                Subgroups are identified as students who are on an Individual                                                Star Rating                                          Index Score
                                                                                                                                                                                                Education Plan (IEP), are English Language Learners (ELL) or receive
                                                                                                                                                                                                Free or Reduced-Price Lunch (FRL).                                                                                                           at or above 77                                                 Migrant                                                             0                                        ―                                          0                           ―

                                                                                                                                                                                                                                   Test Participation                                                                                        at or above 68 and below 77                                    Not Migrant                                                       182                                      99%                                        161                           79
                                                                                                                                                                                                Schools do not earn additional framework points for Test Participation,                                                                      at or above 50 and below 68                                    ✔ Yes
                                                                                                                                                                                                but in order for a school to be classified as a 2, 3, 4 or 5 star school,
                                                                                                                                                                                                                                                                                                                                                                                                            ✘ No
                                                                                                                                                                                                the school must meet the 95% participation rate threshold or have an                                                                         at or above 32 and below 50
                                                                                                                                                                                                                                                                                                                                                                                                            ― There were fewer than 40 students enrolled during the test administration period, so the Percent of Enrolled Students with Valid Test Scores data are suppressed OR there were fewer than 30
                                                                                                                                                                                                average of 95% participation or better from the two or three most
                                                                                                                                                                                                recent years of testing.                                                                                                                                                                                    tested students enrolled on BEDS day and during the test administration period, so the PI, EAMO, and Safe Harbor Target data are suppressed.
                                                                                                                                                                                                                                                                                                                                             below 32

                                                                                                                                                                                                                                         "nd" displays when a point value is not determined due to an insufficient number of students in the group.
                                                                                                                                                                                                                                           "**" displays when data is suppressed because there are less than 10 students in the applicable group.
                                                                                                                                                                                                                                                              "N/A" displays when data is either not reported or not applicable.                                                                                                                                                                                                                                                                 2 of 12

                                                                                                                                                                                           9/3/2014                                                                            School Performance Profile: Lincoln El Sch

                                                                                                                                                                                                 Lincoln El Sch (2012 - 2013)
                                                                                                                                                                                                                                                                                                                                                                                                                                                                                                                                                                                                                                                                                   TEXAS EDUCATION AGENCY
                                                                                                                                                                                                                                                                                                                                                                                                                                                                                                                                                                                                                                                                                     2013 System Safeguards
                                                                                                                                                                                                                                                                                                                                                                                                                                                                                                                                                                                                                                                                            LINCOLN EL (108904108) - EDINBURG CISD
                                                                                                                                                                                                         Building Level Academic Score                                                                    Academic Performance Data
                                                                                                                                                                                                                                                                                                 (This data is used to determine the building level academic score.)

                                                                                                                                                                                                                                                                                                                                                                                                                                                                                                                                                                                                                                                                                                                                                                Two or

                                                                                                                                                                                                                                   94.7                                                    ★   > 100        90-100        80-89.9         70-79.9             60-69.9      < 60
                                                                                                                                                                                                                                                                                                                                                                                                                                                                                                                                                                                                                                                             All
                                                                                                                                                                                                                                                                                                                                                                                                                                                                                                                                                                                                                                                          Students
                                                                                                                                                                                                                                                                                                                                                                                                                                                                                                                                                                                                                                                                          African
                                                                                                                                                                                                                                                                                                                                                                                                                                                                                                                                                                                                                                                                         American      Hispanic         White
                                                                                                                                                                                                                                                                                                                                                                                                                                                                                                                                                                                                                                                                                                                      American
                                                                                                                                                                                                                                                                                                                                                                                                                                                                                                                                                                                                                                                                                                                       Indian       Asian
                                                                                                                                                                                                                                                                                                                                                                                                                                                                                                                                                                                                                                                                                                                                                  Pacific
                                                                                                                                                                                                                                                                                                                                                                                                                                                                                                                                                                                                                                                                                                                                                 Islander
                                                                                                                                                                                                                                                                                                                                                                                                                                                                                                                                                                                                                                                                                                                                                                 More
                                                                                                                                                                                                                                                                                                                                                                                                                                                                                                                                                                                                                                                                                                                                                                Races
                                                                                                                                                                                                                                                                                                                                                                                                                                                                                                                                                                                                                                                                                                                                                                              Econ
                                                                                                                                                                                                                                                                                                                                                                                                                                                                                                                                                                                                                                                                                                                                                                             Disadv
                                                                                                                                                                                                                                                                                                                                                                                                                                                                                                                                                                                                                                                                                                                                                                                          Special
                                                                                                                                                                                                                                                                                                                                                                                                                                                                                                                                                                                                                                                                                                                                                                                            Ed          ELL
                                                                                                                                                                                                                                                                                                             Not Applicable (NA)          Insufficient Sample (IS)
                                                                                                                                                                                                                                                                                                                                                                                                                                                                                                                                                                                                             Performance Rates
                                                                                                                                                                                                          Select View Calculation below to see the detailed
                                                                                                                                                                                                      calculation used to determine the building level academic                                               (Select any data element for further detail.)
                                                                                                                                                                                                                                score.                                                                                                                                                                                                                                                                                                                                                                       Targets                                             50%           50%            50%              50%            50%        50%          50%           50%          50%          50%         50%
                                                                                                                                                                                                                                                                        Data                                                                                                      Perform ance
                                                                                                                                                                                                                         View Calculation
                                                                                                                                                                                                                                                                        Elem ent                                                                                                     Measure
                                                                                                                                                                                                                                                                                                                                                                                                                                                                                                                                                                                                             Reading
                                                                                                                                                                                                                                                                                                                                                                                                                                                                                                                                                                                                              Number Phase-in 1 Level 2 and above                127               -              **              *             -            -              -            -       110                7         46
                                                                                                                                                                                                                                                                        Indicators of Academ ic Achievem ent                                                                                                                                                                                                                                                                                                  Total Tests                                        155               -              **              *             -            -              -            -       137            13            64
                                                                                                                                                                                                      Federal Accountability Designation                                                                                                                                                                                                                                                                                                                                                                      % Met Phase-in 1 Level 2 and above                 82%               -              **              *             -            -              -            -       80%          54%         72%
                                                                                                                                                                                                                                                                        Mathem atics/Algebra I - Percent Proficient or Advanced on PSSA/Keystone                                         96.97

                                                                                                                                                                                                            Title I School: Reward (High                                Reading/Literature - Percent Proficient or Advanced on PSSA/Keystone                                             93.94                                                                                                                                                                                                               Mathematics
                                                                                                                                                                                                                     Achievement)                                       Science/Biology - Percent Proficient or Advanced on PSSA/Keystone                                                96.83                                                                                                                                                                                                                Number Phase-in 1 Level 2 and above                138               -              **              *             -            -              -            -       122                7         57
                                                                                                                                                                                                                                                                        Writing - Percent Proficient or Advanced on PSSA                                                                 93.94                                                                                                                                                                                                                Total Tests                                        155               -              **              *             -            -              -            -       137            13            64
                                                                                                                                                                                                        Federal Accountability Measures
                                                                                                                                                                                                                                                                        Industry Standards-Based Com petency Assessm ents - Percent Com petent or                                          NA                                                                                                                                                                                                                 % Met Phase-in 1 Level 2 and above                 89%               -              **              *             -            -              -            -       89%          54%         89%
                                                                                                                                                                                                        Federal Accountability Descriptions                             Advanced                                                                                                                                                                                                                                                                                                                             Writing
                                                                                                                                                                                                  Required Federal Reporting        w w w .eseafedreport.com
                                                                                                                                                                                                                                                                        Grade 3 Reading - Percent Proficient or Advanced on PSSA                                                         97.10                                                                                                                                                                                                                Number Phase-in 1 Level 2 and above                 46               -              **              *             -            -              -            -        42                *         25
                                                                                                                                                                                                  Measures                                                              SAT/ACT College Ready Benchm ark                                                                                   NA                                                                                                                                                                                                                 Total Tests                                         63               -              **              *             -            -              -            -        58                *         35
                                                                                                                                                                                                                                                                                                                                                                                                                                                                                                                                                                                                              % Met Phase-in 1 Level 2 and above                 73%               -              **              *             -            -              -            -       72%                *     71%
                                                                                                                                                                                                                                                                        Indicators of Closing the Achievem ent Gap - All Students
                                                                                                                                                                                                                                                                                                                                                                                                                                                                                                                                                                                                             Science
                                                                                                                                                                                                      Academic Performance Fast Facts                                   Mathem atics/Algebra I - Percent of Required Gap Closure Met                                                       NA
                                                                                                                                                                                                                                                                                                                                                                                                                                                                                                                                                                                                              Number Phase-in 1 Level 2 and above                 66               -              66              -             -            -              -            -        57                5         22
                                                                                                                                                                                                                                                                        Reading/Literature - Percent of Required Gap Closure Met                                                           NA
                                                                                                                                                                                                             (Select any data element for its definition.)                                                                                                                                                                                                                                                                                                                                                    Total Tests                                         70               -              70              -             -            -              -            -        61                5         24
                                                                                                                                                                                                                                                                        Science/Biology - Percent of Required Gap Closure Met                                                              NA
                                                                                                                                                                                                  PSSA/Keystone Proficiency                                   3,4,5                                                                                                                                                                                                                                                                                                                                           % Met Phase-in 1 Level 2 and above                 94%               -          94%                 -             -            -              -            -       93%         100%         92%
                                                                                                                                                                                                                                                                        Writing - Percent of Required Gap Closure Met                                                                      NA
                                                                                                                                                                                                  Reported for Grade(s)                                                                                                                                                                                                                                                                                                                                                                                      Social Studies
                                                                                                                                                                                                  Test Participation Rate:                                     95.7                                                                                                                                                                                                                                                                                                                                           Number Phase-in 1 Level 2 and above                    -             -               -              -             -            -              -            -            -             -           -
                                                                                                                                                                                                                                                                        Indicators of Closing the Achievem ent Gap - Historically Underperform ing Students *
                                                                                                                                                                                                  Mathem atics/Algebra I - All
                                                                                                                                                                                                                                                                                                                                                                                                                                                                                                                                                                                                              Total Tests                                            -             -               -              -             -            -              -            -            -             -           -
                                                                                                                                                                                                  Students                                                              Mathem atics/Algebra I - Percent of Required Gap Closure Met                                                       NA
                                                                                                                                                                                                                                                                                                                                                                                                                                                                                                                                                                                                              % Met Phase-in 1 Level 2 and above                     -             -               -              -             -            -              -            -            -             -           -
                                                                                                                                                                                                  Test Participation Rate:                                     95.7     Reading/Literature - Percent of Required Gap Closure Met                                                           NA
                                                                                                                                                                                                  Reading/Literature - All Students
                                                                                                                                                                                                                                                                        Science/Biology - Percent of Required Gap Closure Met                                                              NA
                                                                                                                                                                                                  Test Participation Rate:                                    100.0                                                                                                                                                                                                                                                                                                                                          Participation Rates
                                                                                                                                                                                                                                                                        Writing - Percent of Required Gap Closure Met                                                                      NA
                                                                                                                                                                                                  Science/Biology - All Students

                                                                                                                                                                                                  Test Participation Rate:                                     93.0                                                                                                                                                                                                                                                                                                                                          Targets                                             95%           95%            95%              95%            95%        95%          95%           95%          95%          95%         95%
                                                                                                                                                                                                                                                                        Indicators of Academ ic Grow th/PVAAS
                                                                                                                                                                                                  Writing - All Students
                                                                                                                                                                                                                                                                        Mathem atics/Algebra I - Meeting Annual Academ ic Grow th Expectations                                           81.00                                                                                                                                                                                                               Reading: 2012-2013 Assessments
                                                                                                                                                                                                  Students Eligible for Opportunity                             No
                                                                                                                                                                                                  Scholarship Tax Credit Program
                                                                                                                                                                                                                                                                                                                                                                                                                                                                                                                                                                                                              Number Participating                               214               -              **              *             -            -              -            -       195            14            119
                                                                                                                                                                                                                                                                        Reading/Literature - Meeting Annual Academ ic Grow th Expectations                                               87.00
                                                                                                                                                                                                                                                                                                                                                                                                                                                                                                                                                                                                              Total Students                                     214               -              **              *             -            -              -            -       195            14            119
                                                                                                                                                                                                  SAT Subject Scores (Averages)              Math               NA
                                                                                                                                                                                                                                                                        Science/Biology - Meeting Annual Academ ic Grow th Expectations                                                  86.00                                                                                                                                                                                                                Participation Rate                              100%                 -              **              *             -            -              -            -      100%         100%        100%
                                                                                                                                                                                                                                             Reading            NA
                                                                                                                                                                                                                                             Writing            NA
                                                                                                                                                                                                                                                                        Writing - Meeting Annual Academ ic Grow th Expectations                                                         100.00
                                                                                                                                                                                                                                                                                                                                                                                                                                                                                                                                                                                                             Mathematics: 2012-2013 Assessments
                                                                                                                                                                                                  ACT Subject Scores (Averages)              Math               NA                                                                                                                                                                                                                                                                                                                                            Number Participating                               214               -              **              *             -            -              -            -       195            14            119
                                                                                                                                                                                                                                                                        Other Academ ic Indicators
                                                                                                                                                                                                                                             Reading            NA                                                                                                                                                                                                                                                                                                                                            Total Students                                     214               -              **              *             -            -              -            -       195            14            119
                                                                                                                                                                                                                                             English            NA      Cohort Graduation Rate                                                                                             NA
                                                                                                                                                                                                                                                                                                                                                                                                                                                                                                                                                                                                              Participation Rate                              100%                 -              **              *             -            -              -            -      100%         100%         100%
                                                                                                                                                                                                                                             Science            NA      Prom otion Rate **                                                                                                 NA

                                                                                                                                                                                                                                                                        Attendance Rate                                                                                                  95.82

                                                                                                                                                                                                                                                                        Advanced Placem ent, International Baccalaureate Diplom a, or College Credit                                       NA
                                                                                                                                                                                                                                                                                                                                                                                                                                                                                                                                                                                                             * Indicates results are masked due to small numbers to protect student confidentiality.
                                                                                                                                                                                                                                                                        PSAT/Plan Participation                                                                                            NA                                                                                                                                                                                                                ** When only one ethnic/race group is masked, then the second smallestethnic/race group is masked (regardless of size).
                                                                                                                                                                                                                                                                                                                                                                                                                                                                                                                                                                                                             - Indicates there are no students in the group.
                                                                                                                                                                                                                                                                        Extra Credit for Advanced Achievem ent

                                                                                                                                                                                                                                                                        Percent PSSA/Keystone Advanced - Mathem atics/Algebra I                                                          80.30

                                                                                                                                                                                                                                                                        Percent PSSA/Keystone Advanced - Reading/Literature                                                              64.65

                                                                                                                                                                                           http://paschoolperformance.org/Profile/4374                                                                                                                                                           1/2                                                                                                                                                                              TEA Division of Performance Reporting                                                                                     Page 2 of 3                                                                                             August 29, 2013

My School Information Design Challenge: Building A Better School Performance Report Card For Parents & Students                                                                                                                                                                                                                                                                                                                                                                                                                                                                                       Foundation for Excellence in Education                                                                                                                                                                        10
​​S AMPLE OF REPORT
                                                                                                CARDS ON PAGE 11
                                                                                           ILLUSTRATES A NUMBER
                                                                                            OF THESE WEAKNESSES

My School Information Design Challenge: Building A Better School Performance Report Card For Parents & Students   Foundation for Excellence in Education   11
CALL TO ACTION: MY
     SCHOOL INFORMATION
     DESIGN CHALLENGE
                                   Underpinning every education reform—be it transitioning to higher standards,
                                   supporting student options, or just facilitating an informed discussion about the
                                   strengths and weaknesses of a school—is easy-to-access, easy-to-understand
                                   information.

                                   Graphic designers have a unique ability to take data, rethink the way it can be
                                   visualized, transform it, and make it more valuable and usable. Education can
                                   take advantage of the design lessons learned from consumer Web services to
                                   improve parents’ understanding of their schools. It’s time for education to move
                                   into the modern information era.

                                   To jumpstart this transformation—and to advance the work conducted by ECS—
                                   ExcelinEd announces the My School Information Design Challenge.

                                   Why a Design Challenge?
                                   When the Department of Health and Human Services and the Department of
                                   Veterans Affairs sought to reimagine the patient health record, they turned to the
                                   talents of the design community. Their tremendously successful Health Design
                                   Challenge attracted 230 submissions. The winners transformed the health record
                                   from a receipt-like printed list of text into a 21st-century resource that makes it
                                   easier for patients to manage their health and enables doctors to take better care
                                   of their patients.

My School Information Design Challenge: Building A Better School Performance Report Card For Parents & Students   Foundation for Excellence in Education   12
With this design challenge, ExcelinEd hopes to bring about a similar revolu-
                                   tion in school performance report cards. A visually improved, easy-to-find and
                                   easy-to-understand report card could improve educational outcomes for stu-
                                   dents. Equipped with better information, parents can become more effective ad-
                                   vocates and make superior educational choices for their children. Communities
                                   can demand the funding of accountability measures and can pressure school,
                                   district and state leaders to implement much-needed reforms. And policymakers
                                   can make more informed decisions about where to direct resources and target
                                   interventions.

                                   ExcelinEd hopes that this challenge helps states view school reports cards not
                                   as a requirement, but as an opportunity to spotlight successful schools and to
                                   educate and empower community members with information about their schools.
                                   ExcelinEd will use the results of the challenge to support state efforts to improve
                                   their ability to share valuable school information. We will develop a white paper,
                                   sharing the winning designs as well as ideas for representing individual report
                                   card components. And we will partner with states to translate concepts in the
                                   winning report card designs into redesigned state-specific report cards. Interest-
                                   ed states will have access to a contact list of the winning designers, who will be
                                   available to assist in the redesign efforts.

                                                                                                Design thinking in a complex world...
                                                                         “As more of our basic needs are met, we increasingly expect
                                                                       sophisticated experiences that are emotionally satisfying and
                                                                     meaningful. These experience will not be simple products. They
                                                                     will be complex combinations of products, services, spaces, and
                                                                    information. They will be the ways we get educated, the ways we
                                                                        are entertained, the ways we stay healthy, the ways we share
                                                                     and communicate. Design thinking is a tool for imagining these
                                                                                expereience as well as giving them a desirable form.”

                                                                                                                                      Tim Brown | IDEO

My School Information Design Challenge: Building A Better School Performance Report Card For Parents & Students   Foundation for Excellence in Education   13
The Challenge
                                   Offering prizes totaling $35,000, the design challenge seeks to attract top talent
                                   to reimagine a school report card that:

                                        »»   Improves the visual layout and style of the information in a school report
                                             card;

                                        »»   Gives parents intuitive, easy-to-understand and use school performance
                                             and student growth information; and

                                        »»   Increases use and accessibility of school report cards by leveraging Web
                                             and mobile applications.

                                   Entrants will submit designs while considering examples of the wide variety of
                                   individuals who will use these report cards:

                                        »»   A young adult who is engaged with technology and mobile devices;

                                        »»   An adult who first language is not English or who has low literacy skills;

                                        »»   A parent who is selecting which school his child will attend; and

                                        »»   A busy inner-city mom managing her kids’ involvement in school
                                             activities.

                                   This is an opportunity for talented individuals to touch the lives of Americans
                                   across the country through design.

     “The world is complex, and so too must be the activities that we perform.
     But that doesn’t mean that we must live in continual frustration. No.
     The whole point of human-centered design is to tame complexity,
     to turn what would appear to be a complicated tool into one that
     fits the task, that is understandable, usable, enjoyable.”

         Don Norman | The Design of Everyday Things and Living with Complexity

My School Information Design Challenge: Building A Better School Performance Report Card For Parents & Students   Foundation for Excellence in Education   14
Required Components of the My School
                                   Information Design Challenge
                                   Although designers will enjoy creative freedom around the design and appear-
                                   ance of the school report card as well as each component within the report card,
                                   each submission must include certain required components.

                                   ​The required components for this challenge are an example of how states may
                                   calculate school performance information. States are currently exploring a vari-
                                   ety of new school accountability models using flexibilities provided under ESEA
                                   waivers. The goal of the challenge is to create a model report card design that
                                   can be translated to many states, regardless of the details of their accountability
                                   systems.

                                   For simplicity, the challenge will not ask designers to include every single data
                                   point required by federal (or state) law. For example, though information on
                                   teacher quality and NAEP performance (both required elements of states’ school
                                   report cards under ESEA) are incredibly important, those are not required com-
                                   ponents of this design challenge.

                                   Submissions in the My School Information Design Challenge must include the
                                   following components:

                                          1       Student achievement
                                                  »»   Percentage of students tested on state assessments in English
                                                       language arts, math, science, social studies and on end-of-
                                                       course exams

                                                  »»   Percentage of students proficient on state assessments in
                                                       English language arts, math, science, social studies and
                                                       on end-of-course exams, disaggregated by race, ethnicity,
                                                       socioeconomic status and disability status

                                          2       Student academic growth
                                                  »»   Percentage of students meeting the state’s growth expectation
                                                       for English language arts and math

My School Information Design Challenge: Building A Better School Performance Report Card For Parents & Students   Foundation for Excellence in Education   15
3       Achievement gap closure
                                                  »»   Percentage of the lowest performing students meeting the state’s
                                                       growth expectation for English language arts and math

                                          4       Graduation rates
                                                  »»   Graduation rate

                                          5       Postsecondary and career readiness
                                                  »»   Acceleration rate (the percentage of 11th and 12th graders taking
                                                       and passing Advanced Placement, International Baccalaureate,
                                                       industry certification or dual-enrollment courses)

                                   Design submissions also must include directory information, demographics,
                                   an overall school grade and the school’s grade history. Designers also may
                                   elect to include information on educational options that are important to
                                   parents and course access offerings. For a more detailed explanation of the
                                   required components as well as other competition requirements and application
                                   processes, please see this designer packet or check out our challenge website at
                                   MySchoolInfoChallenge.com.

                                                                                                          “Design thinking is the search for a
                                                                                                           magical balance between business
                                                                                                                 and art; structure and chaos;
                                                                                                              intuition and logic; concept and
                                                                                                         execution; playfulness and formality;
                                                                                                              and control and empowerment.”

                                                                                                                      Idris Mootee | Idea Couture Inc.

My School Information Design Challenge: Building A Better School Performance Report Card For Parents & Students   Foundation for Excellence in Education   16
CONCLUSION
                                   Prizes have a record of spurring innovation and attracting creative solutions to
                                   pressing challenges. At a time when many states are facing new standards, new
                                   assessments and new accountability systems, it is more important than ever that
                                   parents and other stakeholders have understandable and actionable information
                                   about their schools. At the same time, the complexity and breadth of school data
                                   are increasing. States need help creating 21st-century report cards that educate
                                   parents, engage communities and increase accountability—while also satisfying
                                   existing federal and state requirements.

                                   By harnessing the enormous talents of the design community, states can rev-
                                   olutionize the way we consume and use school information, and help improve
                                   educational outcomes for millions of American students.

My School Information Design Challenge: Building A Better School Performance Report Card For Parents & Students   Foundation for Excellence in Education   17
You can also read