NAMC urban food 28 Selected food basket price items: basket - National Agricultural ...
←
→
Page content transcription
If your browser does not render page correctly, please read the page content below
ISSUE 64 - MARCH 2021

                 28 Selected food
                basket price items:
                NAMC urban food
                    basket

 FOOD BASKET PRICE MONTHLY MARCH 2021 - FEBRAURY 2021 DATA   1
URBAN FOOD PRICE TRENDS: FEBRUARY 2021 VS JANUARY 2021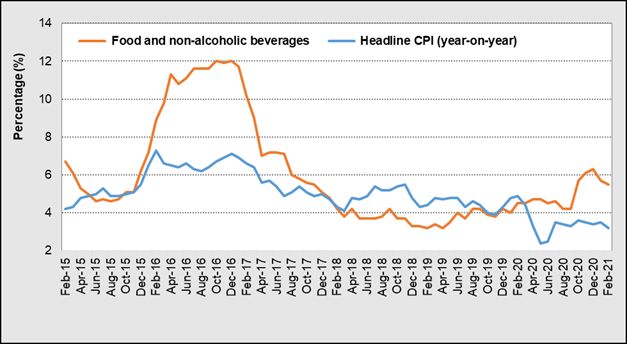
Food Basket
             Price        Monthly
             March 2021 - February 2021 data
                                                 Important note
     The COVID-19 pandemic has fundamentally impacted the South African economy and Statistics South
      Africa’s (Stats SA) ability to measure the impact. As a result, the compilation and release of February
     2021 CPI data were published on Wednesday the 24th of March 2021 (see link below from the Stats SA
                                                     website):

                      http://www.statssa.gov.za/publications/P0141/P0141February2021.pdf

    This report will now contain the official February 2021 data, as the official release of the March 2021 CPI
    data is scheduled for April 21st, 2021. Because rural data is still not monitored by Stats SA, price compari-
                          sons between rural and urban is still not feasible at this stage.

    Highlights               • During February 2021, the nominal cost of the NAMC’s 28-item urban food
                               basket amounted to R974.80 compared to the R971.98 reported during
                               January 2021, resulting in a monthly increase of 0.3%. When compared
                               to February 2020, an annual (y-o-y) increase of 9.4% was observed.

                                o Within the NAMC’s 28-item urban food basket, bread & cereals and
                                  bean products categories were the highest food inflation contributors
                                  during February 2021 (y-o-y) with 26.7% and 17.8%, respectively, with
                                  coffe & tea prices reporting deflation of 9.8% during the same period.
                                o Rice (57.9%) was amongst the commodities with the highest
                                  annual food inflation which can be attributed to higher global exports
                                  prices for rice associated to higher demand and restrictions to exports
                                  by leading global producers when compared to the previous year.

                             • In March 2021 fuel prices for both 93 Unleaded Petrol (ULP) and 95 ULP
                               increased by R0.65/ℓ m-o-m, to reach R16.15/ℓ and R16.32, respectively.
                               This represented an increase of 4.19% m-o-m for 93ULP and 4.15% for
                               95ULP. Diesel 500ppm increased by R0.54/ℓ (3.98%) m-o-m to reach
                               R14.13/ℓ on the 3rd March 2021, from R13.58/ℓ observed in February 2021.

                                o The Rand slightly appriciated towards the end of February 2021, from
                                  R15.06 on the 1st of February 2021 to R15.04 on the 28th of February
                                  2021. This has negatively affected fuel price recovery per litre thus a
                                  slight increase in fuel prices was observed at the beginning of February.
                                o March 2021 expectations: fuel prices are expected to increase primarily
                                  due to increase in the oil price from the global market specifically from North
                                  America associated to higher demand for fuel due to freezing weather.

2                    FOOD BASKET PRICE MONTHLY MARCH 2021 - FEBRUARY 2021 DATA
Overall inflation and food inflation
Figure 1 shows the trends in the headline CPI and food and non-alcoholic beverage inflation rates, from
February 2015 to February 2021. The official February 2021 Consumer Price Index (CPI) released by
Statistics South Africa (Stats SA) on March 24th, 2021, indicated that the annual headline CPI decreased to
2.9% in February 2021 from 3.2% in January 2021. Food and non-alcoholic beverages price inflation has
decreased to 5.2% year-on-year in February 2021, from 5.4% year-on-year in the previous month (January
2021). Largely Meat prices contributed to the decline in food and non-alcoholic beverages price inflation.
In March 2021 fuel prices for both 93 Unleaded Petrol (ULP) and 95 ULP increased by R0.65/ℓ m-o-m, to
reach R16.15/ℓ and R16.32, respectively. This represented an increase of 4.19% m-o-m for 93 ULP and
4.15% for 95 ULP. Diesel 500ppm increased by R0.54/ℓ (3.98%) m-o-m to reach R14.13/ℓ on the 3rd of March
2021, from R13.58/ℓ observed in February 2021.
The rand against the dollar plays a crucial role in fuel prices which is subsequently transmitted to consumers
especially for grains and oilseeds products. Towards the end of February 2021, the rand had slightly
appreciated to R15.04, from R15.18 end of January 2021, but still weaker when compared to early 2021. The
weakening rand together with the increase in oil price from the global market specifically from North America
associated with higher demand for fuel due to freezing weather has negatively affected fuel price recovery
per litre thus a slight increase in fuel prices was observed at the beginning of February. This has a direct effect
on domestic food prices for South Africa which is a net-importer of oil and food is largely transported by road.
Figure 1: Headline CPI and food and non-alcoholic beverages CPI
Source: Stats SA, 2021
FOOD BASKET PRICE MONTHLY MARCH 2021 - FEBRAURY 2021 DATA 3Comparison between urban prices: February 2021 vs.
January 2020
Table 1 compares prices of selected food items in urban areas for February 2021 against January 2021.
The food items which showed the largest price differences during this period were: white sugar (2.5kg) which
increased by R1.82, followed by margarine spread (500g) (R1.14), rice (2kg) (R1.13), special maize 2.5kg
(R0.99), sunflower oil (750mℓ) (R0.87), peanut butter 400g (R0.32), full cream milk – long life 1ℓ (R0.24), a
loaf of white bread 700g (R0.18) and a loaf of brown bread (700g) at R0.09. In February 2021, prices for
Ceylon/black tea (62.5g) and super maize meal 2.5kg had decreased by R1.35 and R0.04, respectively.
Overall urban consumers paid R0.49 more on average for these 11 food items during February 2021 when
compared to January 2021.
Table 1: Comparison between urban food prices (selected food items)
Product Urban Food Prices Urban Food Prices Price differenCe
January 2021 (R/unit) February 2021 (R/unit) (R/unit)
Full cream milk – long life 1ℓ 15.60 15.84 0.24
A loaf of brown bread 700g 14.11 14.20 0.09
A loaf of white bread 700g 15.63 15.81 0.18
Special maize 2.5 kg 26.72 27.71 0.99
Super maize 2.5 kg 27.79 27.75 -0.04
Margarine spread 500g 24.83 25.97 1.14
Peanut butter 400g 33.32 33.64 0.32
Rice 2kg 42.28 43.41 1.13
Sunflower oil 750mℓ 24.25 25.12 0.87
Ceylon/black tea 62.5g 14.18 12.83 -1.35
White sugar 2.5kg 43.49 45.31 1.82
Average difference (R/unit) 0.49
Source: Stats SA, 2021
The NAMC food basket: February 2021 vs
February 2020
This section presents the nominal cost of the NAMC’s 28-item urban food basket¹, based on average food
price data for February 2021 vs. February 2020. The nominal cost of the NAMC’s 28-item urban food basket
amounted to R974.80 in February 2021 compared to the R971.98 reported during January 2021, an increase
of 0.3% m-o-m as compared to an annual increase of 9.4%.
The 28-item NAMC urban food basket products (in nominal terms) are highlighted in Table 2. Products
exceeding the South African Reserve Bank’s (SARB) upper annual inflation band of 6%, include the following:
rice 2kg (57.9%), beans - dried 500g (40.7%), eggs 1.5 dozen (32.8%), polony per kg/1kg (28.0%)%), loaf of
¹Composition of the current food basket (revised in 2017) includes apples per kg, baked beans – tinned (410g), bananas per kg, beans – dried (500g),
beef mince per kg, beef offal per kg, cabbage per kg, Ceylon/black tea (250g), cheddar cheese per kg, chicken giblets per kg, eggs (1.5 dozen), fish
(excl. tuna) – tinned (400g), full cream milk – long life (1ℓ), instant coffee (250g), IQF chicken portions (2kg), brown bread (700g), white bread (700g),
margarine brick (500g), onions per kg, oranges per kg, peanut butter (400g), polony per kg, potatoes per kg, rice (2kg), sugar-white (2.5kg), sunflower
oil (750mℓ), super maize meal (5kg) and tomatoes per kg.
4 FOOD BASKET PRICE MONTHLY MARCH 2021 - FEBRUARY 2021 DATAwhite bread 700g (16.0%), beef mince – fresh per kg (14.9%), super maize meal 5kg (14.4%), loaf of brown
bread 700g (13.9%), sunflower oil 750ml (11.7%), cheddar cheese per kg (9.3%), peanut butter 400g (9.2%),
IQF chicken portions - 2kg (7.9%) with white sugar (2.5kg) and full cream milk - long life 1ℓ both at 6.3%.
Table 2: Percentage change in a basic NAMC food basket (28-item) prices
Category Product Feb 20 Jan 21 Feb 21 % change %change
R/unit R/unit R/unit y-o-y m-o-m
Beans Baked beans - tinned 410g 11.14 11.36 11.40 2.3 0.4
Beans Beans - dried 500g 19.16 26.10 26.95 40.7 3.3
Beans Peanut butter 400g 30.81 33.32 33.64 9.2 1.0
Coffee, Tea Instant coffee 250g 35.55 39.51 37.11 4.4 -6.1
Coffee, Tea Ceylon/black tea 250g 36.82 31.13 28.16 -23.5 -9.5
Dairy, Eggs Full cream milk - long life 1ℓ 14.90 15.60 15.84 6.3 1.5
Dairy, Eggs Eggs 1.5 dozen 40.04 47.87 53.18 32.8 11.1
Dairy, Eggs Cheddar cheese per kg 105.63 114.77 115.46 9.3 0.6
Fats, Oils Brick margarine 500g 22.44 22.61 22.66 1.0 0.2
Fats, Oils Sunflower oil 750mℓ 22.49 24.25 25.12 11.7 3.6
Fruit Apples - fresh per kg 22.34 20.35 22.56 1.0 10.9
Fruit Bananas - fresh per kg 16.60 18.54 17.22 3.7 -7.1
Fruit Oranges - fresh per kg 31.31 25.67 29.99 -4.2 16.8
Protein Beef mince - fresh per kg 84.43 89.75 97.00 14.9 8.1
Protein Beef offal - fresh per kg 37.19 42.45 38.14 2.6 -10.2
Protein Chicken giblets per kg 32.47 37.51 30.43 -6.3 -18.9
Protein IQF chicken portions - 2kg 68.50 77.61 73.90 7.9 -4.8
Protein Fish (excl. tuna) - tinned 400g 20.49 21.49 21.46 4.7 -0.1
Protein Polony per kg / 1kg 34.40 45.22 44.04 28.0 -2.6
Bread & Cereals Loaf of brown bread 700g 12.47 14.11 14.20 13.9 0.6
Bread & Cereals Loaf of white bread 700g 13.63 15.63 15.81 16.0 1.2
Bread & Cereals Super maize meal 5kg 44.58 50.83 50.98 14.4 0.3
Bread & Cereals Rice 2kg 27.50 42.28 43.41 57.9 2.7
Vegetables Cabbage - fresh per kg 14.68 12.68 12.48 -14.9 -1.5
Vegetables Onions - fresh per kg 15.01 14.50 14.33 -4.5 -1.2
Vegetables Potatoes - fresh per kg 13.21 13.41 13.19 -0.2 -1.6
Vegetables Tomatoes - fresh per kg 20.42 19.94 20.83 2.0 4.5
Sugary foods White sugar 2.5kg 42.64 43.49 45.31 6.3 4.2
Total Rand Value* 890.85 971.98 974.80 9.4 0.3
Source: Stats SA and BFAP, 2021
To further explore the impact of price inflation on consumers, Figure 2 presents the average nominal cost
growth of specific food groups within the NAMC’s 28-item food basket comparing the periods February 2021
vs. February 2020 (y-o-y) and February 2021 vs. January 2021 (m-o-m). Food categories recording the
highest annual inflation include bread & cereals, bean products, and dairy & eggs at 26.7%, 17.8% and
14.9%, respectively on a y-o-y basis. Oranges fresh – per kg (16.8%), eggs 1.5 dozen (11.1%), and apple
fresh per kg (10.9%) were the main contributors to the month-on-month inflation figures.
The significant increase of 57.2% in rice prices when compared to the previous year is due to increasing
demand from the global market. Export prices from Vietnam are currently 20% higher when compared to
the same time the previous year, while its 15% and 7%, respectively from India and Thailand. South Africa
FOOD BASKET PRICE MONTHLY MARCH 2021 - FEBRAURY 2021 DATA 5imports almost all of rice consumed, and an increase in export prices will always have an impact on South
Africa domestic prices as observed since mid-2020 after lockdown restrictions and the increased demand
surrounding Covid-19 fears.
Like rice, South Africa is a net-importer for dried beans and the global supply was negatively affected by snow
in the USA and Canada and by drought in South America region during the 2020 season. These events led
to increased international prices thus an annual increase of 40.7% was observed in February on domestic
prices, which was 0.5% up from the previous month. Also, the reduction in planted area in South Africa is
adding more pressure on dry bean prices due to limited local supply. Nonetheless, during March 2021 dry
bean prices should improve as new stocks are entering the market.
The retail price of eggs 1.5 increased by 11.1% in February 2021 compared to January 2021 attributed to
feed prices. While apple retail price increases have significantly slowed down from 29.1% in January 2021
compared to December 2020 to 10.9% in February 2021 compared to January 2021, they remain high m-o-m
due to a two-month low supply on the national fresh produce markets as the new season’s harvest, which
started to enter the market at the end of January 2021. For oranges, an increase of 16.8% was registered in
February 2021 compared to January 2021, however, prices were still lower(-0.4) y-o-y which can be linked to
decreasing demand from both domestically and globally recently. Orange prices are likely to further decrease
as we approach the winter season and new stocks are to enter the market.
Figure 2: Nominal cost growth of specific food groups within the NAMC’s 28-item food basket,
comparing February 2021 vs. February 2020 and February 2021 vs. January 2021
Source: NAMC calculations, Stats SA data, 2021
6 FOOD BASKET PRICE MONTHLY MARCH 2021 - FEBRUARY 2021 DATABackground Information
The NAMC monitors food prices at retail level and releases regular authoritative reports. The Department of
Agriculture, Forestry and Fisheries (DAFF) established the Food Price Monitoring Committee (FPMC) at the
NAMC to track and report food price trends in South Africa; to provide explanations of the observed trends
and to then advise the Department on any possible action that could be taken should national and household
food security be threatened. The FPMC was established after the high food price episode of 2000/01 season.
The functions of the FPMC were continued by the NAMC after the FPMC completed its work in August 2004.
The NAMC issues four quarterly Food Price Monitoring reports annually and, since 2005, also publishes an
annual Food Cost Review report, which documents the margins between farm and retail prices of the major
food products, amongst other topics. In 2015, the NAMC began releasing a quarterly Farm-to-Retail-Price-
Spread (FTRPS) publication, which seeks to provide more insight into the factors driving commodity and food
price margins. This publication, the Food Basket Price Monthly report, came as a result of discussions with
industry to keep a more frequent watch on the movements of food prices.
Compiled by:
Trends and discussion on selected topics:
Thabile Nkunjana BFAP:
Corne Dempers Hester Vermulen
Designed by:
Sylvester Moatshe
Majara Monamodi
Enquiries: Dr. Christo Joubert: +27 12 341 1115 or +27 76 999 7766 or christo@namc.co.za
Stats SA is acknowledged for assistance provided to the NAMC in terms of food price data.
© 2021. Published by the National Agricultural Marketing Council (NAMC).
Disclaimer:
Information contained in this document results from research funded wholly or in part by the NAMC acting in good faith. Opinions, attitudes and points of view expressed
herein do not necessarily reflect the official position or policies of the NAMC. The NAMC makes no claims, promises, or guarantees about the accuracy, completeness,
or adequacy of the contents of this document and expressly disclaims liability for errors and omissions regarding the content thereof. No warranty of any kind, implied,
expressed, or statutory, including but not limited to the warranties of non-infringement of third party rights, title, merchantability, fitness for a particular purpose or freedom
from computer virus is given with respect to the contents of this document in hardcopy, electronic format or electronic links thereto. Reference made to any specific product,
process, and service by trade name, trade mark, manufacturer or another commercial commodity or entity are for informational purposes only and do not constitute or imply
approval, endorsement or favouring by the NAMC.
FOOD BASKET PRICE MONTHLY MARCH 2021 - FEBRAURY 2021 DATA 7You can also read