NATIONAL FIRE DANGER RATING SYSTEM - COST BENEFIT ANALYSIS Final Version 2.2 - AFAC
←
→
Page content transcription
If your browser does not render page correctly, please read the page content below
COST BENEFIT ANALYSIS
NATIONAL FIRE DANGER
RATING SYSTEM
Final Version 2.2

                        24 August 2018

                        Prepared for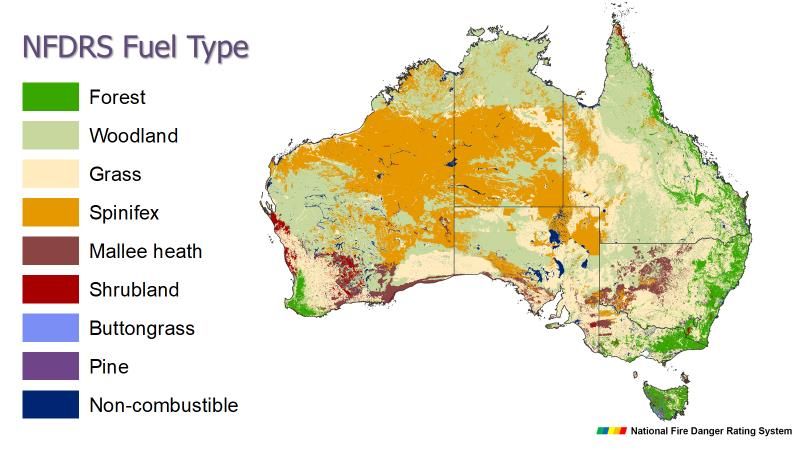
COST BENEFIT ANALYSIS | NATIONAL FIRE DANGER RATING SYSTEM

CONTENTS
PURPOSE OF REPORT ................................................................................................................................................ 5

ABBREVIATIONS ......................................................................................................................................................... 6
1.          EXECUTIVE SUMMARY ................................................................................................................................ 8
1.1         Background ....................................................................................................................................................................... 8
1.2         Cost-Benefit Analysis .................................................................................................................................................... 8
1.3         Results ................................................................................................................................................................................. 9
1.4         Key Assumptions ............................................................................................................................................................ 9
1.5         Discussion ....................................................................................................................................................................... 10
1.6         Sensitivity Analysis ..................................................................................................................................................... 10
1.7         Other Economic Evaluations ................................................................................................................................... 11

2.          BACKGROUND AND CONTEXT ................................................................................................................ 13
2.1         Current Fire Danger Rating System .................................................................................................................... 13
2.2         NFDRS Program............................................................................................................................................................ 14
2.3         Key Components .......................................................................................................................................................... 17
2.4         Improved Decision-Making ..................................................................................................................................... 19
2.5         Beneficiaries .................................................................................................................................................................. 20
2.6         Indices .............................................................................................................................................................................. 20
2.7         Outcomes......................................................................................................................................................................... 21
2.8         Key Deliverables To Date ......................................................................................................................................... 21
2.8.1       Research Prototype..................................................................................................................................................... 21
2.8.2       Social Research ............................................................................................................................................................. 21
2.8.3       Other Work ..................................................................................................................................................................... 22
2.9         Next Steps ....................................................................................................................................................................... 22
3.          CASE FOR CHANGE ...................................................................................................................................... 23
3.1         Limitations of Current System ............................................................................................................................... 23
3.2         Improved Decision-Making ..................................................................................................................................... 24
3.3         Costs of Inaccurate Ratings...................................................................................................................................... 25
3.4         Increases in Extreme Fire Weather ...................................................................................................................... 26
3.5         Consistency with Government Policy .................................................................................................................. 27
3.5.1       Disaster Resilience ...................................................................................................................................................... 27
3.5.2       Mitigation of Disaster Risk ....................................................................................................................................... 27
3.6         Continuous Improvement ........................................................................................................................................ 28
4.          PERFORMANCE OF RESEARCH PROTOTYPE ..................................................................................... 29
4.1         Description of Research Prototype ...................................................................................................................... 29
4.2         Trial Results – All Data .............................................................................................................................................. 30
4.3         Trial Results – Case Studies ..................................................................................................................................... 31
4.4         Operational Calibration & Additional Research .............................................................................................. 32
5.          FRAMEWORK FOR EVALUATION OF COSTS AND BENEFITS ........................................................ 33
5.1         The Economics of Bushfires .................................................................................................................................... 33
5.2         Cost-Benefit Analysis ................................................................................................................................................. 34

                                                                                                                                                                                                     2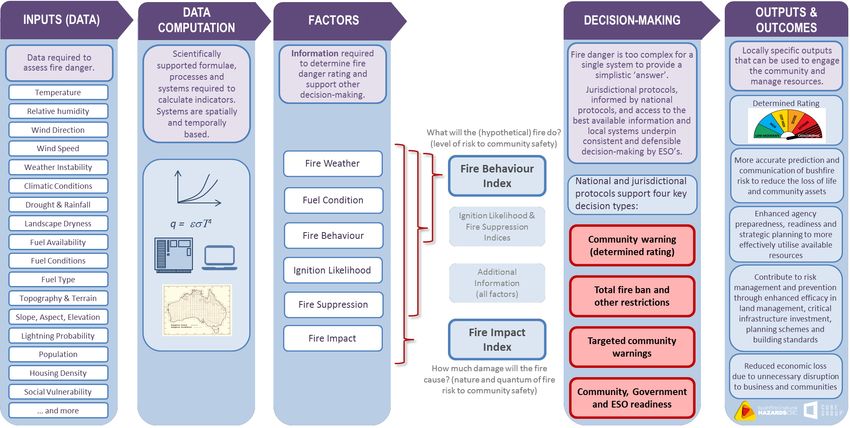
COST BENEFIT ANALYSIS | NATIONAL FIRE DANGER RATING SYSTEM

5.3      Methods ........................................................................................................................................................................... 34
5.4      Consideration of Options .......................................................................................................................................... 35
5.5      Complexity ...................................................................................................................................................................... 35
5.6      Other Economic Evaluations ................................................................................................................................... 35
5.7      Effects of NFDRS ........................................................................................................................................................... 37
5.8      Benefits of NFDRS ........................................................................................................................................................ 39
5.9      Costs of Bushfires (Bushfire Losses) ................................................................................................................... 41
5.9.1    Direct Tangible Costs ................................................................................................................................................. 42
5.9.2    Indirect Tangible Costs.............................................................................................................................................. 44
5.9.3    Intangible Costs ............................................................................................................................................................ 45
5.9.4    Estimated Costs of Bushfires (Bushfire Losses) ............................................................................................. 47
5.10     Costs of Bushfire Management............................................................................................................................... 49
5.10.1   Direct Tangible Costs ................................................................................................................................................. 51
5.10.2   Indirect Tangible Costs.............................................................................................................................................. 51
6.       ESTIMATION OF BENEFITS ...................................................................................................................... 53
6.1      Reduced Bushfire Losses .......................................................................................................................................... 53
6.1.1    Rationale for Reduction in Bushfire Losses ...................................................................................................... 53
6.1.2    Consideration of Issues ............................................................................................................................................. 53
6.1.3    Summary of Assumptions for Quantification of Benefits ............................................................................ 54
6.2      Reduced Number of Bushfires Started ............................................................................................................... 55
6.2.1    Rationale for Reduction in Number of Bushfires Started ........................................................................... 55
6.2.2    Consideration of Issues ............................................................................................................................................. 55
6.2.3    Summary of Assumptions for Quantification of Benefits ............................................................................ 58
6.3      Reduced Disruption (Productivity Losses) ....................................................................................................... 60
6.3.1    Over-Warning (Over-Predicting) .......................................................................................................................... 60
6.3.2    Trial Results & Assumptions ................................................................................................................................... 60
6.3.3    Local Risks ...................................................................................................................................................................... 61
6.3.4    Summary of Assumptions for Quantification of Benefits ............................................................................ 61
6.4      Firefighting Efficiencies ............................................................................................................................................ 62
6.4.1    Cost of Bushfire Management ................................................................................................................................. 62
6.4.2    Efficiency Benefits of NFDRS................................................................................................................................... 62
6.4.3    Potential for Further Productivity Gains ........................................................................................................... 63
6.4.4    Summary of Assumptions for Quantification of Benefits ............................................................................ 63
7.       BENEFITS NOT QUANTIFIED ................................................................................................................... 65
7.1      Enhanced Community Resilience.......................................................................................................................... 65
7.1.1    Rationale.......................................................................................................................................................................... 65
7.1.2    Quantification ................................................................................................................................................................ 66
7.2      Reduced Risk of Over-Prediction .......................................................................................................................... 67
8.       QUANTIFICATION OF NET BENEFITS ................................................................................................... 68
8.1      Summary ......................................................................................................................................................................... 68
8.2      Definitions ...................................................................................................................................................................... 70
8.3      Key Assumptions ......................................................................................................................................................... 70

9.       SENSITIVITY ANALYSIS ............................................................................................................................. 72

                                                                                                                                                                                             3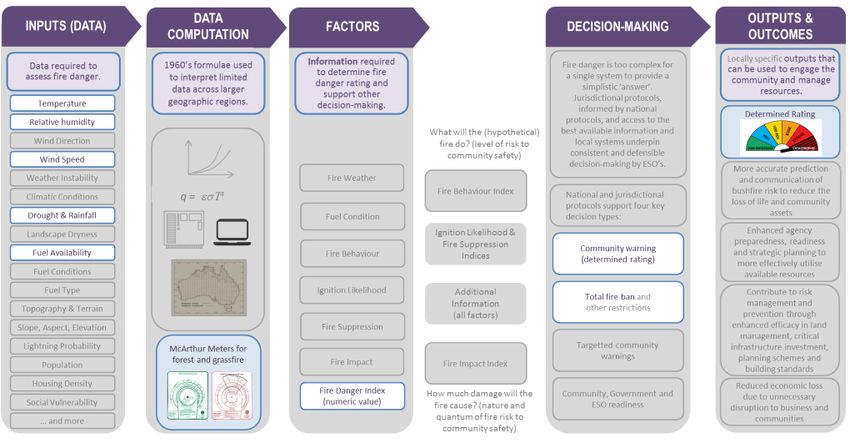
COST BENEFIT ANALYSIS | NATIONAL FIRE DANGER RATING SYSTEM

9.1          Approach ......................................................................................................................................................................... 72
9.2          Summary of Analysis .................................................................................................................................................. 73
APPENDICES ............................................................................................................................................................... 74
A.1  Indicative Costs of Providing Bushfire Management in Australia ........................................................... 74
A.2  Loss of Life From Bushfire ....................................................................................................................................... 77
A.3  Historical Bushfire Disasters (1967 to 2018) .................................................................................................. 79
A.4  Total Fire Bans .............................................................................................................................................................. 82
A.5  Bushfire Restrictions .................................................................................................................................................. 84
A.6  Historic Forecasts of FDR in NSW ......................................................................................................................... 87
A.7  Cost of 2009 Victorian Bushfires ........................................................................................................................... 88
A.8  Major Losses in Victoria ............................................................................................................................................ 90
CONTACT US ............................................................................................................................................................... 92

                                                                                                                                                                                                4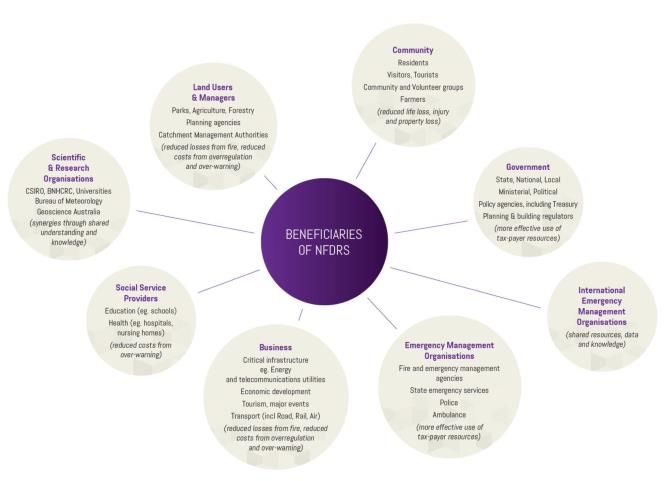
COST BENEFIT ANALYSIS | NATIONAL FIRE DANGER RATING SYSTEM

         Purpose of Report
         In July 2014, emergency management ministers of the Law, Crime and Community Safety Council
         (LCCSC) agreed that the development of a new National Fire Danger Rating System (NFDRS) was
         a national priority.

         In response, the NFDRS Program was established, governed by the National Fire Danger Rating
         System Working Group, under the auspices of the Australia-New Zealand Emergency Management
         Committee (ANZEMC).

         Phase 1 of the NFDRS Program was completed in 2015. In 2016, ANZEMC determined to take a
         phased approach and Phase 2 was initiated. Phase 2 will be completed during 2018/19.

         The NFDRS Program is now seeking funding of $11.7 million for Phase 3 (which is scheduled to
         take three years commencing July 2019) and is currently preparing the Phase 3 Program
         Management Plan for submission to ANZEMC in September 2018.

         This cost benefit analysis has been prepared as part of that submission and builds on work
         undertaken during Phase 1, by the Bushfire and Natural Hazards Cooperative Research Centre
         (BNHCRC) and Cube Group (the 2015 Cube Report)1, on potential cost and benefit impacts of the
         NFDRS.

         This cost benefit analysis incorporates results achieved during Phase 2 from the trial of the
         Research Prototype that has been developed to improve the calculation of a fire behaviour index
         and ratings, and also reflects latest estimates of costs of bushfire losses and bushfire management.

_______________________________
1   National Fire Danger Rating System (NFDRS): Illustrative Impact of Benefits and Costs, September 2015

                                                                                                            5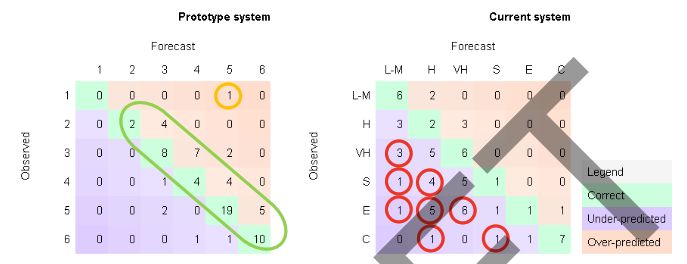
COST BENEFIT ANALYSIS | NATIONAL FIRE DANGER RATING SYSTEM

Abbreviations
 Term             Definition
 ACT              Australian Capital Territory
 AFAC             Australasian Fire and Emergency Service Authorities Council
 ANZEMC           Australia-New Zealand Emergency Management Committee
 BCR              Benefit-Cost Ratio
 BoM              Bureau of Meteorology
 BNHCRC           Bushfire & Natural Hazards CRC
 CFFDRS           Canadian Forest Fire Danger Rating System
 CBA              Cost Benefit Analysis
 CFA              Country Fire Authority Victoria
 CSIRO            Commonwealth Scientific and Industrial Research Organisation
 CWN              Call When Needed
 DFES             Department of Fire and Emergency Services Western Australia
 DSE              Department of Sustainability and Environment Victoria
 ESO              Emergency Service Organisation
 FDI              Fire Danger Index
 FDR              Fire Danger Rating
 FDRS             Fire Danger Rating System
 FFDI             Forest Fire Danger Index
 FY               Financial Year
 GFDI             Grassland Fire Danger Index
 ICA              Insurance Council of Australia
 LCCSC            Law, Crime and Community Safety Council
 NAFC             National Aerial Firefighting Centre
 NDRRA            Natural Disaster Relief and Recovery Arrangements
 NEMP             National Emergency Management Project
 NFDRS            National Fire Danger Rating System
 NPV              Net Present Value
 NSDR             National Strategy for Disaster Resilience
 NSW              New South Wales
 NSW RFS          New South Wales Rural Fire Service
 NT               Northern Territory
 QFES             Queensland Fire and Emergency Services

                                                                                 6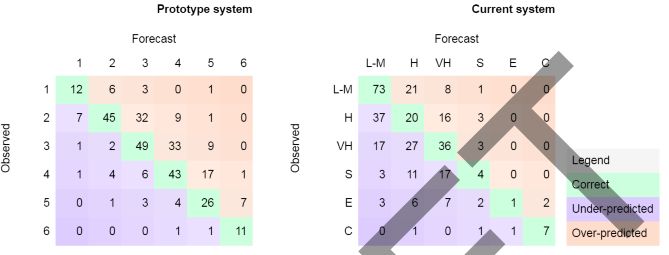
COST BENEFIT ANALYSIS | NATIONAL FIRE DANGER RATING SYSTEM

 Term             Definition
 QLD              Queensland
 SA               South Australia
 SA CFS           South Australia Country Fire Service
 SES              State Emergency Service
 TAS              Tasmania
 TFB              Total Fire Ban
 TFS              Tasmanian Fire Service
 VIC              Victoria
 VSL              Value of Statistical Life
 WA               Western Australia

                                                             7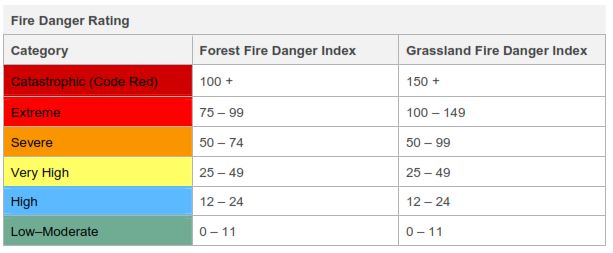
COST BENEFIT ANALYSIS | NATIONAL FIRE DANGER RATING SYSTEM

1.         Executive Summary

1.1        Background
           In July 2014, emergency management ministers of the Law, Crime and Community Safety Council
           (LCCSC) agreed that the development of a new National Fire Danger Rating System (NFDRS) was
           a national priority.

           In response, the NFDRS Program was established. Phase 1 has been completed and Phase 2, which
           included the development and trial of a Research Prototype to improve the calculation of a fire
           behaviour index and ratings, will be completed during 2018/19.

           The NFDRS Program is now seeking funding of $11.7 million for Phase 3 (which is scheduled to
           take three years commencing July 2019).

           This cost benefit analysis (CBA) has been prepared as part of that funding submission and builds
           on work undertaken during Phase 1, by the Bushfire & Natural Hazards CRC (BNHCRC) and Cube
           Group (the 2015 Cube Report)2, on potential cost and benefit impacts of the NFDRS.

           In particular, this CBA incorporates results achieved during Phase 2 from the trial of the Research
           Prototype, and also reflects latest estimates of costs of bushfire losses and bushfire management.

1.2        Cost-Benefit Analysis
           CBA is an appraisal and evaluation technique that estimates the economic, social, and
           environmental costs and benefits of a project or program (in this case Phase 3 of the NFDRS
           Program) on all members of the community, relative to a situation without the proposed decision
           or action (i.e. the base case or ‘business as usual’ scenario).

           The base case is considered to be continuing with the existing McArthur-based fire danger rating
           system and not progressing the NFDRS Program.

           In undertaking our cost-benefit analysis, we have considered how the NFDRS might impact the
           direct/indirect tangible and intangible costs of (i) mitigation (prevention and preparation) and
           suppression activities, and (ii) bushfire losses

           It is important to note that costs in any cost-benefit analysis refer to economic, social, and
           environmental costs, not simply financial costs.

           Reliable estimates of mitigation/suppression costs and bushfire-attributed losses are not readily
           available. We have however estimated annual costs of bushfire losses in Australia at
           approximately $800 million and annual costs of providing bushfire management in Australia (for
           the authorities/agencies in each jurisdiction with lead responsibility for bushfire management) at
           approximately $1.5 billion/year.

           We note that the latter does not include costs associated with more than 200,000 volunteers
           which may be in the order of $3.6 billion annually.

 _______________________________
 2    National Fire Danger Rating System (NFDRS): Illustrative Impact of Benefits and Costs, September 2015

                                                                                                              8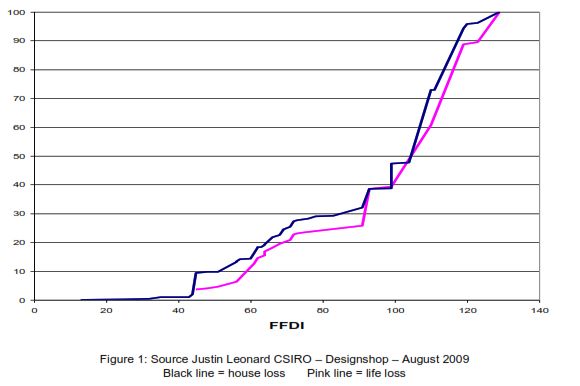
COST BENEFIT ANALYSIS | NATIONAL FIRE DANGER RATING SYSTEM

1.3        Results
           Our analysis indicates high potential returns from the NFDRS with our ‘most likely’ estimate
           presented in Table 1 below.

           Analysis has been done over a 20-year time frame (Year 1 is 2019/20) with all costs and benefits
           discounted to 2018/19 values using a 7% discount rate3.

           Table 1: Results of cost benefit analysis - Central Estimate

                                                                                                       Undiscounted                  Discounted at 7%
                                                                                                           ($m)                      per annum ($m)

             Benefits

             Reduction in quantum of bushfire losses                                                                    399.9                            185.1

             Reduction in number of bushfire losses                                                                      80.0                              37.0

             Reduction in variable suppression costs                                                                     66.8                              31.5

             Total                                                                                                     546.7                            253.6

             Costs

             Capital costs – Phase 3 of NFDRS                                                                            11.7                              10.2

             Additional operating costs of NFDRS (20 years)                                                                5.4                              2.7

             Total                                                                                                       17.1                             12.9

             Net Present Value (NPV)                                                                                                                    240.7

             Benefit Cost Ratio (BCR)                                                                                                                     19.7

1.4        Key Assumptions
           Key assumptions made in reaching the estimate above, and which are discussed in more detail in
           section 6 below, include:

              • Costs of bushfire losses in Australia are approximately $800 million/year and are expected to
                  grow 3% per year, broadly in line with RBA forecasts for GDP growth.4
              • Costs of providing bushfire management in Australia (for the authorities/agencies in each
                  jurisdiction with lead responsibility for bushfire management) is approximately $1.5
                  billion/year and are expected to grow 2% per year based on annual population growth of
                  more than 1.5% over the past decade, and growth in dwelling stock over the past four years
                  in the range 1.5% to 2.0%.5
              • By time of operational launch of the new NFDRS based on the Research Prototype (summer
                  2021/22), the NFDRS will at least match the Current System on over-prediction but will retain
                  the superior under-prediction performance.

 _______________________________
 3    Office of Best Practice Regulation requires the calculation of net present values at an annual real discount rate of 7 per cent – CBA Guidance Note, Feb 2016
 4    Central scenario remains for growth in the Australian economy to average a bit above 3 per cent in 2018 and 2019 – Speech by Philip Lowe, Governor, Sydney
      – 8 August 2018
 5    Speech by Philip Lowe, Governor of Reserve Bank of Australia, Sydney – 8 August 2018

                                                                                                                                                                  9
COST BENEFIT ANALYSIS | NATIONAL FIRE DANGER RATING SYSTEM
• Given the performance of the Research Prototype in reducing under-prediction from 56% to
just 7% (based on case studies of large destructive fires at the higher end of the rating
system), and evidence of potential impacts on reducing bushfire losses with appropriate
levels of readiness, we have assumed a 2% reduction in quantum of larger bushfire losses.
• Given the performance of the Research Prototype in reducing under-prediction, and based on
analysis of number/cause of fire by GFDI, we have assumed a reduction of 0.5% in the number
of fires on the ‘most dangerous’ days and assume that 80% of bushfire losses occur on these
days i.e. reducing the number of fires on the ‘most dangerous days’ will result in a reduction
in annual bushfire losses of 0.4%.
• Increased firefighting efficiency will translate into better firefighting outcomes (i.e. reduced
bushfire losses) rather than significant cost reductions in firefighting services, although some
reduction in variable fire suppression costs might be achieved (see below).
• Variable fire suppression costs represent 20% of bushfire management costs and annual
reductions of 1% in variable fire suppression costs are achieved following implementation of
the NFDRS.
• As we are assuming that over-prediction in the initial implementation of the NFDRS will
match over-prediction in the Current System, we have assumed no benefits for potential
reductions in community disruption nor ‘productivity gains’ associated with volunteers,
although it is anticipated that there will be improvements in over-prediction over time as new
science and improved indices are developed.
• Implementation of a new fire danger rating scale based on the social research being
undertaken, and more localised fire danger ratings, will require changes to the FDR decision-
making framework. As we are uncertain what changes will be made and when/if changes will
be made, we have not quantified nor included potential benefits associated with more
localised fire danger ratings.
1.5 Discussion
Whilst we have adopted a pragmatic approach in estimating costs and benefits, it is important to
note that the evaluation of bushfire risk management is complex, and issues here include:
• Quantifying and valuing all of the tangible and intangible costs of bushfire losses, and
therefore the benefits of avoiding them, is very difficult.
• There are inherent uncertainties in the relationship between bushfire management and
avoided bushfire losses.
• Estimating counterfactual scenarios is virtually impossible as consequences change due to
impact of mitigation activities (e.g. Total Fire Ban declared) and suppression activities (e.g.
initial attack success).
• Significant data limitations in many areas.
There is therefore inherent uncertainty in any estimates of costs or benefits. Given this
uncertainty, we have undertaken sensitivity analysis as summarised in section 1.6 below.
1.6 Sensitivity Analysis
As our analysis indicates high potential returns from the NFDRS (refer Table 1 above), we have
focused our sensitivity analysis on ‘downside’ scenarios.
Our ‘downside’ analysis is shown in Table 2 below and shows impact on NPV and BCR for a 50%
reduction in outcomes and a 90% reduction in outcomes.
10COST BENEFIT ANALYSIS | NATIONAL FIRE DANGER RATING SYSTEM
Table 2: Sensitivity analysis
Most Likely 50% 90%
Scenario Reduction in Reduction in
Outcome’ Outcomes
Benefits
Reduction in quantum of bushfire losses 399.9 200 40
Reduction in number of bushfire losses 80 40 8
Reduction in variable suppression costs 66.8 33.4 6.7
Sub-Total 546.7 273.4 54.7
Present Value of Benefits 253.6 126.8 25.4
Costs of NFDRS
Capital costs – Phase 3 of NFDRS 11.7 11.7 11.7
Additional operating costs of NFDRS (20 years) 5 5 5
Sub-Total 16.7 16.7 16.7
Present Value of Costs 12.9 12.9 12.9
Net Present Value (NPV) 240.7 113.9 12.5
Benefit Cost Ratio (BCR) 19.7 9.8 2.0
Even with a 90% reduction in expected outcomes, the analysis still indicates a positive BCR of 2.0.
1.7 Other Economic Evaluations
An economic evaluation of research to improve the Canadian Forest Fire Danger Rating System
(CFFDRS) was published in 2013 by authors from Department of Natural Resources Canada and
Australia’s CSIRO.6
Similar to the McArthur-based system described in section 3.1 above, the Canadian FFDR System
at that time was based on a system conceptualised more than 40 years prior and had changed
little in the intervening years.
The next-generation CFFDRS envisaged making similar improvements to those contemplated in
Phase 3 of the NFDRS Program.
The 2013 evaluation indicated high levels of net economic benefit if the CFFDRS were to be
enhanced by additional research investment, with ‘most likely’ estimate of net present value
(NPV) of C$1.4 billion and benefit-cost ratio (BCR) of 220.
In making this ‘most likely’ estimate, the researchers relied on ‘expert elicitation’ for ‘low’, ‘most
likely’ and ‘high’ estimates for likely increases/reductions in a range of different parameters with
_______________________________
6 James S. Gould, Mike N. Patriquin, Sen Wang, Bonita L. McFarlane and B. Mike Wotton | Economic evaluation of research to improve the Canadian forest fire
danger rating system, Forestry 2013;86,317-329
11COST BENEFIT ANALYSIS | NATIONAL FIRE DANGER RATING SYSTEM
and without the investment in a next-generation CFFDRS. This estimate also assumed a ‘medium’
research adoption period (as compared to a ‘shorter’ or ‘longer’ period of adoption).
Whilst the researchers considered a wide number of parameters, most of the benefit was derived
from expected savings in variable fire suppression costs and fixed fire suppression costs, with
benefits calculated over 30 years and discounted at 3%.
The returns presented by the Canadian evaluation are extraordinary compared to those seen in
most CBAs.
We have adopted much more conservative assumptions in this CBA, although our ‘most likely’
estimate still shows high potential returns from the NFDRS.
12COST BENEFIT ANALYSIS | NATIONAL FIRE DANGER RATING SYSTEM
2. Background and Context
2.1 Current Fire Danger Rating System
Fire danger indices are used in many parts of the world to integrate meteorological and fuel
information into measures that can be used to issue warnings and/or estimate the difficulty of
putting out fires which may occur.
In Australia, the McArthur Mk V Forest Fire Danger Index (FFDI) and the CSIRO Grassland Fire
Index (GFDI) are used to forecast the influence of weather on fire behaviour, with GFDI being used
for most fuel types except forest.
Forecasts of both indices are issued by the Australian Bureau of Meteorology (BoM). Fire agencies
use these forecasts, together with other factors, to determine Fire Danger Ratings (FDRs) by
area/region which are disseminated to the community.
Since 2009, and in response to the recommendations of the 2009 Victorian Bushfires Royal
Commission, State and Territory governments have adopted revised Fire Danger Rating
categories with fire danger ratings as shown in Figure 1 below.
Figure 1: Fire Danger Rating based on fire danger indices
Prior to the adoption of the fire danger rating scale above, the scale was subdivided into five fire
danger categories (Low, Moderate, High, Very High, and Extreme).
Whilst the revisions to fire danger ratings in 2009 have improved communications (particularly
public warnings as they relate to the top, more dangerous end of the scale), scientific variables
that underpin the fire danger ratings were not reviewed nor used to inform revisions to the fire
danger ratings.
It was recognized, as part of the review, that an evaluation of the science driving the fire danger
index was also needed.7
_______________________________
7 AEMC - National Bushfire Warnings Taskforce, 2009
13COST BENEFIT ANALYSIS | NATIONAL FIRE DANGER RATING SYSTEM
In operational use since the 1960s, the current McArthur-based fire danger rating system (Current
System) was designed for general fire danger forecasting and relies on simple weather data
inputs.
The current McArthur-based FDR system does not cover fire behaviour and fire danger for all
major vegetation types in Australia (just grassland and dry sclerophyll eucalypt forest) and does
not adequately reflect our current knowledge of fire behaviour and modern science, nor advances
in communication, technology, and systems.8
Specific limitations of the current McArthur-based fire danger rating system in Australia are
outlined in more detail in section 3.1 below.
2.2 NFDRS Program
In July 2014, emergency management ministers of the LCCSC agreed that the development of a
new NFDRS was a national priority.
In response, the NFDRS Program was established, governed by the National Fire Danger Rating
System Working Group, under the auspices of the ANZEMC.
The NFDRS Program seeks to achieve the following:9
• Greater scientific accuracy behind decisions to enable more accurate advice and warnings.
• Greater ability to understand and predict local fire danger risk.
• Improved community awareness of risk exposure and increased confidence in the
information being provided.
• Increased safety, health, and wellbeing for the community.
• More efficient use of national, jurisdictional, and local resources.
During Phase 1, a Program Management Plan and supporting documents were developed. The
NFDRS Program proposed at the end of Phase 1 was estimated to cost in the order of $42 million.
In addition, jurisdictions were required to identify and enact the appropriate legislative and policy
changes that support the implementation of a new NFDRS.9
In April 2016, ANZEMC agreed to a phased approach to deliver the system, with the following
deliverables approved for Phase 2:
• Establishment of Program Board and Program Management Office (AFAC – implemented).
• Development of a research prototype Fire Behaviour Index to test the various elements of the
requirements and providing greater control over costs and scheduling (NSW RFS –
completed).
• Social research into community understanding of fire danger (SA CFS – underway).
• Preparation of a revised Program Management Plan for subsequent development (under
development).
_______________________________
8 Claire S Yeo et al, Bushfire & Natural Hazards CRC | Fire Danger Indices: Current Limitations and a Pathway to Better Indices, 2014
9 National Fire Danger Rating System (NFDRS), Five Year Program Management Plan (PMP), December 2015, Final Version v1.2
14COST BENEFIT ANALYSIS | NATIONAL FIRE DANGER RATING SYSTEM
Since the establishment of the NFDRS Program in 2014, the first two phases have proceeded to
plan with progress to date summarised in Table 3 below.
A detailed report presenting the findings of the project that developed the Research Prototype is
currently in draft10 and is due to be presented to ANZEMC in September 2018.
Funding for these first two phases has comprised grant funding of $1.7 million from the National
Emergency Management Project (NEMP) and additional support from fire and emergency
services, land management agencies, BoM, BNHCRC, AFAC, and Emergency Management
Australia.
_______________________________
10 Matthews S, Fox-Hughes P, Grootemaat S, Hollis JJ, Kenny BJ, Sauvage S (2018) National Fire Danger Rating System: Research Prototype, NSW Rural Fire
Service, Lidcombe, NSW, 383 pp.
15COST BENEFIT ANALYSIS | NATIONAL FIRE DANGER RATING SYSTEM
Table 3: NFDRS Program – key deliverables to date
Element 2014-15 2015-16 2016-17 2017-18 2018-19
Phase 1 Phase 2
Project • Requirements Summary (May 2015) • Establish Program Board and Program Management Office
Management • Phase 1: Preferred Implementation Approach (Aug 2015) • Revised High Level Costings • Phase 3 Program
• Illustrative Impact of Benefits & Costs (Sep 2015) (June 2018) Management Plan (Sept
• Five-Year Program Roadmap (Nov 2015) 2018)
• Five-Year Program Management Plan (Dec 2015)
Fire • Research Prototype system • Calibrate/refine Research
Behaviour built. Prototype.
Index • System operated • Include northern dry
demonstrating ratings can be season in live trial.
applied in live trial. • Evaluate NFDRS for
• Evaluation Report prepared: prescribed burning
– Found Research • Publish evaluation.
Prototype more accurate
than Current System.
– Identified knowledge
gaps
– Recommended next
steps for development
Other Indices • Scope other indices
Social • Plan/conduct social
Research research into community
understanding of fire
danger
16COST BENEFIT ANALYSIS | NATIONAL FIRE DANGER RATING SYSTEM
2.3 Key Components
The key components of the NFDRS as conceived are illustrated in Figure 2 below with comparison to the Current System shown in Figure 3 below.
Figure 2: Key components of proposed NFDRS11
_______________________________
11 National Fire Danger Rating System (NFDRS), Five Year Program Management Plan (PMP), December 2015, Final Version v1.2
17COST BENEFIT ANALYSIS | NATIONAL FIRE DANGER RATING SYSTEM
Figure 3: System view comparison of Current System as compared with proposed NFDRS12
Grey areas of diagram represent future development for the NFDRS Program and white areas indicate current (sometimes limited) functionality
_______________________________
12 National Fire Danger Rating System (NFDRS), Five Year Program Management Plan (PMP), December 2015, Final Version v1.2
18COST BENEFIT ANALYSIS | NATIONAL FIRE DANGER RATING SYSTEM
In essence, the NFDRS will incorporate more of the inputs necessary to assess fire danger, and use
the latest science and systems, to better predict six factors (fire weather, fuel conditions, fire
behaviour, ignition likelihood, fire suppression and impact on life, assets, and the environment)
important to determining fire danger ratings and to supporting decision-making.
Incorporating more data elements will increase the accuracy of forecasts and reduce the
uncertainty around estimates.
The six factors, which will inform decision-making and enable a Fire Danger Rating to be set, are
explained in more detail in Table 4 below.
Table 4: NFDRS Factors
Factor Description
Fire Weather Fire weather is a combination of climate (drought, severe weather,
recurrence) and weather (temperature, humidity, wind speed, wind
direction, instability). It also takes into consideration landscape dryness,
chance of extreme events and atmospheric instability.
Fuel Condition Fuel conditions includes hazard, dryness, flammability, availability, and
continuity derived from data about the landscape/topography (slope,
aspect, elevation) and fuel (structure, quantity, exposure, growth).
Fire Behaviour Fire behaviour includes elements like spread/growth, ember density and
distance, flame height and depth, radiation, convection, power, and energy
Ignition Likelihood Ignition likelihood includes natural and human ignitions with a focus on
ease of ignition and probability of ignition.
Fire Suppression Fire suppression includes resource capacity and chance of success or
failure
Fire Impact Fire impact is also commonly known as fire damage and includes chance
of loss of life, loss of property, impact on the built environment, impact on
the natural environment, economic impact, and social impact.
The fire danger ratings will reflect both fire behaviour and impact, and deliver more locally
specific outputs, so that warnings, mitigation, and suppression can be more targeted.
2.4 Improved Decision-Making
The enhancements described above will result in the NFDRS supporting improved decision-
making, before and during bushfires, in the following areas:
• Community warnings (declared rating).
• Additional community or localised messaging for vulnerable communities and other at-risk
groups.
• Total fire bans and other restrictions.
• Prescribed burning.
• Determining readiness levels of emergency service organisations (ESOs).
• Informing suppression strategy, resourcing, and planning.
19COST BENEFIT ANALYSIS | NATIONAL FIRE DANGER RATING SYSTEM
2.5 Beneficiaries
Reliable predictions of fire danger are critical to a wide variety of decision-making. The 2015 Cube
Report noted that the proposed NFDRS would benefit many organisations and groups as set out
in Figure 4 below. Insurers would be another group that could be expected to benefit from the
NFDRS.
Figure 4: Organisations and groups that will benefit from the NFDRS13
2.6 Indices
Fire is a multi-faceted hazard and it may be necessary to use several indices to represent the risk.14
The NFDRS splits the fire danger rating into a Fire Behaviour Index, and three further indices that
consider ignition likelihood, suppression, and fire impact.
To date, the NFDRS Program has built a Research Prototype incorporating a new Fire Behaviour
Index and new ratings scale.
Scoping of three other indices (Ignition Likelihood Index, Suppression Index, and Fire Impact
Index) will occur in 2018/19 with development of a research prototype of the three indices
proposed for Phase 3 of the NFDRS Program.
_______________________________
13 National Fire Danger Rating System (NFDRS): Illustrative Impact of Benefits and Costs, September 2015
14 Claire S Yeo, Jeffrey D Kepert, Robin Hicks, Fire Danger Indices: Current Limitations and a Pathway Towards Better Indices.
20COST BENEFIT ANALYSIS | NATIONAL FIRE DANGER RATING SYSTEM
By accounting for the likelihood (e.g. probability of ignition) and consequences (e.g. possible asset
damage), warnings and mitigation can be better targeted, and emergency resources more
effectively deployed.
2.7 Outcomes
The outcomes expected from the NFDRS Program include:
• More accurate prediction and communication of bushfire risk.
• More locally specific outputs that can be used to engage the community and manage
resources.
• Enhanced agency preparedness, readiness, and strategic planning – enabling more efficient
and effective use of resources.
• Reduced risk of loss of life and assets from bushfires.
• Reduced economic loss due to unnecessary disruption to business and communities.
• Contribution to risk management and prevention through enhanced efficacy in land
management, critical infrastructure investment, planning schemes and building standards.
2.8 Key Deliverables To Date
2.8.1 Research Prototype
A key deliverable achieved in Phase 2 was the development of a Research Prototype to improve
the calculation of a fire behaviour index and ratings.
The purpose of the Research Prototype was to demonstrate that it is feasible to develop a fire
danger rating system based on fire behaviour models and which is national, modular, and open to
continuous improvement.
The Research Prototype was used to conduct a nationwide interactive trial over the 2017/18
southern fire season, with all jurisdictions participating and providing input. The trial compared
the calculated prototype fire danger ratings to the existing fire danger ratings.
Detailed results of the trial are presented in section 4 to this report.
2.8.2 Social Research
As part of Phase 2, social research has been commissioned to:
• Understand levels of comprehension, use, uptake, and effectiveness that exist for the current
FDR.
• Investigate what form and characteristics would a new NFDRS require in order to improve
community safety outcomes.
The social research commenced on 1 July 2018 and is scheduled to be finalised by February 2019.
This social research will potentially impact on the messaging and signage that is used to convey
Fire Danger Ratings to the general community.
21COST BENEFIT ANALYSIS | NATIONAL FIRE DANGER RATING SYSTEM
2.8.3 Other Work
Other work that will be undertaken in 2018/19 includes:
• Further evaluation and calibration of the Research Prototype over the 2018-19 northern and
southern fire season.
• Investigation of the application of the NFDRS to prescribed burns using the Research
Prototype.
• Publication of Research Prototype methodologies and findings in scientific journals.
• Scoping a project plan for the three other indices (Ignition Likelihood Index, Suppression
Index and Fire Impact Index).
• Completing the Phase 3 Program Management Plan including a series of high level
consultation workshops and a cost benefit analysis.
2.9 Next Steps
Following development of the Research Prototype, and consistent with the phased approach
adopted to date, the NFDRS Program is now seeking Phase 3 capital funding of $11.7 million to:
• Plan, build and implement the new system for fire behaviour (Fire Behaviour Index) i.e. take
prototype to operational implementation.
• Develop prototype indices to provide assessment of social, economic, and environmental
impacts of fire:
– Ignition Likelihood Index
– Suppression Index
– Fire Impact Index
• Implement an improved FDR decision making framework, including information to
community informed by social research.
• Maintain Program Management Office.
Phase 3 is scheduled to take three (3) years commencing July 2019 with the new NFDRS using the
operational version of the Research Prototype expected to be implemented in time for the
2021/22 summer fire season.
In addition, there is ongoing operational costs for the NFDRS of approximately $0.2 million per
year.
The NFDRS Program is currently preparing the Phase 3 Program Management Plan for submission
to the Australia-New Zealand Emergency Management Committee in September 2018. This cost
benefit analysis has been prepared as part of that submission.
At the end of Phase 3, there will be a gateway review process to determine whether or not to
proceed to Phase 4 of the NFDRS Program i.e. the transition of the three research prototype
indices (fire impact, ignition likelihood and suppression capability) into operational use.
It should be noted that the Phase 3 funding request above does not include policy and legislative
activities, national collaboration activities nor change management activities. These activities are
expected to be managed at the jurisdictional level.
22COST BENEFIT ANALYSIS | NATIONAL FIRE DANGER RATING SYSTEM
3. Case for Change
3.1 Limitations of Current System
In operational use since the 1960s, the current McArthur-based fire danger rating system was
designed for general fire danger forecasting and relies solely on meteorological data inputs.
The McArthur-based system does not cover all major vegetation types in Australia (just grassland
and dry sclerophyll eucalypt forest) and does not adequately reflect our current knowledge of fire
behaviour and modern science, nor advances in communication, technology, and systems.15
The system is also unable to consider risk to life and property should a fire occur and cannot be
modified to incorporate these considerations.
Specific limitations of the current McArthur-based fire danger rating system in Australia include:16
• Limited to just two fuel types which only account for 23% (grassland) and 6% (dry
sclerophyll eucalypt forest) of vegetation types across Australia (refer Figure 5 below).
• Current fire danger ratings do not reflect potential for community losses (i.e. impacts).
• Fire danger ratings do not incorporate advances in our understanding of fire behaviour.
• Fire danger ratings do not adequately take into account advances in our understanding of
atmospheric stability, nor consider other important factors such as overnight air temperature
and relative humidity.
• Does not account for fuel variability (e.g. availability, load, type, and structure) and other risk
factors.
• High degree of error, particularly at the upper end of the fire danger scale, where risk is
highest and where accuracy is needed most.
• Fire danger is forecast over large areas when more specific localised models are required.
• System does not include some of the worst-case conditions that have been experienced since
the system was developed.
• Fire danger ratings are sometimes poorly understood by both practitioners and the general
public.
• Fire danger ratings are not targeted towards specific applications (e.g. development
assessment, suppression difficulty, impact/consequence determination) nor specific
audiences (e.g. scientists, practitioners, burn planners and general public).
• Subjective application of system around Australia limits ability to assess accuracy and
application.
The most severe conditions represented by both FFDI and GFDI were based on then known
‘worst-case’ fires (the 1939 Black Friday for forests, and the 1952 Mangoplah for grasslands).
_______________________________
15 Claire S Yeo et al, Bushfire & Natural Hazards CRC | Fire Danger Indices: Current Limitations and a Pathway to Better Indices, 2014
16 Matthews S, Fox-Hughes P, Grootemaat S, Hollis JJ, Kenny BJ, Sauvage S (2018) National Fire Danger Rating System: Research Prototype, NSW Rural Fire
Service, Lidcombe, NSW, 383 pp
23COST BENEFIT ANALYSIS | NATIONAL FIRE DANGER RATING SYSTEM
Weather conditions for these ‘worst case’ fires have since been exceeded a number of times (e.g.
Ash Wednesday 1983, Black Saturday 2009) which limits the applicability of the McArthur-based
FDRS in situations where the conditions may be out of the range of those meters.17
In addition, the current System was never designed to inform community warnings and is ill-
suited to do so, yet it is the only measure available to inform warnings.
The National Framework for Warnings relies on the FDI to determine the level of community
warning to be issued during a fire emergency. This directly impacts upon the accuracy and
effectiveness of community warnings and is a key vulnerability for emergency services.
Figure 5: Fuel types to be covered by NFDRS
3.2 Improved Decision-Making
The limitations outlined above mean that the current fire danger rating system does not
adequately model and communicate the impact of fire danger, meaning decision-making is sub-
optimal.
The NFDRS seeks to improve decision-making as follows:
• Fire danger ratings based on local fuel type and condition, and local weather, leading to:
– Better decisions based on level, nature, and scale of risk.
– Increased ability to determine appropriate ratings and information to be disseminated.
• Nationally consistent, defensible decision-making.
• More accurate application of regulations and restrictions (e.g. total fire ban, cease harvest
etc).
_______________________________
17 S. Harris, W. Anderson, M. Kilinc and L. Fogarty | Establishing a link between the power of fire and community loss: The first step towards developing a
bushfire severity scale Fire and adaptive management report no. 89
24COST BENEFIT ANALYSIS | NATIONAL FIRE DANGER RATING SYSTEM
• Agency readiness better aligned to forecast risk.
• Support long-term strategic risk-mitigation decisions
– Prescribed burning
– Land-use planning
– Critical infrastructure protection
3.3 Costs of Inaccurate Ratings
The Fire Danger Rating (FDR) is an early indicator of the potential danger should a bushfire start
and is a trigger for communication, mitigation, and suppression readiness activities.
Analysis of historical losses show that most losses (life and houses) have occurred when the
Forest Fire Danger Rating (FFDR) has been Severe (FDI 50-74), Extreme (FDI 75-99) and
Catastrophic/Code Red (FDI 100+), as shown in Figure 6 below. Cumulative loss of life (%) is
shown in pink, and cumulative house losses (%) are shown in blue.
Figure 6: Historical losses by reference to FDI calculations18
Further analysis of historic losses (life and property) is included in Appendix A.2 and Appendix
A.3.
Evaluation of the Current System and the Research Prototype, for a sample of case studies
comprising large destructive fires at the higher end of the rating system (refer section 4 below),
found that the Current System had a significant under-prediction bias.
_______________________________
18 AMEC – National Bushfire Warnings Taskforce, Australia’s revised arrangements for bushfire advice and alerts, Version 1.1 October 2009
25COST BENEFIT ANALYSIS | NATIONAL FIRE DANGER RATING SYSTEM
Under-predicting the fire danger rating is dangerous, especially at the higher end of the scale,
because this is where there is most risk, and where most of the loss of life and loss of houses
occurs.
If under-predictions can be reduced, then the risk of loss of life and property also reduces, because
damage from fires may be reduced (because agency readiness is at an appropriate level) or
because the fires never start due to appropriate mitigation activities (e.g. regulatory actions such
as total fire bans, and industry risk mitigation procedures modifying or ceasing an activity that
might start a fire, etc).
Conversely, over-predicting (i.e. false alarms) results in productivity losses (unnecessary total fire
bans, school closures, restrictions on agriculture etc), over-preparedness of fire agencies (costs of
aircraft on stand-by, productivity losses associated with volunteer firefighters etc), unwanted
anxiety, and loss of trust/credibility in the forecasts.
3.4 Increases in Extreme Fire Weather
Since the 1970’s, there has been an increase in extreme fire weather, and a longer fire season,
across large parts of Australia.
Figure 7 below shows national trends from 1974 to 2015 in annual 90th percentile of daily FFDI
at 38 climate reference locations.
Trends are in FFDI points per decade and filled circles represent statistically significant trends
with larger circles representing larger trends. Trends are upward (in red), except for Brisbane
airport (in blue).19
Figure 7: Trends in extreme fire weather days19
_______________________________
19 Bureau of Meteorology, CSIRO – State of the Climate 2016
26COST BENEFIT ANALYSIS | NATIONAL FIRE DANGER RATING SYSTEM
The Bureau of Meteorology note that the ‘annual 90th percentile of daily FFDI points has increased
since 1974 across Australia, especially in southern and eastern Australia, and the fire season has
lengthened. Increasing temperatures and drying contributed to the observed upward trend in
FFDI’.20
With weather conditions conducive to fire becoming increasingly frequent, the need for accurate
and reliable fire danger warnings becomes even more important.
3.5 Consistency with Government Policy
3.5.1 Disaster Resilience
Australia's National Strategy for Disaster Resilience (NSDR)21 acknowledges the increasing
severity and regularity of disasters in Australia and the need for a coordinated and cooperative
national effort to enhance Australia's capacity to withstand and recover from emergencies and
disasters.
Whilst disaster resilience is described in the NSDR as a collective responsibility, the NFDRS
Program is consistent with the role of government outlined in the NSDR including:
• Having effective arrangements in place to inform people about how to assess risks and reduce
their exposure and vulnerability to hazards.
• Developing and implementing effective, risk-based land management and planning
arrangements and other mitigation activities.
• Having clear and effective education systems so people understand what options are available
and what the best course of action is in responding to a hazard as it approaches.
• Supporting individuals and communities to prepare for extreme events.
• Ensuring the most effective, well-coordinated response from our emergency services and
volunteers when disaster hits.
3.5.2 Mitigation of Disaster Risk
In 2014, the Productivity Commission conducted an inquiry into the efficacy of natural disaster
funding arrangements in Australia in response to concerns that the consequences of some natural
disasters could be mitigated but that funding arrangements were weighted towards disaster
recovery, so reducing incentives for mitigation of disaster risk. 22
The NFDRS Program, being a program to improve disaster risk mitigation, is again consistent with
the findings and recommendations of that report including:
• Mitigation expenditure across all levels of government is likely to be below the optimal level.
• Information is critical to understanding and managing natural disaster risk. Hazard and risk
exposure information has improved significantly in recent years, but there are opportunities
to improve information consistency, sharing and communication.
• Governments at all levels should make new and currently held natural hazard data publicly
available in accordance with open public sector information principles.
_______________________________
20 Bureau of Meteorology, CSIRO – State of the Climate 2016
21 National Strategy for Disaster Resilience, Council of Australian Governments, February 2011.
22 Productivity Commission 2014, Natural Disaster Funding Arrangements, Inquiry Report no. 74, Canberra. JEL code: H77, H84.
27You can also read