National Institute
of Population and
Social Security
Research
←
→
Page content transcription
If your browser does not render page correctly, please read the page content below
National Institute of Population and Social Security Research
Message from the Director-General
Coping with low fertility and an aging population are the crucial policy challenges for Japan. Having
undergone dramatic economic growth and rapid social developments after the Second World War, our
longevity and living standards have greatly risen. However, with a large increase of elderly people, social
security expenditures to the public pension, medical and nursing care services and so on, have also increased
markedly. Meanwhile, the youth population, who should shoulder those social security burdens, has been
continuing to decline, which was recently followed by a decline of the total population. Amid these challenges,
how to sustain our living standards is the greatest issue for Japan.
      Indeed, the rapidly-aging society and the shrinking population are a world’s first for humankind. Japan
is now beginning on this trend, however it is not only the case of Japan; more than a few Asian countries and
other countries in the rest of the world are to encounter the same challenges sooner or later. Therefore, our
experiences grappling with those challenges should be the touchstone for all the people in the world.
      In order to address these challenges and create a sustainable, healthy and culturally vibrant society for
all people, highly precise and detailed scientific evidences are indispensable for policy makers. Our mission
is to produce such data through our own researches, social surveys on the multi-facets of demographics and
people’s lives, and highly precise population projections.
      Our institution, the National Institute of Population and Social Security Research, placed under the
Ministry of Health, Labour and Welfare, was established in 1996 through the integration of the former two
public policy research institutes; the Institute of Population Problems, placed under the Ministry of Health
and Welfare, and the Social Development Research Institute, which was a governmental cooperation.
Along with investigating the multi-facets of demographics and people’s lives, we have conducted a plenty of
independent researches concerning social security policies of Japan and other countries. The data we produce
on demographics are the foundations for determining the entire range of national and local public policies,
including the public pension and other social security policies. Furthermore, our data are highly evaluated
not only by public policy makers, but also by those in the business sector, international organizations, and
academics all over the world.
      In addition, regional disparities and time-series f luctuations of fertilities, the pace of aging and
population decline are extreme in Japan, and people’s values and lifestyles have also diversified recently so
much. Moreover, other relevant issues such as poverty, gender inequality, and social inclusion at community
level are also at the top of the agenda. Our mission is to cover all those issues, produce high-quality scientific
evidences and disseminate them widely to the society, in the collaboration with all related agencies of national
and local governments, and academic institutions in Japan and the world.
      We, all IPSS staff, shall realize our mission and responsibility to society and endeavor to reach to a higher
goal than ever. We sincerely ask for your understanding and warm support to our activities.

     April 2020

                                                                                                 Kuniaki Tanabe
                                                                                                Director-General
                                                                             National Institute of Population and
                                                                                        Social Security Research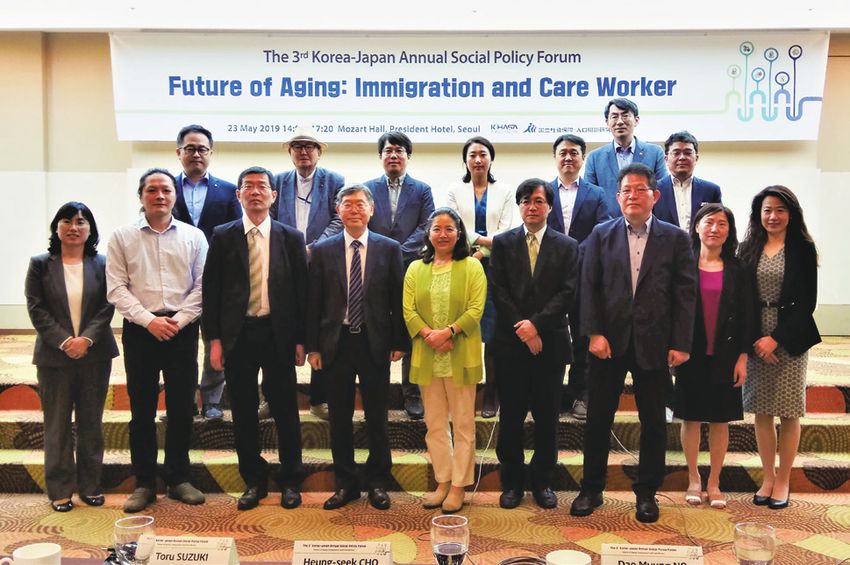
Table of Contents
Message from the Director-General ���������������������������������������������������������������������������������������������������� 1

Table of Contents ���������������������������������������������������������������������������������������������������������������������������������2

History �������������������������������������������������������������������������������������������������������������������������������������������������3

Population Projection ������������������������������������������������������������������������������������������������������������������������� 4

The Financial Statistics of Social Security in Japan
Providing data for relevant government ministries and international organizations����������������������� 6

Annual Population and Social Security Surveys (general statistics) ��������������������������������������������������7
The National Fertility Survey
The National Survey on Migration ����������������������������������������������������������������������������������������������������� 8
The National Survey on Social Security and People’s Life
The National Survey on Family in Japan ������������������������������������������������������������������������������������������� 9
The National Survey on Household Changes

Major Research Projects ��������������������������������������������������������������������������������������������������������������������10
1. Research for a society in which everyone is able to participate
   A Comprehensive Study on the Realization Strategy of Japan’s Plan for Dynamic Engagement
   of All Citizens (from FY2017) [In-house project]
2. Demographic and interdisciplinary analysis of Japan’s longevity ����������������������������������������������� 11
   Modeling and Comprehensive Analysis of Population, Economy and Society of Ultra-Longevity
   (FY2020–2022) [In-house project]
3. A mid the massive immigration inflow, shedding light on the dynamics of emigration pressure
    from Asian countries ���������������������������������������������������������������������������������������������������������������������12
    Survey on Emigration Pressure of Asian Countries (FY2019–2020) [In-house project]
4. Big data utilization in the health promotion measures of local governments ����������������������������� 13
   Project for the promotion of evidence-based policy-making in the health sector by local
   governments using the claims data for health and long-term care insurance
   (FY2020) [In-house project]

Other Research Projects

International Cooperation �����������������������������������������������������������������������������������������������������������������14

Seminars��������������������������������������������������������������������������������������������������������������������������������������������� 15

Publication, Database������������������������������������������������������������������������������������������������������������������������� 16
Library

Organization �������������������������������������������������������������������������������������������������������������������������������������� 17

Advice and Evaluation by External Experts �������������������������������������������������������������������������������������18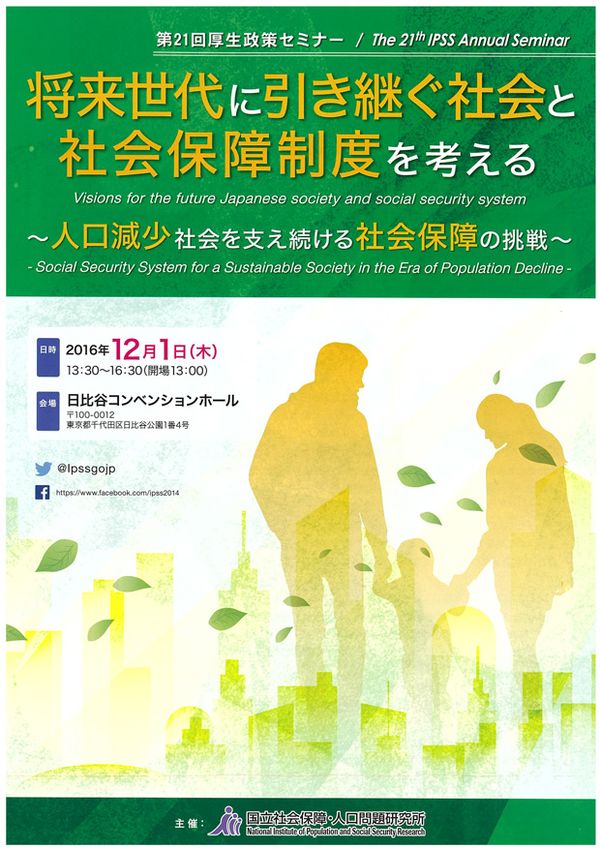
History
                Institute of              1939.8         Institute of Population Problems established
       Population Problems
                                            1940.4            Publication of the Journal of Population Problems started

                                              1940.5             The first estimation of future population

                                                                  Integrated with Research Institute of the Ministry of Health and
                                                   1942.11         Welfare to become Department of Population of the Ministry’ s
                                                                   Research Institute

                                                                       Attained independence once again to become the Institute of
                                                     1946.5
                                                                       Population Problems

        Recommendation of the establishment
         of a research institute by the Advisory        1962.8
              Council on Social Security System

                  Social Development Research
                           Institute established
                                                             1965.1        Social Development Research Institute

                   Publication of the Quarterly of             1965.1
                  Social Security Research started

                         Publication of the Overseas             1968.1
                        Social Security News started

                           Started collecting statistics              1984.8
                             on social security benefits

             National Institute of Population                           1996.12
                                                                                        Integration of Institute of Population Problems and
             and Social Security Research                                                Social Development Research Institute

                                                                          2014.8          75th Anniversary of Institute of Population Problems

                                       50th Anniversary of                     2015.1
                       Social Development Research Institute

                 20th Anniversary of Institute of Population and                2016.12
                                       Social Security Research

    Before World War II, the concern for overpopulation grew due to the food shortage and unemployment, and population
    problems drew wide public attention in view of securing human resources. Consequently, in August 1939, the Institute of
    Population Problems was established. It was the first national research institute in the world that focused on population
    issues. After World War II, a decline in fertility rates and the aging of the population became evident as the economy
    developed, and the importance of systems and policies to cope with these issues became apparent.
          Moreover, social security in Japan progressed steadily and the universal coverage of public pension and health
    insurance was achieved by the mid-1960s. However, basic as well as comprehensive research systems to study social
    security had yet to be organized. In January 1965, the Social Development Research Institute was established under the
    recommendation of Advisory Council on Social Security System.
          Continuous trends of low fertility, aging, and slowdown in economic growth have brought the relationship between
    population and social security closer. As such, there arose a growing need to understand the interaction between the two
    fields. On the other hand, during this period, the reorganization of research institutions under the Ministry of Health
    and Welfare was requested in the context of government reform to better cope with the evolving situation of Japanese
    society. In December 1996, the Institute of Population and Social Security Research was created by integrating two
    institutes – the Institute of Population Problems and the Social Development Research Institute.
          August 2014 marked the 75th anniversary of the Institute of Population Problems, January 2015 marked the 50th
    anniversary of the Social Development Research Institute, and December 2016 marked the 20th anniversary of the
    Institute of Population and Social Security Research.

3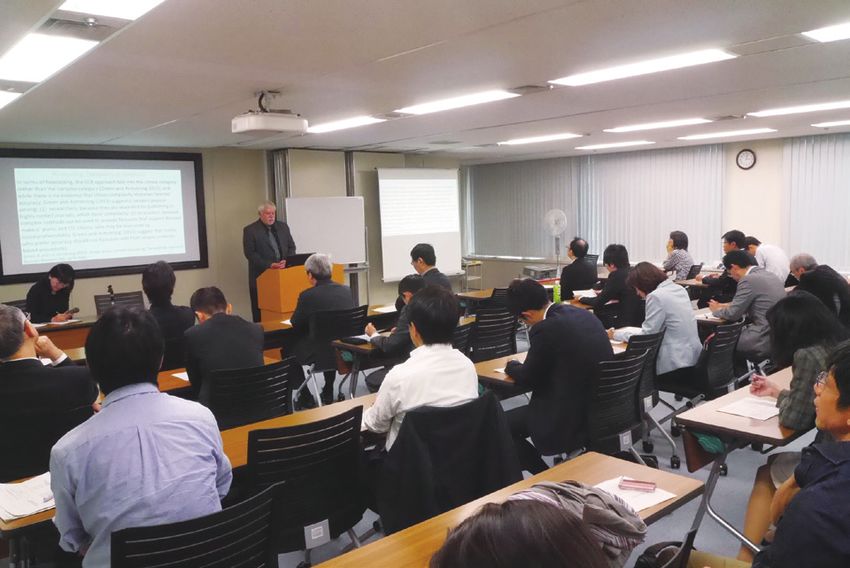
Population Projection
In order to provide basic information for planning the mid- to long-term national social security systems and for other
related policies, the National Institute of Population and Social Security Research releases various population and
household projections: “Population Projections for Japan,” “Regional Population Projections for Japan,” Household
Projections for Japan,” and “Household Projections for Japan by Prefecture.”
Population Projections for Japan
“Population Projections for Japan” is a projection of the overall size and the age-sex breakdown of Japan’s future
population, used widely as an important reference by the national and local governments and in other various fields.
These projections are based on demographic analyses using the Census, vital statistics, and the national representative
surveys conducted by the Institute.
● Population in Japan
(Million)
98.27 million 127.09 million 88.08 million
140 Total Population
(1965) (2015) (2065)
120
Population aged 65+
50.56 million
36.65 million 26.6%
(2115)
100 (1880) 43.85 million
(1900) 6.3%
80
60 68.1% 38.4%
Population aged 15 to 64 60.8%
40
51.4% Sources: Population Estimates by
20 the Cabinet Bureau of Statistics,
25.6% “Population Census”, “Population
Population aged 0 to 14 12.5% Estimates”, by Statistics Bureau,
10.2%
0 Population Projections for Japan:
1880 1900 1920 1940 1960 1980 2000 2020 2040 2060 2080 2100 2016-2065 (Medium Variant)
Year
● Changes in Population Pyramid
1965 120 2065
100
Male 90 Female 120
80 Male Female
70 100
60
50 90
40
80
30
20
70
10
0
120 100 80 60 40 20 0 0 20 40 60 80 100 120 60
Population (10,000)
50
Fertility – low variant
40
2015 120
100
30 Fertility – medium variant
Male 90 Female
20
80
Fertility – high variant
70
10
60
50
0
40
120 100 80 60 40 20 0 0 20 40 60 80 100 120
30
Population (10,000)
20
10
0 Sources: Population Projections for Japan: 2016-2065 (Medium Variant)
120 100 80 60 40 20 0 0 20 40 60 80 100 120
Population (10,000)
Sources: Population Census
4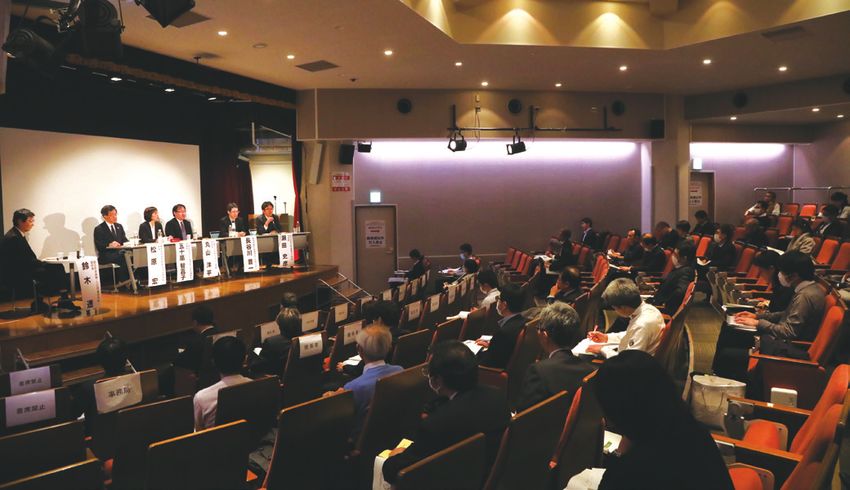
Regional Population Projections
    Under the circumstances of the aging population and low fertility rates throughout the country, regional population
    projections for Japan are used as the basic data for formulating various socioeconomic and community welfare plans.
         While the population is declining and aging nationwide, there are considerable regional variations in the trends of
    the elderly population and the aging rate.

    ● Population aged 65 and over (aged 65–74, and 75 and over) by prefecture (2015 and 2045)

                                                                                                                         (10,000)
                   0   50     100       150      200        250         300         350         400         450         500

         Tokyo
     Kanagawa
         Osaka
       Saitama
          Aichi
         Chiba
        Hyogo
      Hokkaido
       Fukuoka
      Shizuoka
        Ibaraki
     Hiroshima
         Kyoto                           75 years old or older (2045)
        Miyagi
                                                                                                                                2045
                                         65-74 years old (2045)
        Niigata
       Nagano                            75 years old or older (2015)
        Gunma
           Gifu
                                         65-74 years old (2015)
      Okayama
        Tochigi
     Fukushima
            Mie
     Kumamoto
     Kagoshima
       Okinawa
         Shiga
         Ehime
     Yamaguchi
          Nara
      Nagasaki
        Aomori
          Iwate
           Oita
       Ishikawa
     Yamagata
      Miyazaki
       Toyama
                                                                                               2030
          Akita
                                                                                                                         50% and over
       Kagawa
     Wakayama                                                                                                            40 to 50%
     Yamanashi
                                                                                                                         30 to 40%
          Saga
          Fukui                                                                                                          20 to 30%
     Tokushima
                                                2015                                                                     20% and under
         Kochi
      Shimane
         Tottori                                           ● Percentage of population aged 65 and over
                                                             by municipality in 2015, 2030 and 2045
                                                             * Fukushima Prefecture is a projection for the entire prefecture

                                                              Sources: 2015 Census and Regional Population Projections for Japan: 2015-2045

5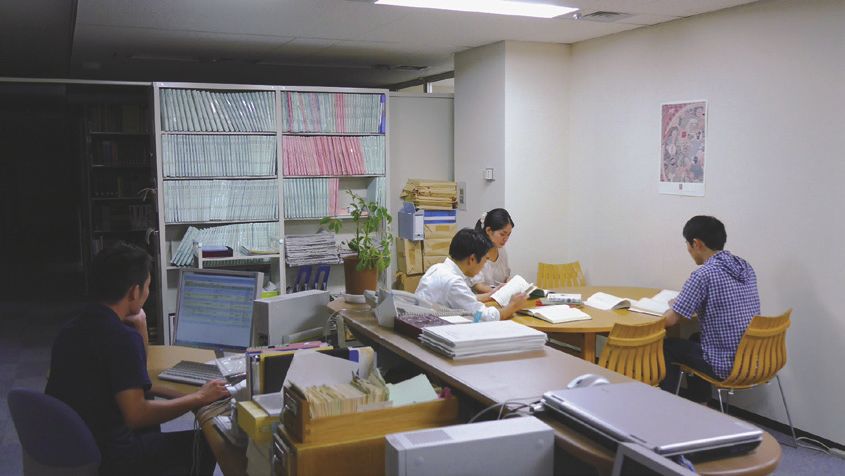
The Financial Statistics of Social Security in Japan
Providing data for relevant government ministries and international organizations
Every year, the National Institute of Population and Social Security Research releases “The Financial Statistics of Social
Security in Japan.” The statistics estimate both total and categorical amounts of annual receipt and expenditure on social
security schemes in Japan on the basis of two international standards; the ILO (International Labour Organization)
standards and the OECD (Organization for Economic Co-operation and Development) standards. In 2012, “The Financial
Statistics of Social Security in Japan” was designated as under the scope of Fundamental Statistics by the Statistical Act.
     According to the time-series trend of social benefit by three categories, the benefits for pensions and medical care
have been increasing year by year as a result of the ongoing phenomenon of population aging and the advancement of
medical technology.

● Social benefit by category
(Trillion Yen) 60
                                                                                                 Pensions
              55                                                                               54.9 trillion yen
                                                                                                   (45.6%)
              50                                                                                                                    Medical care
                                                                                                                                   36.5 trillion yen
              45
                                                                                                                                       (32.8%)
              40

              35

              30

              25

              20

              15                                                                                                                  Welfare & others
                                                                                                                                   26 trillion yen
              10                                                                                                                      (21.6%)

               5

               0
               1970        1975         1980         1985         1990         1995           2000          2005      2010                2017
                                                                                                                                      (Fiscal Year)

     The international comparison shows that most social expenditure goes to the elderly in Japan. According to the
comparative social expenditure per GDP by nine policy areas, social expenditure on the elderly – such as pension or
long-term care benefits – is the second highest, while social expenditure on family – such as family benefits – is the
second lowest among the six developed countries compared.
     Statistics have been broadly used as fundamental sources to monitor social security policies and their financing,
and also as a significant index to conduct international comparisons of social security expenditures.

● International Comparison of Social Expenditure relative to GDP in FY2015

(%) 35

    30

    25

    20                                                                                                                Other social policy areas
                                                                                                                      Housing
    15                                                                                                                Unemployment
                                                                                                                      Active labor market programmes
    10                                                                                                                Family
                                                                                                                      Health
     5                                                                                                                Incapacity-related benefits
                                                                                                                      Survivors

     0                                                                                                                Old age
            Japan          Japan          UK             USA          Sweden        Germany          France
           (FY2017)

Made by National Institute of Population and Social Security Research based on the materials below
Sources: S
          ocial Expenditure for OECD countries except Japan is based on the OECD Social Expenditure database. (Downloaded on 24th May 2019)
         GDP data on Japan are based on the Cabinet Office’s “Annual Report on National Accounts for FY 2017,” while the data on other countries are
         calculated by IPSS using the data from the OECD Annual National Accounts Database. (Downloaded on 24th May 2019)

                                                                                                                                                       6
Annual Population and Social Security Surveys (general statistics)
● Annual Population and Social Security Surveys (general statistics)
The National Institute of Population and Social Security Research conducts nationwide surveys (referred to as
Annual Population and Social Security Surveys) on five different themes. The results of each survey are used as basic
data for policy making by national and local governments, and are also widely used in various fields.
National Survey National Survey
National Fertility National Survey National Survey
on Social Security on Household
Survey in 2015 on Migration on Family in 2018
and People’s Changes
in 2016
Life in 2017 in 2019
The National Fertility Survey
The National Fertility Survey is a nationwide survey conducted every 5 years by the National Institute of Population and
Social Security Research in order to investigate
平成 27 年度
the current state of and issues related to marriage, childbirth, and child-
rearing平成in Japan.
26 年度
It consists of a survey targeting married couples 平成
出生動向基本調査 and23another
年度
one targeting unmarried individuals.
Accompanied
世帯動態調査 by the continuing trend of low fertility rate in Japan, population
人口移動調査 decline, population
1940 年に第 1aging and changes in
回調査が行われ、
the way in which people live all influence the future of Japanese society. One of the important purposes of this survey is
ほぼ 5 年周期で実施しています。
to understand the state平成 of 25
low年度fertility rate and to explore
平成 24its年度
causes. The survey asks unmarried individuals about their
willingness to marry全国家庭動向調査
and their lifestyles, and married couples about their willingness to have children and their fertility
生活と支え合いに関する調査
behavior, as well as their work and child-rearing environments. By doing so, the survey depicts changes overtime and
identifies new issues through comparison with previous surveys and across different sociodemographic characteristics.
The results of this survey are used as reference material to determine the future fertility rate in population
1940 年に第
projections. In addition平成 to24being
年度
used to evaluate
平成
policy targets, such as the Outline
25 年度 平成
of 年度
27 Measures 1for Society with
回調査が行
平成 23 年度 平成 26 年度
Declining Birthrate and the Regional Empowerment
生活と支え合いに 全国家庭 for Japan’s Growth Comprehensive出生動向
Strategy, it is also
われ、ほぼused5 to show
人口移動調査 世帯動態調査
the state of and issues related
関する調査 to the declining birthrate, for many official reports, such
動向調査 as the Annual年周期で実施
基本調査 Health, Labour
しています。
and Welfare Report, the Declining Birthrate White Paper, the White Paper on Gender Equality, and materials of various
policy committees.
Changes in employment status of wives Changes in married couples’ ideal and intended
before and after giving birth, number of children and unmarried men and
by birth year of the first child women’s desired number of children, by survey years
Looking at the employment status of wives before and With regard to the ideal and intended number of children
after giving birth to their first child, it can be seen that the for married couples and the desired number of children
percentage of wives who were employed both before and for unmarried men and women, data shows that overall,
after birth was 38.3% in 2010-2014, which was a large the average number for each has been declining since the
increase compared to previous years. It is worth noting 1980s.
that there was a significant growth in the percentage of
wives who used parental leave after giving birth to their
first child. Among wives who were employed before giving
birth, 53.1% continued their employment.
●Changes in employment status of wives before and after ●Changes in the ideal, intended and desired number of
giving birth, by birth year of the first child children (average), by survey
100
Ideal, intended and desired number of children (average)
3.1% 3.4% 3.8% 3.8% 4.1% 4.2%
% 2.8
2.67
2.62 2.64
24.0% 23.6%
80 35.5% 34.6% 32.8% 28.4% 2.6 2.56
2.53
2.48
2.42
2.4 2.34
60 2.30
33.9% B 2.23
2.29 2.32
42.9% 46.9%
40.3% 2.2 2.16
2.23 2.13 2.12
37.3% 37.7% 39.3% Employed 2.20 2.11
40 before 2.23 2.18
2.17 2.15 2.02
10.0% giving birth
2.0 2.13 2.10
2.05 2.07 2.01
2.07
9.7% 2.03 2.04
20 12.2%
13.0% A C 1.91
18.4% 16.3% 38.3% 53.1% 1.8
28.3%
19.4%
15.3%
8.1% 11.2%
5.7%
0
1985 1990 1995 2000 2005 2010 0.0
-1989 -1994 -1999 -2004 -2009 -2014 8th 9th 10th 11th 12th 13th 14th 15th
Birth year of the first child (1982) (1987) (1992) (1997) (2002) (2005) (2010) (2015)
Unknown A: Continued to work
Ideal number of children (married couple)
Not employed prior to pregnancy
(Among those employed before giving birth) Intended number of children (married couple)
Stopped working upon giving birth
B: Stopped working upon giving birth Desired number of children (unmarried women)
Continued to work (no parental leave) C: Continued to work
Continued to work (used parental leave) Desired number of children (unmarried men)
Notes: Married couples include wives age are under 50, and unmarried
men and women are between 18 and 34 years of age
7
The National Survey on Migration
The National Survey on Migration is conducted ●Percentage of those who moved from and then returned to
to obtain fundamental data on the trends and the prefecture of birthplace
prospects of the geographic mobility of the people
liv ing in Japan. The sur vey prov ides detailed
data on individual migration experiences that are
not obtained from other governmental statistics 15.2
such as the Population Census and registration-
based migration statistics. The survey consists of
retrospective questions on place of residence at
major life events (e.g., birth, completion of school, 24.0
first job, marriage, and so on) as well as that of 1
25.9
and 5 years earlier, the prefectures in which the 22.6
respondents have lived (including outside Japan), 29.3
22.6 19.2
and prospects of residence 5 years ahead. The
results are used in formulating regional population 21.4
20.6
projections in Japan and informing various policies. 22.1
25.9
23.8
21.5
17.6
21.1
18.4
The results of the 8th National Sur vey on 25.2
21.7
19.8 22.8 19.7 17.4
17.1
Migration, conducted in July 2016, show that due to 28.5 20.7 18.3
19.2 20.0
15.4 23.4
22.8 16.6
the population ageing, both past mobility and future 22.9 23.5 16.521.9 26–
prospect of migration are declining slowly. The 21.7
20.2 25.8 27.5
23.8 25.1
24–26
25.9
most frequent reasons for migration are housing 23.8 22–24
30.0 20–22
related reasons, work related reasons and change 28.8
Less than 20 (%)
in marital status. Those who currently live in the 0 500km
No survey
same prefecture as that of their birthplace account
for 68.6 per cent of the total respondents, with the
percentage being relatively lower in the Tokyo area.
The National Survey on Social Security and People’s Life
Japanese society is undergoing population ageing and changes in household structures at an unprecedented speed.
In order to maintain the long-term sustainability of our social security system, it is necessary to implement a series
of reforms while also keeping in mind a delicate balance of self-help, mutual-help (by family members) and public
help. The National Survey on Social Security and People’s Life is conducted to understand the challenges people face
regarding their living conditions, and how they cope with them by supporting each other – through family members
and within communities.
●Percentage of those who answered “No” as to whether ●Frequency of conversation: by household (hh) type
there was someone they could rely on for financial (persons aged 65 and above)
assistance in an emergency or to consult with on Among elderly persons aged 65 and above, most have conversations
important matters (persons aged 18 and above) with someone at least every day. However, among elderly men who live
Percentage of those who answered “No” as to whether there was someone in single-person households, 16.7% have conversation less than once in
they could rely on for financial assistance in an emergency is high in two weeks.
single-parent households and low-income households with children.
Also, the percentage of those who answered “No” as to whether there was
someone they could consult with on important matters is high in single-
parent households. These results are used as indicators in the Outline of
Measures against Child Poverty. (Here, low-income household refers to
those with the 1st to 3rd deciles of equivalent disposable income.)
30 100
90 Men (single-person hh)
as to whether there was someone they could rely on
Single-parent households
25.9%
25 1st to 3rd deciles of equivalent Men (couple-only hh)
80
Percentage of those who answered “No”
disposable income
Women (single-person hh)
All samples 70
20.4%
Percentage of individuals
20 Women (couple-only hh)
60
16.2%
15 50
40
8.9%
10
30
7.2% 7.2%
20
5
10
0 0
Financial assistance Consultation on Every day Once every Once every Less than once
in an emergency important matters 2-3 days 4-7 days in 2 weeks
8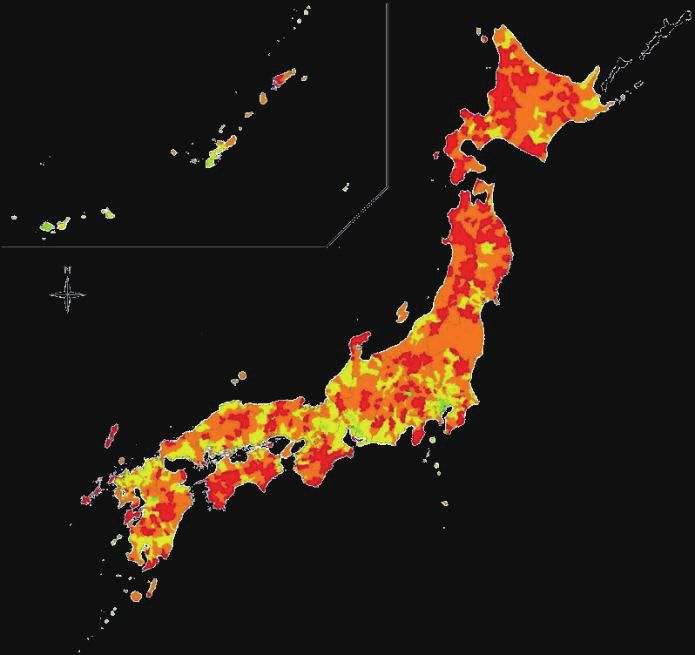
The National Survey on Family in Japan
    Accompanied by low fertility rates and population aging, the family in Japan is undergoing major changes in its structure
    and functions, including the increase in dual income families and single-person households. The National Survey on Family
    in Japan examines the current status and changes in functions of the family, such as childbearing, child-rearing, financial
    support and caring of elderly parents, as well as the factors behind these changes. As a comprehensive survey of families
    and households, this survey offers valuable data, which are used as basic references for drawing up various policies.

    ●Changes in the percentage of those who agree and disagree with ideas on gender roles, by survey round
    The attitude toward gender roles has changed over the last decade, and it has become clear that there is support for equally sharing housework and child-
    rearing in particular.                                                                                                                            (%)
                                                                  100                              50                             0                                         50                     100

                                            4th survey (2008)                                     6.7                  41.0                      38.7                   13.6
    After marriage, the husband should work
                                            5th survey (2013)                                      5.4                 39.5                      39.2                    15.9
    outside the home while the wife should                                                               4.1             34.0                    40.1                      21.8
                                            6th survey (2018)
    concentrate on housework
    Mothers with children under three-years   4th survey (2008)                      43.9                          42.8               10.3       3.0
    old should devote themselves to           5th survey (2013)                       28.6                       48.7                   16.8             5.9
    child-rearing and not hold a job          6th survey (2018)                         23.4                     47.8                    19.9                  8.9

                                              4th survey (2008)                   24.9                         57.6                    16.1        1.5
    Husbands should share housework and       5th survey (2013)                    23.3                        57.2                     17.6        1.9
    child-rearing equally
                                              6th survey (2018)                   28.6                          55.1                   14.7        1.6

                                              4th survey (2008)                      25.4                       52.4                    17.7              4.5
    The father should make the final
    decision on important family matters      5th survey (2013)                        19.4                     52.2                     21.8               6.6
                                              6th survey (2018)                           14.5                   49.9                     25.2                       10.3

    When work and family matters              4th survey (2008)                           14.3                  53.5                       28.4                  3.7
    coincide, husbands should give            5th survey (2013)                           13.1                  53.9                       29.6                   3.5
    priority to their work                    6th survey (2018)                             10.7                 51.4                       32.9                     4.9

                                              4th survey (2008)                           26.4                   48.9                   19.2              5.5
    Boys should be raised to be manly and     5th survey (2013)                            15.7                 51.5                      25.2                   7.6
    girls, feminine
                                              6th survey (2018)                                   10.3            46.1                      30.9                 12.7

                                                                                 Completely agree              Somewhat agree                  Somewhat disagree                  Completely disagree

    The National Survey on Household Changes
    The structure of households in Japan is undergoing significant changes. These changes include not only the expected
    decline in the number of total households, but also the increase in one-person households, couple-only households,
    and single parent households. The National Survey on Household Changes attempts to capture the detailed process of
    formation, expansion, compression and dissolution of households. Such data on household dynamics are difficult to find
    in other surveys, and the results are utilized to project the number of households in the future and for policy purposes.
    ●Percentage of empty nest * households by age of the head of the household
                             ( )

     (%)
      35                                                                                                                   The figure on the left shows the percentage of empty nest(*)
                                                                             5th survey (2004)                             households that formed in the past five years by age of the
                                                       29.2                                                                head. The 7th survey showed a decrease in the groups of
      30                                                                     6th survey (2009)
                                                                                                                           those in their 50s compared with previous surveys, while
                                              26.6                           7th survey (2014)
                                                                                                                           there was a marked increase of a similar type in groups aged
      25                                                                                                                   60 to 74, which shows a consequence of the delay of children
                                                                                                                           leaving parental home.
                                                                  21.0
               19.4
      20
                                                                                          16.7
                                    15.5
                                                                            15.0
      15

                         9.5
      10                                                                                                 8.7

      5

      0
           Total (50+) 50–54    55–59       60–64    65–69    70–74      75–79      80–84            85+

    (*) Empty nest refers to a household which consisted only of parents after their child(ren) left home to work or to get married, etc.

9
Major Research Projects
1. R
esearch for a society in which everyone is able to participate
A Comprehensive Study on the Realization Strategy of Japan’s Plan for Dynamic Engagement of All Citizens
(from FY2017) [In-house project]
A key concept toward realizing the Plan for Dynamic Engagement of All Citizens is to create a “virtuous cycle of
sustainable growth and distribution driven by inclusion and diversity.” Thus, it is important to enhance support for those
who have difficulties in social participation, which includes those who are raising children or are caring for the elderly.
This research project studies the circumstances in which support is needed for persons who do not have the means
to support themselves, including cases where there are barriers to social participation and also those facing financial
hardship, those with a heavy burden of daily household chores, and those with inconsistent home care. The project
researches ideal ways of implementing various measures from an empirical perspective on 1) the inclusion of young
people, 2) support for children and child-rearing, and 3) the inclusion of persons with disabilities, by examining the
current state of lifestyle support needs and their factors.
Empirical Research on Inclusion of Younger Generations
A comparative analysis on the support needs of the “employment Ice Age” generation has been implemented, based on
group interviews targeting those aged from 36–45 years old, 20–35 years old, and 46–60 years old, respectively as of
2017. The research also identifies the actual situation of consultation from counselors of the same generation from the
consultation desk for services and support for needy persons and studies the issue of support to stabilize their lives. The
table below illustrates the difference in the important livelihood support needs by regions in which people of the “Ice
Age” generation are living.
● Priorities of livelihood support needs in the non-regular employment “employment Ice Age” generation (unmarried) group
Outside the 23 wards of
Region 23 wards of Tokyo Kyoto Sendai
Tokyo
1 Livelihood Income stability Preparation of laws for companies
“Society in which it is easier to work”
Rank of importance of support
and “work style” Requests regarding working environment
2 Health Wages
and work style
Requests for temporary staffing/
3 Healthcare Health first New work style
non-regular employment
4 Work Workplace environment Worker training Child-rearing support
“Workplace where it is easy to take maternity
5 Education A helping society leave and childcare leave system” Support for birth and child-rearing
and “nursery school”
Source: National Institute of Population and Social Security Research, “Comprehensive Research aimed at Realizing the ‘Plan for Dynamic Engagement of
All Citizens: Report on Group Interviews Relating to the Support Needs of the Employment Ice Age Generation,” 2019, p. 59.
Empirical Research on Support for Children and Child-rearing
This research quantitatively and qualitatively analyzes the records of abuse consultations, which detail the circumstances
of children, guardians, households, etc. before and after the occurrence of abuse, and examines the circumstances
leading to difficulties in rearing children and issues of the provision of support. The table below shows the variation in
the items of the consultation records of the surveyed child counseling centers A-F, H, I.
● Comparison of basic information in child abuse consultation records across the surveyed child counseling centers
( ○ indicates that there is a description in the document)
A B C D E F H I
Name of child 〇 〇 〇 〇 ○ ○ ○ ○
Gender of child 〇 〇 〇 ○ ○ ○ ○
Date of birth / age of child 〇 〇 〇 〇 ○ ○ ○ ○
Registered domicile of child 〇 ○ ○ ○
Head of registered domicile of child 〇
Current address of child ○ ○ ○ ○ ○ ○
Telephone No. of child ○ ○ ○
Child’s possession of Special Education Record Book or
○ ○ ○ ○ ○
Handbook for the Physically Disabled and severity level
History of child ○
Family composition (name, date of birth, age, education,
○ ○ ○ ○ ○ ○ ○
employment, cohabitating or separated, etc.)
Source: Hisao Endo, Masato Noda, Kota Toma, supervisor, National Institute of Population and Social Security Research, ed., “Roles and Issues of Child
Guidance Centers in Japan: Analysis of Support, Cooperation and Collaboration Based on Abuse Couseling Record Documents,” University of
Tokyo Press, 2020, p. 188.
102. Demographic and interdisciplinary analysis of Japan’s longevity
Modeling and Comprehensive Analysis of Population, Economy and Society of Ultra-Longevity (FY2020–2022) [In-house project]
The life expectancy in Japan has grown significantly in the latter half of the 20th century, and Japan now boasts one of the
longest lifespans in the world. According to the “Population Projections for Japan: 2016-2065 ,” the life expectancy is projected
to increase.
The National Institute of Population and Social Security Research has conducted demographic and interdisciplinary
analysis of Japan’s longevity. With the increase of the life expectancy, the Institute conducts research relating to the
comprehensive data analysis and modeling of demographics, the economy, and the ultra-longevity society, such as promoting
research on the relationship between the development of extended longevity in Japan, one of the world’s countries with the
longest-lived citizens, and healthy life period, such as the extended healthy life expectancy. Through this research, the Insitute
seeks remedies for the coming hyper-aged society, and disseminates our research within Japan and abroad.
●Japanese Mortality Database
All Japan: Life Table Data Series The Institute has developed for the first time
Available Dates Age interval x Year interval in Japan the Japanese Mortality Database,
1x1 1x5 1x10 5x1 5x5 5x10 a comprehensive reorganization of Japan’s
Period Data
mortality table, which is consistent with the
Births 1947-2016 1 year
inter nationa lly renow n Human Mor ta lit y
Database. The database has been published on
our Japanese and English websites.
Deaths 1947-2016 1x1 1x5 1x10 5x1 5x5 5x10
Deaths by Lexis triangles 1947-2016 1x1
Population Size 1947-2016 1 year 5 year
(Inferential statistics: Jan. 1)
Exposure-to-risk 1947-2016 1x1 1x5 1x10 5x1 5x5 5x10
Death rates 1947-2016 1x1 1x5 1x10 5x1 5x5 5x10
Life tables
Females 1947-2016 1x1 1x5 1x10 5x1 5x5 5x10
Males 1947-2016 1x1 1x5 1x10 5x1 5x5 5x10
Total (both sexes) 1947-2016 1x1 1x5 1x10 5x1 5x5 5x10
Life expectancy at birth 1947-2016 1 year 5 year 10 year
●Organizing long-term series statistics on causes of death (E.g.: heart disease)
120000 In general, when the ICD* is revised it becomes a
completely separate system and the figures have no
100000
Step 1: Elimination of the ICD-9 application continuity. For example, there is a discontinuity in
period series using an original method
ICD-9 original
(modification of discontinuity from 1993 the number of deaths due to heart disease from 1993
to 1994)
to 1995 when looking at the number of deaths due to
80000
Step 2: Re-classification of ICD-9 Codes into heart disease in Japan. This seems to be due to the in-
ICD-10 using HCD method (modification
of discontinuity from 1994 to 1995)
fluence of the WHO’s recommendation to “not record
60000 only heart failure and other ailments ‘heart failure’
as the condition just before death” and due to the re-
vision of the ICD (introduction of ICD-10). Therefore,
40000
Effects of attention an attempt to rearrange the statistics based on the old
ICD-10
on heart failure classification into a classification based on ICD-10 has
20000 been made by the Human Cause-of-Death Database
ICD-9 modified (HCD). This project has cooperated with HCD.
0 * ICD is the International Statistical Classification of Diseases and
1980 1985 1990 1995 2000 2005 2010 Related Health Problems, provided by the WHO. Statistics on the
causes of death in Japan and other countries around the world are
basically divided according to this classification.
●Population by subjective health obtained from life table analysis
2013 (Female) In examining the subjective health of women by age,
100000 the most common health status is “not bad,” but not
90000 “relatively poor.” This is thought to be because when
80000
health levels deteriorate, women may be admitted to a
Relatively
poor facility or hospital or die. Comparing 2001 and 2013,
70000 “relatively good” decreased for both men and women
Not bad
60000 in their 50s and early 60s, while “relatively poor” for
Relatively good
50000 both men and women increased in their early 80s.
In a facility or
hospital From these results, it can be inferred that up to the
40000
age of 60, the proportion of people with good health
30000 decreases, which means the health level deteriotates
20000 ne gat ively, wh i le for p e ople i n t hei r 80 s, t he
10000 proportion of those in poor health increases, which
means the health level deteriorates more severely .
0
40 45 50 55 60 65 70 75 80 85 90 95 100
Years of Age
113. Amid the massive immigration inflow, shedding light on the dynamics of
emigration pressure from Asian countries
Survey on Emigration Pressure of Asian Countries (FY2019–2020) [In-house project]
Against the backdrop of strong demographic pressure and the immaturity of their domestic labor markets, Asian
countries are among the most active regions in the world for sending labor beyond their borders, and Japan serves as an
attractive candidate as a destination. In recent years in particular, there is growing interest in labor from Asian countries
as Japan has been accepting migrant labor from abroad due to its own labor shortage caused by low fertility.
However, even in international immigration research, there is still much that is unknown as there is still little
collective knowledge about such labor migration from Asian countries.
Given this situation, this project aims to clarify the following points on the movement of labor from Asian countries
to other countries.
First, it summarizes the policies of Asian countries with regard to sending labor beyond their borders.
Second, it identifies the market structure of private brokerage companies (agencies, agents, sub-agents, brokers) in
each country.
In order to understand these points, the project conducted a survey in 2019 of China, Vietnam, and Nepal based
on their circumstances of sending labor to Japan and the extent of their socio-economic development. As a result, it is
becoming evident what kinds of educational backgrounds in each country are driving international migration to Japan
and through what kinds of routes in each country, such as technical training and studying abroad, each international
migration is occurring.
In addition to these countries, a survey of Indonesia, the Philippines, and Myanmar is planned in 2020.
●Aim of surveys
(1) What kinds of people, (2) For what purpose, (3) What pathways do they take to migrate?
1. Population dynamics 2. State of migration 3. Structure of 4. Future
and macro-economic of international labor intermediary services developments
situation for laborers in international
and students labor migration
■ Population ■ Policies and ■ Structure and ■ Sending labor to
dynamics and future systems for sending pathways of Japan and
estimates labor forces intermediary possibility of
■ Economic situation ■ Characteristics of services and actors competition with
and economic migrants ■ Cost structure of other destination
disparity with Japan international migrant countries
■ Purpose of
■ International migration labor and students
industry and ■ Role and expecta-
domestic tions of government
employment
(1) What kinds of
State of pressure Will Japan
people and (2) (3) What pathways?
to send labor be chosen?
for what purpose?
The situations of: Are there differences in Are there differences in Future development of:
Population estimates destination and intermediary agencies Expectations of new
Stage of economic method (labor/study and pathways by? status of residence,
development abroad) depending on Students “Specified Skilled
Enrollment rate in the situations of: Labor (skilled) Worker”
higher education Home country Labor (technical Position of Japan
Unemployment rate Education level intern training) among numerous
Sex destinations
A will to migrate
Main perspective of analysis
124. Big data utilization in the health promotion measures of local governments
Project for the promotion of evidence-based policy-making in the health sector by local governments using
the claims data for health and long-term care insurance (FY2020) [In-house project]
In Japan, the Ministry of Health, Labor and Welfare and the All-Japan Federation of National Health Insurance
Organizations are preparing data on medical examinations, healthcare, and long-term care. While it is expected that
prefectures and municipalities will implement health projects using this data (Data Health), the acquisition of analysis
methods for medical expenses and the accumulation of know-how by local governments are issues for system operation.
This research project collaborates with the Iwate Prefecture (Iwate Prefecture Citizens’ Plan (2019–2028) “Health
Promotion Project”) to realize Data Health in all prefectures, including Iwate Prefecture. Specifically, it will use the
“Iwate Prefecture Medical Big Data” independently constructed by Iwate Prefecture, and the National Health Insurance
Database System (KDB), to collect evidence for the efficient use of healthcare and long-term care services and provide
different types of support for the implementation of health projects based on this evidence. The results of this research
will be disseminated to other prefectures with the aim of realizing nationwide Data Health.
●Outline of this research project
I. Construct database II. Analysis III. Support for local governments
• Support construction of Iwate • Identification of various health risks (lifestyle-related diseases, • Provision of evidence to the
Prefecture Medical Big Data dementia, falls/bone fractures, untaken health checkups, etc.) prefecture and the health and
IPSS • Link KDB data and Iwate • Identification of health projects that contribute to extending healthy long-term care insurers
Prefecture Medical Big Data life expectancy (improving the rate of health checkups, long-term • Support analysis for local
care prevention projects tailored to the region, etc.) government staff and support
drafting of plan
Construction of database Drafting of plan and health project
Iwate
Prefecture/ • Iwate Prefecture Citizens’ Plan (2019–2028) Health Promotion • Draft plan and health project based on evidence
health and Project • Realize an efficient health and long-term care system (cost
long-term • Construct Iwate Prefecture Medical Big Data (database of optimization, improvement of healthy life expectancy)
care insurers health/medical/long-term care)
Disseminate the knowledge gained from initiatives in Iwate Prefecture to other prefectures in collaboration with Regional Offices of
Health and Welfare
Other Research Projects
Projects by MHLW Grant
● Research on manpower estimation from the perspective of supply and demand to secure human resources for medical and welfare professionals
(FY2020)
● The methods and applications of population/household projections in the era of long-term depopulation and growing global migration (FY2020–
2022)
● Research on analysis and evaluation method development of multiple causes of death under the transformation of population health and disease
structure (FY2020–2022)
● Research on the situation and responses to low fertility and population ageing in China, Japan and Korea (FY2020–FY2022)
Projects by MEXT Grant
● Demography of Sexual Orientation and Gender Identity: Building a Foundation for Research in Japan (FY2016–FY2020)
● Panel Survey of Immigrants in Japan (PSIJ) (FY2017–FY2020)
● Sociological disability statistics for the measurement of social exclusion against disabled people (FY2018–FY2020)
● Research on social stratification, employment, and intergenerational reproduction of social inequality in single parent families (FY2018–FY2020)
● Consequences of “welfare-to-work” policies for time use of single mothers (FY2019–FY2021)
● Saving behavior of small households: An international comparative study (FY2019–FY2021)
● Projection of educational pairing-specific fertility: An application of two-sex fertility model (FY2019–FY2021)
● A Comparative Study on Support for Foster Parents between Japan and Italy: aiming to reveal the social background of “Deinstitutionalization”
(FY2019–FY2022)
● Applied microeconomic analysis of living standards of the elderly before and after retirement (FY2019–FY2022)
● Study on the background of the diversity of elderly care systems in East Asia (FY2020–FY2022)
● Analysis and theory construction for population decline using a generalized Leslie matrix model (FY2020–FY2023)
● Empirical research on the effect of satisfying social security and life supporting needs to the continuation of community dwelling (FY2020–FY2024)
Commissioned Research of Economic Research Institute for ASEAN and East Asia (ERIA)
● Health and Long-term Care information in Ageing Asia (FY2019–FY2020)
Note: T
he above research projects are conducted by researchers belonging to IPSS.
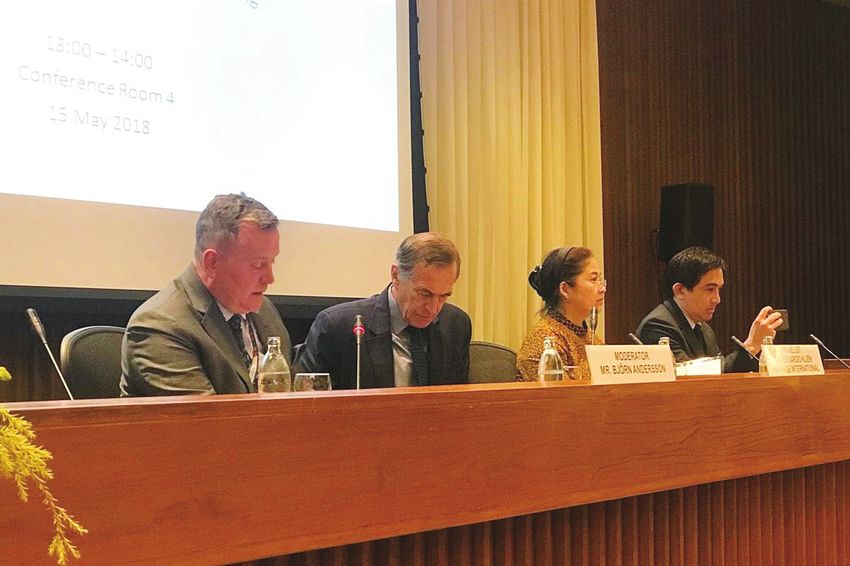
13International Cooperation
Organizing the Foreign Scholar Lecture
Series and International Workshops
The Foreign Scholar Lecture Series and International
Workshops are organized to inv ite internationally
renowned researchers in the fields of population and
social security. These seminars and workshops are held
in the IPSS conference room and are open to the public.
From FY2017 to FY2019, special lectures were held on
the European system of integrated social protection
statistics, population projections, family policies, and
poverty measurements. International workshops with
East Asian countries were also conducted.
Promoting International Research
Cooperation
We are engaged in cooperative research based on a
memorandum of understanding with the Korea Institute
for Health and Social Affairs (KIHASA), the French
Institute for Demographic Studies (INED), the Ministry
of Civil Affairs of the People’s Republic of China, and
the Research Institute of Labor and Social Protection,
Mongolia, while we promote information exchanges and
joint research with international organizations such
as the OECD, the World Bank, and the United Nations
Population Fund (UNPFA), along with universities and
research institutes in their respective countries. We also
participate in international scientific conferences on
population and social security, and issue reports.
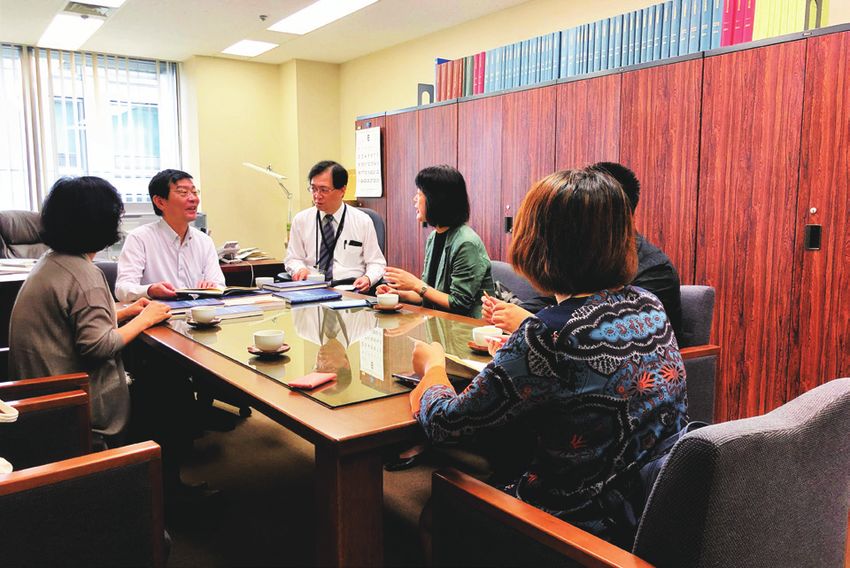
Receiving Visitors from Overseas
We receive delegations and study tour groups from
around the world and outline the current situation of
population and social security in Japan for them. During
FY2017-FY2019, we received visitors from the Project
on Strengthening the Capacity for Social Insurance
Operation in Mongolia and the Institute of Japanese
Studies, the Chinese Academy of Social Sciences, as well
as visits from countries such as South Korea, Taiwan,
Thailand, the USA, the UK, Germany, the Netherlands,
and others.
Collaborating through International
Organizations on Population and Social
Insurance Issues
We are engaged in ongoing cooperation about issues
on a global scale such as population problems and the
building of an international social security system
through the Commission on Population and Development
held at the UN headquarters, and participation in various
meetings held at the United Nations Economic and
Social Commission for Asia and the Pacific (ESCAP). We
are also offering expertise and data on population and
social security in Japan through participation in expert
meetings held by the OECD.
14Seminars
24th Annual Seminar (January 30, 2020)
Issues and Future Directions of Regional Policies in the Era of Depopulation
January 30, 2020
Hibiya Convention Hall
Shiro Koike (Senior Researcher, Department of Population Structure
Research, National Institute of Population and Social Security
Research)
入場
無料
Hiroshi Matsubara (Professor, University of Tokyo, Graduate School
of Arts and Sciences)
Chikako Igarashi (Director, Hokkaido Intellect Tank)
Yohei Maruyama (Associate professor, School of Design, Sapporo 第24回厚生政策セミナー / The 24 th IPSS Annual Seminar
City University)
Hirokazu Hasegawa (GIS Center, Policy Department, Niigata City)
Fumihiko Seta (Associate professor, Department of Urban ⼈⼝減少時代における
Engineering, Faculty of Engineering, University of Tokyo)
地域政策の諸課題と
Toru Suzuki (Deputy Director-General, National Institute of
今後の⽅向性 Issues and Future Directions of Regional Policies
Population and Social Security Research) in the Era of Depopulation
1 月30 日
2020年 13:00~16:30
定 員
日 時 200名
木(開場12:30) 事前申し込み
(先着順)
会 場 日比谷コンベンションホール
〒100-0012 東京都千代田区日比谷公園1番4号
講 師
(国立社会保障・人口問題研究所 人口構造研究部 部長) (一般社団法人北海道総合研究調査会 理事長) (新潟市都市政策部GISセンター)
小 池 司 朗 五十嵐 智嘉子 長谷川 普 一
(東京大学大学院総合文化研究科 教授) (札幌市立大学デザイン学部 准教授) (東京大学工学部都市工学科 准教授)
松 原 宏 丸 山 洋 平 瀬 田 史 彦
モデレーター
(国立社会保障・人口問題研究所 副所長)
鈴 木 透
JR 線 新橋駅 日比谷口より 徒歩約10分 丸の内線・日比谷線「霞ヶ関駅」B2出口より徒歩約3分
アクセス 東 京メトロ
千代田線「霞ヶ関駅」C4出口より徒歩約3分
都営地下鉄 三田線「内幸町駅」A7出口より徒歩約3分
主 催:
[お申込み・お問い合せ先]
国立社会保障・人口問題研究所総務課業務係 TEL:03-3595-2984 E-mail:ipss24seminar@ipss.go.jp
社人研 厚生政策セミナー http://www.ipss.go.jp/seminar/j/seminar24/index.html
23rd IPSS Annual Seminar 22nd IPSS Annual Seminar 21st IPSS Annual Seminar
(February 5, 2019) (February 1, 2018) (December 1, 2016)
“Regional Care Meeting” for the International Symposium on Visions for the Future Japanese Society
Future of Medical Care and Long-term Longevity - Through Comparison and Social Security System - Social
Care - Strengthen Facilitation Ability between France and Japan, the Two Security System for a Sustainable Society
to Connect System and Field Top Runners of Longevity in the Era of Population Decline -
主 催:
入場
無料
第23回厚生政策セミナー / The 23 rd IPSS Annual Seminar
医 療・介 護 の未 来を担う
地 域ケア会 議
~制度と現場を繋ぐファシリテーション能力の強化~
“Regional Care Meeting” for the Future of Medical Care and Long-term Care
~ Strengthen facilitation ability to connect system and field ~
2 月5日
2019年
13:00~16:20
講 師
(公立大学法人埼玉県立大学大学院保健医療福祉学研究科 兼 研究開発センター 教授)
日 時 川越 雅弘
火(開場12:30) (朝来市地域包括支援センター 主任介護支援専門員)
足立 里江
会 場 日比谷コンベンションホール (函館市保健福祉部地域包括ケア推進課 保健師)
古口 奈津子
〒100-0012 東京都千代田区日比谷公園1番4号 (豊明市健康福祉部健康長寿課 課長補佐)
松本 小牧
定 員
200名 事前申し込み(先着順) (国立社会保障・人口問題研究所 社会保障基礎理論研究部 部長)
山本 克也
JR 線 新橋駅 日比谷口より 徒歩約10分
アクセス モデレーター
丸の内線・日比谷線「霞ヶ関駅」B2出口より徒歩約3分
東 京メトロ (国立社会保障・人口問題研究所 政策研究調整官)
千代田線「霞ヶ関駅」C4出口より徒歩約3分
都営地下鉄 三田線「内幸町駅」A7出口より徒歩約3分 藤原 禎一
[お申込み・お問い合せ先]
国立社会保障・人口問題研究所総務課業務係 TEL:03-3595-2984 E-mail:ipss23seminar@ipss.go.jp
社人研 厚生政策セミナー http://www.ipss.go.jp/seminar/j/seminar23/index.html
15Publication, Database
Periodicals
社会保障研究
■ Journal of Social Security Research ISSN 0387-3064 人口問題研究資料第342号 ISSN 1347-5428
社 会 保 障 研 究
2020年1月31日 Population Research Series, No.342
JOURNAL OF SOCIAL SECURITY RESEARCH
(SYAKAI HOSYO KENKYU)
January 31, 2020
(SHAKAI HOSHO KENKYU)
Vol.4 No.1 2019
Publishes papers on social security
Foreword
Divorce/Bereavement and Social Security …………………………… Yoshimi KIKUCHI 002
Special Issue: Divorce/Bereavement and Social Security
Divorce and Bereavement with Spouse and the Actual Conditions of Children’s Lives
…………………………………………………………………… LEE kyoung won 004
including social development, welfare
Vol.4 No.1, 2019
Living Conditions of Divorced or Widowed Elderly Women
離死別と社会保障
………………………………………………………………Chizuka HAMAMOTO 020
人口統計資料集
������������������� 菊池 馨実
On Determination of Property Transfer and Duty to Support while Divorced or Bereaved
……………………………………………………………… Miyoko MOTOZAWA 033
特集:離死別と社会保障
state themes and social security of other
An Adult Child's Obligation to Support Parents and Social Security:
Focusing on Public Assistance ……………………………………… Sayaka DAKE 048
Some Problems in Child Maintenance after Divorce
配偶者との離死別と子どもの生活状況 LATEST DEMOGRAPHIC STATISTICS
and the One-Parent Family Payment in Ireland ……………… Yukihiro MASUDA 062
Current Status and Issues of Child Support System in Japan �������������������� 李 璟媛
―In Comparison with Child Support System in New Zealand― 配偶者との離死別と高齢者の生活状況
2020
countries (published four times a year).
(通巻第十二号)
…………………………………………………………………… Aya UMEZAWA 079 �������������������� 濱本知寿香
Social Security and Law
Issues of Disability Pension System ……………………………………… Motoo FUKUDA 092 夫婦の離死別による財産移転と扶養義務
Disability Pension for People Working with Mild Intellectual Disability … Motoo FUKUDA 097 �������������������� 本澤巳代子
Articles 子の親に対する扶養義務と社会保障
Analyzing Long-Term Care Insurance Improvements to Interregional Economic Disparity ―生活保護を中心に―
……………………………………… Ryoji HASEGAWA and Masaya YASUOKA 104 �������������������� 嵩 さやか
■ Journal of Population Problems (JINKO
Report and Statistics
“Unterhaltsvorschuss” in Germany …………………………………… Toshihide IKOMA 119 アイルランドにおける離婚後の養育費と社会保障給付
A Study on the Creation of the Publicly Funded Healthcare System for Liver Cancer and ―法制度の特徴と制度改革の提言―
Decompensated Liver Cirrhosis …………………………………… Toshiki ONO 128 �������������������� 増田 幸弘
International Research Cooperation with The Center of Policy Research(CPR), Ministry of Civil 日本における養育費履行システムとその可能性
MONDAI KENKYU)
Affairs, China ………………………………………………… Katsuhisa KOJIMA 137
―ニュージーランドにおける養育費制度を参考に―
Housing Policy and Measures for Empty Houses in Germany
�������������������� 梅澤 彩
………………………………………………………………………Chikako MORI 139
“Marriage, Divorce and Remarriage in Japan: Trends, Causes and Social Implications”
国立社会保障・人口問題研究所
(2013 ~ 2017) …………………………………………………… Miho IWASAWA 142
Publishes articles on population, births, 第4巻
Research on Poverty in Japan ……………………………………… Kuriko WATANABE 146
Book Review
How to Live the "Third Age": Creating Advanced Aging Society together with Senior Citizens
………………………………………………………………………… Tami SAITO 148
第1号
The Challenges of Aging Age of Employment and Retirement ………………… Itaru SATO 152
2019 年
deaths, migrations and households, and
国立社会保障・人口問題研究所
Edited by National Institute of Population and Social Security Research
National Institute of Population and Social Security Research Tokyo, Japan
(KOKURITSU SHAKAI HOSHO・JINKO MONDAI KENKYUSHO)
related statistical materials (published four
times a year).
表紙(目次)Vol.4-No.1_2k.indd すべてのページ 2019/06/19 10:19:28
■ Population Statistics (JINKO TOKEI
SHIRYOSYU)
Reports a selection of fundamental
statistics for a contribution to research
on population related issues by showing
the current state and development trends
(published annually).
Reports, Research Series & Survey Series
The results of research projects are published
as a series and widely distributed.
■ Population Trends and the Future of the
Japanese Society (April 2017)
■ Livelihood Support in Local Communities
(February 2018)
■ Roles and Issues of Child Guidance Centers
in Japan (March 2020)
■ Detailed reports on the surveys and estimates are published and available to download on our website.
Library
There are many statistical publications, especially on demographics and
social policy, in the collection.
Opening hours: 10:00 to 12:00 13:00 to 17:00, Weekdays only
Reference service: TEL: +81(0)3-3595-2988
FAX: +81(0)3-3591-4818
Loans: The Institute’s publications only. Loaning is possible upon
verification of personal identification and registration.
Over 130,000 book and magazine titles are available for researchers as
well as for the general public and government administrators. Interested
parties can also access all information on our website through our library
search at the following link: www.ipss.go.jp/tosho/tosho-lx.html. Valuable
historical documents have also been compiled, and are available for public
use.
16You can also read