Does Social Interaction Spread Fear among Institutional Investors?
←
→
Page content transcription
If your browser does not render page correctly, please read the page content below
Does Social Interaction Spread Fear among Institutional Investors?
 Evidence from COVID-19

 Shiu-Yik Au, Ming Dong, and Xinyao Zhou*

 May 26, 2021

 Abstract
 We study how social connectedness affected mutual fund manager trading behavior in the
 first half of 2020. In the first quarter during which the COVID outbreak occurred, fund
 managers located in or socially connected to COVID hotspots sold more stock holdings
 compared to a control group of unconnected managers. The economic impact of social
 connectedness on stock holdings was comparable to that of COVID hotspots and was
 elevated among “epicenter” stocks most susceptible to the pandemic shock. In the second
 quarter, social interaction had an overall negative effect on fund performance, but this
 effect depended on manager skill; unskilled managers who were connected to the hotspots
 underperformed, while skillful managers suffered no deleterious effect. Our evidence
 suggests that social connections can intensify salience bias for all but the most skilled
 institutional investors, and policy makers should be wary of the destabilizing role of social
 networks during market downturns.
Keywords: social networks, Facebook social connectedness index, COVID-19, salience bias,
institutional investors

* Au: Asper School of Business, University of Manitoba, Winnipeg, R3T 5V4, Canada; e-mail:
yik.au@umanitoba.ca; phone: (204) 474-9783. Dong: Schulich School of Business, York
University, Toronto, M3J 1P3, Canada; e-mail: mdong@schulich.yorku.ca; phone: (416) 736-
2100 ext. 77945. Zhou: Schulich School of Business, York University, Toronto, M3J 1P3, Canada;
e-mail: josephzhou520@gmail.com. We thank Zhiguo He, Mathew Henriksson, David
Hirshleifer, Mark Kamstra, Raymond Kan, Stephan Nagel, Lin Peng, Kelly Shue, Johannes
Streobel, Andreanne Tremblay, Jules van Binsbergen, Liyan Yang, and participants of the
Financial Consequences of the COVID-19 Pandemic 2020 Conference, Eastern Finance
Association 2021 Meeting, and University of Manitoba seminar for helpful comments, Meng Jiang
for research assistance, Facebook for providing the SCI data, and the Social Science and
Humanities Research Council of Canada (SSHRC) for financial support. This paper is dedicated
to the hardworking essential workers who kept us fed, healthy, and safe during the COVID-19
pandemic.
Panic is highly contagious, especially in situations when nothing is known and
 everything is in flux.
 ― Stephen King, Wizard and Glass

1. Introduction

 Against the backdrop of the rapidly growing field of social economics and finance

(Hirshleifer 2020), recent work has documented the impact of investor social connectivity on

portfolio selections. Social networks transmit both value-relevant information and cognitive biases

between investors and firm managers, thereby affecting investor behavior and portfolio decisions.

There is evidence that institutional investors acquire an investment edge from interacting with

corporate executives or board members through alumni networks (Cohen et al. 2008; Hong and

Xu 2019). However, there is also evidence that fund managers who are socially connected to the

firms they invest in do not earn superior returns (Kuchler et al. 2020). Furthermore, social

interactions aggravate behavioral biases for retail investors with respect to lottery stocks (Bali et

al. 2019).

 In this paper, we take a new look at the impact of social connectedness on active all-equity

mutual fund manager behavior during the COVID-19 pandemic outbreak. We identify COVID-19

“hotspot” counties in the US, as well as counties that are highly socially connected to these

hotspots, during the first quarter of 2020, and we ask whether social connectedness is associated

with informed or panic-driven trading behaviors. Under what we call the smart connection

hypothesis, being socially connected to COVID-19 hotspots allows fund managers a pathway to

gain valuable insights about the pandemic and act accordingly, whereas under the salience

hypothesis, social connection to the highly salient outbreak causes these same managers to focus

on the negative outcomes of COVID-19 and in turn, make suboptimal trading decisions. We

 1
distinguish the two hypotheses by examining fund performance in the quarter subsequent to the

initial viral outbreak in the first quarter.

 Several features of the COVID-19 episode makes it a unique window for our study. First,

the pandemic outbreak caused unprecedented fear and movements in the financial markets, which

creates a rare opportunity to examine intensified investor biases such as salience bias associated

with social interactions. Second, this event was a sudden exogenous shock to the economy, and

the relationship between social connectiveness to COVID hotspots and stock selling during the

event should not be due to endogeneity. Third, granular data on COVID-19 cases and Facebook

social connectedness are available to identify hotspot counties and counties with high and low

connectedness to the hotpots. This provides a sizable variation of the connectedness score across

counties, so that there is a control in the experiment to address endogeneity. Finally, the dramatic

selloff and rebound of the stocks during our event period allows a quick resolution of the two

competing hypotheses.

 We identify counties with at least 2,000 cumulative cases as of March 30, 2020 as COVID-

19 hotspot counties at the end of the first quarter of 2020. A total of 7 counties are identified as

hotspots, covering the vicinities of New York City, Chicago, Los Angeles, and Seattle. We then

use Facebook social connectedness index (SCI) to further classify non-hotspot counties into the

high- and low-SCI groups based on their social connections to hotspot counties.

 Our empirical investigations consist of two parts. In the first part, we examine whether being

located in or socially connected to COVID hotspots leads to heavy stock selling by fund managers.

We find that during the COVID outbreak quarter of 2020Q1, both being in the hotspot itself and

being socially connected to these hotspots intensified institutional stock selling. Multivariate tests

indicate that fund managers in the hotspot counties sold 8.9% (t = -4.41) more stocks than

 2
managers in low-SCI counties. Importantly, social connections appear to be related to funds’

selling activities during the pandemic; funds that are highly socially connected to hotspots sold

12.0% (t = -4.26) more of their holdings than their low-SCI counterparts. Furthermore, the effect

of social connection on stock sales was elevated among what we call the “epicenter” stocks –

stocks in industries that were most susceptible to the pandemic shock.

 Owing to the highly exogenous nature of the pandemic outbreak, there is no reason to

attribute the effects of hotspots and social connectedness to firm or fund features. First, COVID-

19 was an unforecastable event prior to January 2020. Consequently, mutual funds are unlikely to

make their headquarter locations based on their susceptibility to COVID-19. Furthermore, the

experimental set up provides a natural control—low-SCI funds. Both the treatment (hotspot and

high-SCI) and control groups were exposed to COVID-19; the main difference between the two is

how socially connected these firms are to areas with high levels of COVID-19. Therefore, the

differences in selling in these two groups should be related to social connectedness. This reasoning

is borne out in the panel regression analysis; hotspot and high-SCI managers sold more shares even

after controlling for geographical proximity to hotspots, case numbers, fund flows, economic

exposure to COVID hotspots, other fund characteristics, a multitude of fixed effects, and a variety

of firm characteristics.

 The second part of our empirical tests aims to distinguish the smart connection hypothesis

from the salience hypothesis. Even though social connection leads to more stock selling, the

quarterly frequency of the fund holdings data does not pin down the exact timing of the selling.

Therefore, we examine mutual fund performance during the second quarter of 2020 to distinguish

whether social connections benefit or hurt investment performance. We do not begin the fund

return examination from the first quarter because the COVID outbreak started in the middle of the

 3
first quarter in the USA and our hotspot and social connectedness measures are based on

information at the end of the first quarter.

 We find that the effect of social connections to COVID hotspots on fund manager behavior

depended critically on manager skill. We measure manager skill using fund historical alpha (based

on the CAPM model or the Carhart (1997) factors) or the Berk and van Binsbergen (2015) value

added; managers are classified as high skilled if they are in the top 30% of the skill metric. We

find that in 2020Q2 when the market rebounded from the first quarter low, the low-skill managers

located in or socially connected to COVID hotspots had lower returns relative to the unconnected

managers. A possible explanation for this finding is that social connections magnified the salience

bias among unskillful managers and they thus timed their stock trading sub-optimally (e.g., sold

out rebounding stocks too soon or got back to the market too late in the second quarter). On the

other hand, high-skill managers experienced no net negative impact on their fund returns for being

in a hotspot or being socially connected to a hotspot. Therefore, the overall evidence is in support

of the salience hypotheses in that low skilled fund managers who were socially connected to the

hotspots underperformed relative to their unconnected peers.

 Our research contributes to the literature by exploring how geographical location and social

connections influence institutional investor trading. On one hand, early research shows that fund

managers prefer to make investments in local firms and firms that earn superior risk-adjusted

returns (Coval and Moskwitz 1999, 2001) and later research links this to informal networks

allowing the transfer of superior information (Cohen et al. 2008; Hong and Xu 2019; Bernile et al.

2015). In contrast, other recent research shows that these informal networks can increase the

salience of extreme outcomes among retail investors, which encourages them to make high

 4
variance and skewness bets (Han et al. 2019; Bali et al. 2019). Our research extends both streams

of the literature by focusing on the impact of social connections on fund manager behavior.

 Two other recent papers also use the Facebook social connectedness index (SCI) data to

study investor behavior. Bali et al. (2019) measure social connectedness of a stock’s investor base

and study the effect of social connectedness on lottery stocks. They find socially connected retail

investors drive up lottery stock prices, leading to low returns of these stocks. Further, Kuchler et

al. (2020) show that fund managers are more likely to invest in stocks that are more socially

connected to them. Methodologically, our study differs from these two papers in how we use

Facebook SCI data to study the impact of social connectedness on investment decisions. Bali et al.

(2019) measures the social connection between a firm’s headquarter county and all other counties.

Kuchler et al. (2020) measures the social connection between the location of the fund manager and

the location of the firm. In comparison, we measure social connectedness of fund managers to

COVID-19 hotspots in 2020Q1 and examine how this social connection impacts managers’

portfolio holdings. Since our SCI measure is premised on a well-defined theme (COVID), it clearly

reflects the economic channel of the SCI effect.

 In contrast to Kuchler et al. (2020) who find SCI-driven holdings do not differ from other

holdings in investment performance, and to Cohen et al. (2008) who find network connections

between fund managers and corporate board members help money managers gain an investment

edge, we find that the effect of social connections on institutional investor behavior depends on

investor skill: social connections to COVID hotspots exacerbated fears and suboptimal trading

behaviors that hurt the performance of unskillful managers, while skillful managers appeared to

have benefited from the informational advantage through connections with the hotspots during the

pandemic. If retail investors are viewed as possessing generally low skills relative to institutional

 5
managers, our finding is conceptually consistent with Bali et al. (2019) who find that socially

connected (retail) investors are more prone to salience bias and overbid lottery stocks. To our

knowledge, our paper is the first to suggest that social connection helps intensify behavioral

heuristics such as salience bias even for some institutional investors.

 Our paper is also related to Alok et al. (2020), who examine the impact of geographical

distance on the trading decision of professional money managers and find that fund managers

located close to disaster cities irrationally underweight disaster zone stocks. However, our paper

differs from Alok et al. (2020) in two ways. First, while Alok et al. conduct an event study of

various natural disasters across time, we focus on COVID-19, an episode which has an immense

impact on the economy in general, and an extraordinary influence on the role of SCI in investor

behavior in particular. Second and more importantly, in contrast to Alok et al. who focus on the

salience bias related to geographic location (proximity to disaster zone), we focus on social

connectedness of investors to COVID hotspots. Therefore, we uncover a clear pathway through

which the location of fund managers affects their trading decisions: it is the social connection to

the source of “fear” (COVID), rather than the geographical distance to hotspots per se, that matters

to investor perception of risk.1

2. Literature and Hypothesis Development

 Our first two hypotheses link the location of institutional investors to stock selling during

the pandemic outbreak period (2020Q1), without distinguishing the salience versus the smart

connection hypotheses. The first hypothesis predicts how portfolio managers react during local

1
 We find that in our sample, the SCI effect persists even if we control for geographic distance between the fund
manager and the hotspots, suggesting that geographical distance between two locations is a (negative) coarse measure
of social connectedness between the people in the two locations.

 6
exposure to COVID-19. Under the model of Bordalo et al. (2012), the salience of a payoff has a

large impact on the decision makers’ choice. Given that COVID-19 is more salient in cities with

significantly higher cases and deaths, the model would predict that portfolio managers in these

cities become much more risk averse than managers in non-hotspot cities. Other papers find

evidence that salience matters in decision-making (Eraker and Ready 2015; Guiso et al. 2018;

Dessaint and Matray 2017).

 In terms of rational explanations, previous research finds that funds are locally biased and

that these funds have superior information available to them (Coval and Moskowitz 1999, 2001).

Given that COVID-19 has a deleterious effect on the real economy, being local to COVID-19

hotspots will arm managers with valuable information about firms affected by the pandemic and

will trade accordingly during the pandemic outbreak.

H1: Portfolio managers in COVID-19 hotspot counties reduce stock holdings during the pandemic

outbreak quarter (2020Q1).

 The second hypothesis relates social connection to stock selling during the pandemic

outbreak. Though the literature around social connectedness is still emerging, there are strong

indications that social connections lead to similar trading behavior between locations. Several

theoretical models predict that information sharing between traders have a large impact on trading

which can cause momentum and other behavioral patterns (Duffie et al. 2009; Andrei and Cujean

2017). Recent empirical studies show that social connectedness matter for trading patterns such as

those related to lotter stocks (Bali et al. 2019; Bali et al. 2011; Kuchler et al. 2020; Hirshleifer et

al. 2020). Consequently, we expect both valuable information and irrational fear about COVID-

19 in the local hotspot to be transferred to other localities via social connections, leading to strong

stock selling from institutional investors in these localities.

 7
H2: Portfolio managers in counties socially connected to COVID-19 hotspots reduce stock

holdings during the pandemic outbreak quarter (2020Q1).

 Our third hypothesis distinguishes the salience and rational theories about the effects of

social connectedness. Under the salience hypothesis, social connections may result in behaviorally

poor choices. Portfolio managers may focus on the potential extreme negative outcomes when

presented with salient prospects of illness, death, or economic ruin from their social connections

(Bordalo et al. 2012). This is further supported by other research that shows that portfolio managers

overreact to natural and aviation disasters (Kaplanski and Levy 2010; Bernile et al. 2018; Alok et

al. 2020). Finally, social connections may grant familiarity with another city, but not actually

facilitate useful information transfer between two locales (Pool et al. 2012).

 On the other hand, there is some evidence that institutional owners will use the information

obtained from social connections to improve portfolio returns. For example, Coval and Moskowitz

(2001) find that local portfolio managers outperform on local investments. Fund managers that are

connected to a firm’s operations in other states overweight stocks and demonstrated positive

abnormal returns (Bernile et al. 2015).

 Under the salience hypothesis, institutional investors located in or socially connected to the

COVID hotspots oversell stocks out of fear during the pandemic outbreak, and trading under the

influence of fear tends to be suboptimal. Under the smart connection hypothesis, institutional

investors who are located in or socially connected to the hotspots make more informed trading

decisions and tend to outperform their peers shortly after the pandemic outbreak.

 These hypotheses should be mediated by manager skill. Previous research finds that less

experienced managers suffer from an increase in home bias, without any corresponding increase

 8
in return (Pool, Stoffman, and Yonker 2012). Furthermore, lower skilled fund managers are

associated with a higher degree of herding and lower returns (Jiang and Verardo 2018).

Consequently, we expect that the salience or smart connection hypotheses will depend on fund

manager skill. Less skilled managers will suffer more from salience bias, and thus make poor

trades, while in contrast, more skilled managers will suffer less from this bias. We therefore have

two opposite predictions:

H3a: According to the salience hypothesis, fund managers located in or socially connected to the

hotspots, especially those with low skills, underperform their peers in the quarter following the

pandemic outbreak (2020Q2).

H3b: According to the smart connection hypothesis, fund managers located in or socially

connected to the hotspots, especially those with high skills, outperform (or underperform less)

relative to their peers in the quarter following the pandemic outbreak (2020Q2).

3. Data

 Our data come from several sources. For COVID-19 cases and deaths, we use the New York

Times (NYT) county-level data.2 This data is collected by NYT’s journalists by combing through

news conferences, data releases, and speaking with public officials. We assumed that any US

county with no data had 0 cases and 0 deaths and that cases and deaths in New York City, which

was reported as a single entity, were evenly split across its five counties. We then used the city-to-

county finder in SAS to link county information to cities; this is required because mutual fund

headquarter data is by city while COVID data is by county.

2
 https://raw.githubusercontent.com/nytimes/covid-19-data/master/us-counties.csv (last accessed July 31, 2020)

 9
Our second dataset is the Facebook Social Connectedness Index (SCI). It provides a measure

of the amount of Facebook friendship connections between one US county and another (see

Appendix B for a full description of Facebook’s SCI methodology). The score is best framed as

the relative probability of a Facebook friendship given the two users counties. As above, we used

the city-to-county finder to link the county data to cities. The dataset we used in this paper is from

March 2020 and thus represents an accurate snapshot of connections for the pandemic and 2020Q1

institutional ownership reporting period.

 The third source for mutual fund and institutional ownership data is the Center for Research

in Security Prices Mutual Fund (CRSP MF) data. We screen funds by a process similar to Hong et

al. (2005). We remove funds a) outside of the US, b) with less than 10% stock holdings, c) index

funds,3 and d) funds that only report semi-annually. Furthermore, we only include funds that are

all-equity—mixed bond and stock funds are excluded—to ensure that the results are not due to

shifting between bonds and stocks. The database also provides addresses for the mutual fund

headquarters and we use this information to determine which county and city the fund resided.

Finally, we draw stock price data from CRSP.

 These datasets are then used to derive key variables used in our analysis. The first variable

is to define counties that were badly affected by COVID-19 as of March 30, 2020. This date was

chosen to prevent look ahead bias. COVID-19 data was typically announced at the end of the day;

consequently, March 31st data would not have been available to investors until after the close of

the trading day. We flag counties with at least 2,000 cumulative cases as Hotspot = 1 and other

counties as Hotspot = 0. Table 1 Panel A provides additional details about the hotspot counties.

3
 Drop funds with “index” in the name or funds that are not “active” in the “investment orientation” field.

 10
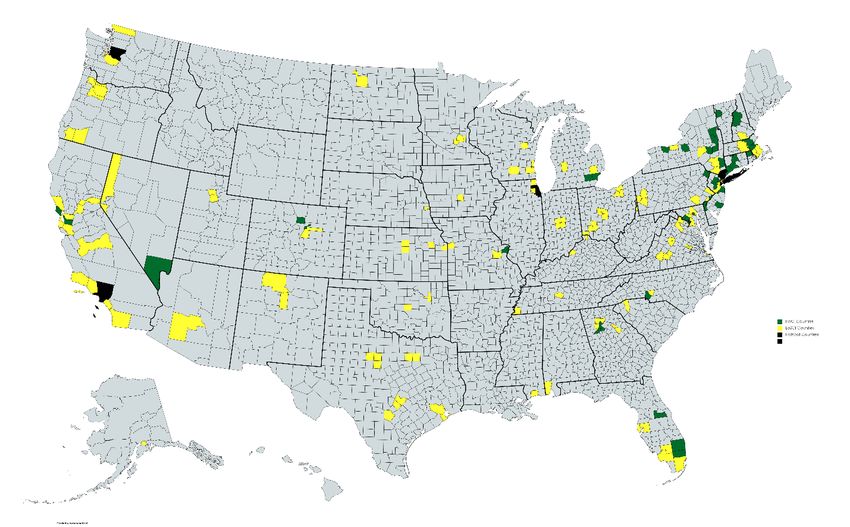
The second key variable is HiSCI, counties that are socially connected to counties facing

high levels of COVID-19. First, we calculate each county’s average SCI score to all of the Hotspot

counties. Second, we flag a county as HiSCI = 1 if the county is in the top quartile of average SCI

scores from the previous step and is not a hotspot county. It is otherwise set to 0 and vice versa for

LoSCI. See Appendix B for more details.

 Figure 1 displays the geographic distribution of Hotspot, HiSCI, and LoSCI counties. These

counties are broadly distributed across the US, suggesting that the HiSCI counties contains distinct

information content from geographical proximity to hotspot counties. For example, several areas

near San Francisco and Las Vegas are HiSCI countries largely because of their high social

connections to the hotspot city of Los Angeles, even though they are geographically farther away

from Los Angeles than some LoSCI countries. However, we control for geographic proximity

when testing for social connection effects in the regressions.

 We use three measures of fund manager skill. The Carhart-4 alpha and CAPM alpha are

more traditional metrics of average excess returns after controlling for the risks fund managers

took (e.g., Barber et al. 2016). The Carhart-4 alpha is calculated for each fund manager over a 5-

year rolling window, where we regress each fund manager’s returns over the window against the

Carhart (1997) 4 risk factors to find alpha (the excess return). We then rank all fund managers

based on their alpha from highest to lowest and identify the top tercile (30%) of fund managers as

having high skill; we use terciles to ensure we have adequate sample size of high-skilled managers

and to avoid results being driven by outliers. We use an indicator variable (Perf_Car4) to define

manager skill. Our results are robust to using the CAPM model (Perf_CAPM) instead of the

Carhart 4 factors to estimate alpha.

 11
The Berk and van Binsbergen (2015) metric is based on mutual fund value added, which

they show is better at predicting future fund performance than historical alpha. To calculate this

measure, we first take the return of each fund and add in management fees to construct month-t

gross return. Next we subtract the Vanguard index fund return for each month t.4 We then multiply

this excess return by the assets under management from month t-1 to determine the value added

that month. Third, we t-test each fund’s value added over the pre-sample period to determine how

much value firms add over the pre-sample period. The pre-sample period is the period between

2010 and the year preceding the date being tested; i.e., end date of 2018 for any 2019 mutual fund

regressions. We exclude any fund that has less than 24 months of data in the pre-sample period.5

Finally, we rank these firms from highest to lowest t-value and sort them into terciles based on

skill. Funds in the top tercile are defined as high skill.

4. Results
4.a. Summary Statistics and Univariate Tests

 Table 2 shows the summary statistics for fund holdings, SCI, and COVID data over the

sample period. Panel A and B provides basic summary statistics for the funds from 2016Q1 to

2020Q1 and 2020Q1, respectively. It is clear from the 2020Q1 holding data, overall there was a

large drop in the number of shares across funds. However, Panel C demonstrates that this drop in

the number of shares over 2020Q1 was highly concentrated in Hotspot and HiSCI counties.

 Figure 2 provides a visualization of how fund managers in Hotspots, HiSCI, and LoSCI

counties acted differently. In the blue columns, managers in Hotspot had a mean percentage decline

4
 As not all Vanguard index funds are available for the entire data period, we do a linear projection of the ith active
mutual fund value onto the set of Vanguard index funds.
5
 The funds in our sample area all actively managed all-equity funds, so this already matches Berk and van Binsbergen
(2015).

 12
in stock holdings of -8.45% and managers socially connected to Hotspot regions had a mean

decline of -12.19%. In comparison, socially unconnected managers experienced a 1.36% increase

in stock holdings during Q1 2020. Furthermore, the intensified selling concentrates in the epicenter

stocks, or stocks in industries with the lowest equal-weighted returns in 2020Q1 (see Table 1 Panel

B for details of the epicenter industries). The red columns show that funds in the hotspots, high-

SCI, and low-SCI counties sold 14.09%, 21.89%, and 3.00% of their epicenter stock holdings,

respectively. Panel C of Table 2 indicates that the levels of stock sales of the hotspot and high-SCI

funds are highly significantly different from that of the low-SCI counterparts.

4.b. Impact of COVID-19 Hotspots and Social Connectedness on Stock Holdings

 While the univariate results in Table 2 provide an excellent first test of the differences for

funds in Hotspot and HiSCI counties there needs to be additional controls for the observable and

unobservable differences in the funds. For example, Table 2 Panel C shows that funds in HiSCI

and LoSCI counties have differing levels of COVID-19 with 488 versus 228 cases (t = 3.23),

respectively. Further, HiSCI funds hold fewer unique stocks and invest more per stock.

Consequently, we will use a combination of firm, fund, quarter, and fund × industry fixed effects

to help control for these observable and unobservable variables. We also include controls for fund

characteristics, and COVID exposure such as geography, number of cases, or economic linkages

to COVID hotspots to control for any differential infection rates of COVID-19 during the 2020Q1

period.

 , , = + 1 + 2 × + 1 + 2 ×

 + 1 + 2 × + + + + , + , , , (1)

 13
where , , is the core dependent variable, percentage change in shares (Share Change %) for

firm , fund , and quarter . Hotspot, HiSCI, and GEO are indicator variables equal to one when

the mutual fund’s headquarter located in hotspot counties, non-hotspot counties that are highly

socially connected to hotspots, and non-hotspot counties that are geographically proximate to

hotspots, respectively. COVID is an indicator variable which equals one when it is 2020Q1. , ,

 , and , are controls for the firm, fund, quarter, and fund × industry fixed effects. We omit

other controls in the equation for brevity.

 We include a wide variety of fund characteristics as controls to ensure that the results are not

due to other causes such as investor flows, fund size, fund fees, or fund trading behavior. Flow

controls for investor flows over the quarter to ensure that the results are not driven by a large influx

(or outflow) of investor funds. LnAUM and LnAge controls for fund size and age while

Fund_Mgt_Fees and Fund_Expense control for any fund fees. Finally, Fund_Turnover controls

for funds likelihood to buy or sell shares while VRetq-1 controls for the previous quarter’s fund

performance.

 Furthermore, the regressions control for funds’ economic exposure to COVID to ensure that

the results account for funds’ COVID exposure in their portfolios. To control for proximity to a

COVID hotspot, we include GEO, an indicator variable set to 1 if it is within 100 miles of a hotspot.

This ensures the results are not driven by funds close to large outbreaks of COVID-19. Moreover,

the regression controls for pre-existing economic linkages to COVID hotspots proxied by

HotspotCorp. This variable is defined as the weight of a fund’s portfolio that is invested in firms

headquartered in a COVID hotspot in q-1.

 14
The first step in our analysis is to confirm that high levels of COVID-19 in a county leads to

a reduction in stock holdings by fund managers. According to hypothesis H1, close exposure to

COVID-19 has both a real negative economic effect on the local economy as well as greatly

increasing the salience of the destructive power of the disease. Consequently, fund managers in

counties with high levels of COVID-19 should reduce their holdings of risky assets, such as stocks.

 To test the impact of being in an area of high levels of COVID-19, we focus on the indicator

variable Hotspot and its interaction with COVID. In columns 1-4, the Hotspot variable by itself

does not show any significance outside of the COVID period (fund fixed effects absorb the Hotspot

effect in columns 5-6). In all columns, the coefficient on Hotspot × COVID exhibits a significant

hotspot effect on stock selling during the COVID outbreak. This supports our first hypothesis that

direct exposure to COVID-19 will reduce funds’ share ownership.

 The second step in our analysis is to test hypothesis H2: whether mutual fund managers with

a high social connectedness to a COVID-19 hotspot influences their stock holdings. Table 3 shows

that HiSCI is significantly negatively related to the percentage change in the number of shares held

(columns 1). Further, the negative significant relationship remains even after controlling for

geographic distance to hotspots (column 2), fund flows, and the percentage of funds’ portfolio in

headquartered in COVID hotspots, and other controls (columns 3 and 4). Finally, the social

connection to hotspots continues to be significant even if fund and fund × industry fixed effects

are used (columns 5 and 6).

 Based on the coefficients on Hotspot × COVID and HiSCI × COVID in the full model in

Table 3 using fund and fund × industry fixed effects (column 6), fund managers in a hotspot county

reduced stock holdings by -8.86% relative to the control group (low-SCI managers). Similarly,

managers with high social connection with the hotspots unloaded holdings by an additional -

 15
11.98% relative to their low-SCI counterparts. Therefore, the economic impact of social

connectedness is at least comparable to that of the hotspot itself.

 The effects of hotspot and social connectedness during the COVID-19 outbreak appear

stronger than those documented in other studies using more general samples, but this is likely due

to the size of the COVID-19 impact. For example, Alok et al. (2020) find that being close to a

disaster zone reduced fund managers’ disaster zone stock holdings by 1.5%; Kuchler et al. (2020)

document that a 10% increase in social connectedness between firm and investor locations is

associated with an increase in stock weight by 1.9% in the investor’s portfolio. However, the larger

effect is intuitive given the impact of the COVID-19 pandemic on the US economy. Furthermore,

the COVID-19 pandemic is a highly salient event and social interactions have especially strong

effects on investors when transmitting salient information (Han et al. 2019; Hirshleifer et al. 2020).

 One possible alternative explanation of our results is that funds with stronger social

connections with COVID hotspots are also more economically connected to the hotspots, causing

more intensive stock selling of HiSCI managers. We address this concern using two controls for

economic ties. First, we use a proxy, Hotspotcorp, defined as the weight of a fund’s portfolio that

is invested in firms headquartered in a COVID hotspot in q-1, to capture the economic link between

a fund and the hotspots. Table 3 shows some evidence that this variable is negatively related to our

measures of share change, consistent with the interpretation that economic links lead to stock

selling during the viral outbreak.

 Second, one way economic ties influence investor stock selling is fund redemptions: it is

possible that investors who had strong ties with COVID hotspots suffered heavy losses from assets

related to the hotspots, forcing them to redeem funds and leading to heavy stock selling of HiSCI

funds. We use fund flows (Flow) to measure redemptions, and find it has a strong positive relation

 16
with various measures of share change, suggesting that redemptions, as reflected by the negative

fund flows during 2020Q1 (Table 2, Panel B), indeed contributed to stock selling. However, the

HiSCI effect persists after controlling for economic links.

Types of Stocks Sold
 A further test of our results is to examine what types of stocks funds sell. Figure 2 provides

preliminary evidence that the social connection effect on stock selling is greater among stocks

most heavily hurt by the pandemic. We now provide multivariate evidence.

 In Table 4, we subdivide the stocks into “epicenter” (Epic) stocks, or stocks most hurt by the

pandemic in 2020Q1. We define Epic stocks to be those in the 10 (or 24) most underperforming

industries (measured by equal-weighted returns during 2020Q1) of the Fama-French 48. As can

be seen from the coefficient of HiSCI × COVID × Epic in columns 1-4, socially connected funds

sold more Epic stocks than non-Epic stocks. This confirms that fund managers reacted to the crisis

by selling the stocks that were most hard-hit in the early part of the pandemic. Interestingly,

judging by the coefficient of Hotspot × COVID × Epic, the effect of Hotspot on stock sales are not

intensified among epicenter stocks, lending further credence to the conclusion that the effect of

social interaction on investor behavior is distinct from that of geographical location.

4.c. A Question of Skill: Rational or Behavioral Fund Manager Reaction

 The third hypothesis is a dual sided one. On one hand, fund managers have historically

overweighted investments in local firms, but earned superior returns due to better information—

social connectedness may thus improve information available to fund managers. On the other hand,

social interactions could enhance the salience of the economic and health problems of COVID-19

relative to fund managers with low social connections with the hotspots.

 17
We modify the regression equation (1) from above by changing the dependent variable to

the future aggregate return for fund j at quarter q+1 (VRetj,q+1). We also change the fixed effects to

fund style × quarter fixed effects; fund styles are from the CRSP MF database which uses the

Lipper Fund Classification. The control variables are similar to equation (1) and adjust for fund

characteristics that may drive fund performance (such as fund flows, fund size, or fees) and the

fund exposure to COVID-19 (such as geographic proximity to hotspots, COVID cases in its

county, or percentage of portfolio economically linked to the hotspots):

 , +1 = + 1 + 2 × + 1 + 2 ×

 + 1 + 2 × + × + , (2)

where × indicates fund style × quarter fixed effects. If social connections are associated with

useful information, we should expect funds highly socially connected to hotspots (HiSCI) to

outperform during the post COVID outbreak period (HiSCI × COVID). If the social connections

transmit salient fears instead, we should expect the opposite— HiSCI × COVID should have a

negative coefficient.

 To examine this, in Table 5 we look at forward fund returns (VRetq+1), with 2020Q2 being

our focus period. Interestingly, in non-COVID periods, socially connected funds seem to

outperform their unconnected funds slightly for future returns. This suggests that these connections

provide useful information during normal periods. For example, HiSCI fund managers

outperformed an average of 14–22 basis points (bp) in non-COVID periods (columns 1-2).

Possibly, fund managers’ social connections to hotspots provide useful information between fund

managers in HiSCI areas in normal (non-COVID) circumstances. This provides some support for

the smart connection hypothesis.

 18
On the other hand, fund social connections seem to hurt in the future during periods of

extreme stress; HiSCI × COVID has a negative coefficient for columns 1 and 2. Based on the

column 2 results, a socially connected fund underperformed by 30.8 bp (t = -4.60) during the

pandemic relative to a non-connected fund, which swamps the benefits of HiSCI during non-

COVID periods (14.0 bp). The salience bias transferred to the fund managers causes them to

underperform in the quarters subsequent to the viral outbreak, possibly because the managers let

their fears delay them from putting money back to the market.

Conditioning on Manager Skill
 To test Hypothesis 3 more fully, we condition our tests on manager skill. We make use of

three different versions manage skill metrics, which we interact with key variables in equation (2).

In the first two versions, Perf_CAPM/Perf_Car4 is an indicator variable is set to 1 if a fund was

in the top tercile of alpha in the past 5 years after adjusting for the CAPM or Carhart (1997) 4

factors. In the third version, Perf_BB is an indicator variable set to 1 if a fund was in the top tercile

of performance according to Berk and van Binsbergen (2015). This approach will let us see how

the effect of social connection on fund performance depends on manager skill.

 The results in Table 6 demonstrate a strong dichotomy of the effects of social connections

on fund performance depending on manager skill. Judging from HiSCI × COVID in columns 2, 4,

and 6, low-skilled managers socially connected to hotspots experienced large losses of -66.5 bp, -

49.8 bp, and -54.2 bp (t-value -6.84, -5.76, and -6.11, respectively) based on CAPM alpha, Carhart-

4 alpha, or Berk and van Binsbergen (BB2015) metrics for skill. This shows that regardless of

whether we measure fund manager skill based on historical alpha from the CAPM or Carhart-4

models or from the BB2015 metric, unskilled managers suffered from salience bias from being in

or socially connected to the COVID disaster.

 19
On the other hand, for high-skill managers, being socially connected to COVID hotspots

helps performance in the next quarter. Based on the coefficient of HiSCI × COVID × {Perf} in

columns 2, 4, and 6, relative to the unskilled managers, we see that the skilled managers outperform

by 83.3 bp, 71.9 bp, and 69.0 bp (t-values 7.87, 5.63, and 5.25) in the quarter after the initial

COVID outbreak, respectively.6 Therefore, higher skilled managers were better able to survive the

COVID turmoil than lower skilled managers. The results are similar for high skilled fund managers

in the hotspots with the coefficients for Hotspot × COVID × {Perf} all being positive and

significant for columns 1 and 3-6.

 Moreover, there is evidence that the high skilled managers outperformed even relative to

unconnected managers during the COVID period. The sum of HiSCI × COVID + HiSCI × COVID

× {Perf}, which measures the net effect of HiSCI of high skilled managers on 2020Q2 performance

relative to unconnected managers, is 16.8 bp, 22.2 bp, and 14.8 bp (t-values 1.68, 2.25, and 1.31)

in columns 2, 4, and 6, respectively. Similarly, the sum of Hotspot × COVID + Hotspot × COVID

× {Perf} is also positive in most cases (-11.1 bp, 24.3 bp, 78.7 bp; t-values: -0.70, 1.54, 6.36),

suggesting that high skilled manager typically outperform the benchmark group (unconnected

managers) even when in the midst of the COVID disaster. Therefore, skilled managers were able

to adjust or ignore the salient negative information and position their portfolios to earn normal

returns. The results are similar for fund managers in hotspots (Hotspot × COVID). Thus, HiSCI

unskilled managers were negatively affected by the salience bias, but high skilled managers were

not.

6
 Note these percentage gains and losses seem large in isolation; however, there was a tremendous amount of market
movement in this period. The S&P 500 index fell 20.67% in 2020Q1 and rose 18.13% in 2020Q2.

 20
These results are not due to momentum. First, columns 3 and 4 calculate alpha using the Carhart-4 factors, which includes the momentum factor. These results show similar or stronger results than the CAPM results in columns 1 and 2 that do not account for the momentum risk factor. Second, mutual fund investors may chase returns and move into funds with high returns in the past. To control for this, we control explicitly for funds’ Flow and Vretq-1 in columns 2, 4, and 6. Regardless of whether we include these controls or not, the results remain similar (and even strengthen in some cases). Overall, these results are in line with hypotheses H3a and H3b. Low skilled managers appear to be badly affected by the salience of being in a COVID hotspot or being connected to one of those hotspots. These connected low skilled managers sell more stock and earn inferior returns relative to high skilled or unconnected managers. On the other hand, skilled managers do not suffer from this negative salience bias and earn returns similar to funds that are unconnected and not in hotspots. However, there is little evidence that skilled or unskilled managers benefit from the social connections. 4.d. Robustness HiSCI Funds Far from Hotspots Geographic proximity to COVID hotspots may contaminate the results as fund managers that work close to hotspots may be affected in a similar way as fund managers in hotspots. The earlier tables control for this using GEO, which controls for the distance from the fund and the nearest hotspot. However, to further ensure that the results are not driven by funds close to hotspots, we restrict HiSCI funds to only funds that are located at least 100 miles distant from a hotspot. We then rerun Tables 3 and 6 with this altered definition of HiSCI, with results reported in Tables IA.1 and IA.2, respectively. 21
Our results remain even though we require HiSCI funds to be geographically distant from

the hotspots. Tables IA.1 and IA.2 have similar results to their predecessors with funds in the

hotspots continuing to sell more shares and see lower returns concentrate among lower skilled

managers. Remarkably, the results still exhibit significant social connectedness effects, with HiSCI

managers located far from the hotspots also selling more shares and seeing lower returns

concentrate among lower skilled managers. Consequently, we conclude that geographic proximity

to hotspots is not driving the HiSCI effect.

Cross-Sectional Analysis
 We also conduct cross-sectional analysis on how the institutional investors’ changes in share

ownership differ across hotspot, high-SCI, and low-SCI counties in 2020Q1. We use the

parsimonious specification below:

 , , = + 1 + 1 + 1

 + + + + , + , , , (3)

 Table IA.3 shows that funds located in hotspot counties and high-SCI counties sell more

share holdings even when only look at the one quarter of sample.

Alternate Definitions of Hotspots
 To check whether our results are robust to the definition of COVID-19 hotspots, we use

2,500 cases and 1.5 cases per 100,000 population as the threshold for Hotspot county classification

instead of the 2,000 threshold. In Panel A and B of Table IA.4, we replicate the results on cross-

sectional and panel analysis except adjusting the definition of Hotspot using the alternative

definitions above. Regardless of the metric we used, the results for Hotspot and HiSCI remain with

both these variables being negatively related to fund stock holdings.

 22
Alternate Definitions of Selling
 The metric in Table 3, Share Change (%), does not account for any new positions the fund

takes as the % change will return an undefined value if we divide the change in shares by 0. To

avoid this problem, we develop an alternate metric, Share Change Per Shrout, which is the change

in number of shares scaled by the total number of shares outstanding of the firm. This avoids the

divide by 0 issue and allows us to include new positions.

 We replicate Table 3 using Share Change Per Shrout and present the results in Table IA.5.

The HiSCI × COVID coefficients remain significantly negative regardless of what kind of fixed

effects we use. Even though the Hotspot × COVID results lose significance, with an alternate

measure of share change, being socially connected or in a hotspot is associated with a reduction in

share ownership.

Length of Panic Period
 We have shown in Table 3 that being in or socially connected to COVID hotspots was

associated with intensified fund stock selling during 2020Q1. In Table IA.6, we examine whether

this association continued after the COVID outbreak quarter by using in indicator PostCOVID

which equals 1 if the time period is 2020Q2 and 0 otherwise. The results indicate much weakened

effects of Hotspot × PostCOVID and HiSCI × PostCOVID with signs flipping between the share

change measures used, suggesting most of the panic-driven stock selling occurred during the

outbreak quarter of 2020Q1.

Firm and Fund Characteristics
 One concern is that the selling during the pandemic may be driven by firm characteristics.

To control for this, Table 3 already includes firm fixed effects to account for time-invariant unique

firm characteristics. Furthermore, to ensure that firm characteristics are not driving our results, in

 23
Table IA.7 we include a host of firm controls comprising: firm size, analyst coverage, return

skewness (maximum daily return in the previous quarter), institutional/retail ownership, location

of the firm in a hotspot, idiosyncratic volatility, exposure to economic uncertainty (uncertainty

beta), and stock price. The results remain qualitatively similar even with these extra controls and

with the reduction of sample size.

 Furthermore, we also specifically investigate whether the selling results in Table 3 are driven

by specific firm and fund characteristics that have been identified in the social finance literature.7

For example, Hirshleifer et al. (2020) identifies size, investor attention, retail ownership, and

glamour as affecting the length of social networks’ impact on earnings announcement returns.

Retail ownership is also a proxy for the prevalence of noise traders (De Long et al. 1990).

Consequently, we investigate these factors by examining interactions with size, analyst coverage,

institutional ownership (the inverse of retail ownership), and book-to-market. Further, a firm

headquartered in a COVID hotspot may be more economically affected by the pandemic than firms

in other regions. We consequently investigate if our results relate to the firm’s location in a

hotspot.8

 Table IA.8 Panel A shows the results of the interaction tests with these characteristics. The

main effects, Hotspot × COVID and HiSCI × COVID remain significantly negative in all cases.

The Hotspot × COVID interaction is only significant for size and analyst coverage, showing that

being bigger or having more coverage mitigates some of the selling for Hotspot funds. However,

institutional ownership, book-to-market, and a firm located in hotspot, has no significant impact

7
 It is worth noting that fund return regressions cannot include firm-level characteristic controls as funds have diverse
portfolios covering hundreds of different firms.
8
 In other robustness tests, we also include an equity mispricing measure based on Rhodes-Kropf et al. (2005) in the
stock selling regression and find our results are robust to controlling for mispricing. But since inclusion of this
mispricing metric substantially reduces sample size, we do not report results with this variable.

 24
on selling when interacted with Hotspot during COVID (Hotspot × COVID × {Interaction}).

Furthermore, there is no significant impact for any of the variables when interacted with HiSCI

during COVID (HiSCI × COVID × {Interaction}). Thus, it is apparent that firm characteristics do

not play a significant role in our results—the results are driven by social connections and not other

firm characteristics.

 In addition to firm characteristics, we examine two fund-level characteristics that can

influence fund selling. HotspotCorp, the amount of the fund’s portfolio that is headquartered in

hotspots; this is directly related to the likelihood of selling as the fund may wish to divest from

firms that are economically exposed to COVID. Fund_Turnover, how much the fund buys/sells

over the past 12 months, also is directly related to the likelihood of selling funds; if a fund typically

sells more, it will likely sell more during the pandemic.

 The results are shown in Table IA.8 Panel B. As can be seen, Hotspot/HiSCI × COVID ×

HighTurn (a dummy for above median fund turnover) has no significance. Thus, fund turnover has

no impact on the selling during the COVID period for funds in hotspots or socially connected to

hotspots. Finally, Hotspot/HiSCI × COVID × HighHot has a significantly positive impact on

funds’ stock sales. This is directly counter to the hypothesis noted above; being economically

exposed to COVID during the pandemic outbreak should accelerate selling, not slow it.

Regardless, we conclude that the Hotspot × COVID and HiSCI × COVID effects are not being

driven by these fund characteristics.

Placebo Test
 One concern is that the share sales are simply an industry-wide phenomenon that all fund

managers are forced to be part of. To examine this possibility, we test a placebo group that should

not experience any significant selling: index funds. Index funds do not have active management

 25
and do not adjust their holdings according to market conditions. In contrast, the actively management funds in our sample are expected to change stock holdings, particularly during severe market conditions. Consequently, by examining the differences between index funds and active funds in our sample, we distinguish between an industry-wide sale or a reaction limited to only actively managed funds. Table IA.9 reports the results of this placebo test of index funds. The coefficients for Hotspot × COVID and HiSCI × COVID are insignificant in columns 1-2 regardless of the usage of fixed effects. There does not appear to be a general selling of stocks in index funds during the COVID period. We thus conclude that our results are not due to a general selloff, but due to choices by active managers who have reacted to the COVID crisis. 5. Conclusion There is a debate in the literature on whether informal social connections promote information sharing or intensify biased heuristics that causes poor trading decisions. Previous theoretical and empirical work has shown negative consequences of social interactions on investment decisions for retail investors and this paper extends the work into the realm of professional money managers. This paper shows that COVID-19 intensified mutual fund stock selling in counties with high levels of the disease during 2020Q1. Further, fund managers socially connected to these hotspots also sold more stock during this period. Finally, the results indicate that social connections made low skilled fund managers more vulnerable to salience bias during this episode; these fund managers acted on the information from social connections but used the information to make poor trades due to the salient fear of COVID-19. On the other hand, skillful managers appeared to have 26
been able to ignore the salience bias from being directly exposed to or socially connected to high

levels of COVID. Therefore, our evidence suggests that the impact of social media on investing

depends on fund manager skill.

 Even though our results are specific to this pandemic outbreak period, owing to the

unprecedented economic impact and the exogenous nature of the shock, the social connection

effects we document are highly economically significant and largely free of endogeneity. Our

findings that social networks transmitted both salience bias and valuable information among

institutional investors under stress, and that the effects depended on manager skill, suggest that the

impact of social connectivity on investor behavior warrants future research.

 Our work has important practical and policy implications. If social interactions intensify

behavioral biases among many professional money managers during times of crisis, social

connectivity can instigate market volatility and destabilize the financial markets. Therefore, it pays

central banks and policy makers to be wary of the downside of social connectedness and design

mechanisms to stem investor irrationality through social networks.

 27
Appendix A. Variable Definitions
 Variable Definition
 AUM Total equity assets under management of a mutual fund, calculated
 using the equity assets in the CRSP universe.
 COVID Indicator variable set to 1 if the time period is 2020Q1; 0 otherwise.
 Epic Indicator for stocks in the 10 or 24 industries with the lowest equal-
 weighted returns during 2020Q1.
 Flow Net flow into the fund scaled by previous quarter AUM .
 , − , −1 × (1 + , )
 , =
 , −1
 Fund_Expense Fund expense ratio. Ratio of total investment that shareholders pay
 for the fund’s operating expenses. Fund expense may include waivers
 and reimbursements, causing it to appear less than the fund
 management fee.
 Fund_Mgt_Fees The fee is calculated using ratios based on the line items reported in
 the Statement of Operations. The management fee can be offset by
 fee waivers and/or reimbursements which will make this value differ
 from the contractual fees found in the prospectus. Reimbursements
 can lead to negative management fees.
 Fund_Turnover Fund turnover ratio. Minimum of aggregated sales or aggregated
 purchases of securities, divided by the average 12-month Total Net
 Assets of the fund.
 GEO Indicator for non-hotspot counties that are geographically close to
 hotspots, defined as within 100 miles of any one of the hotspot
 counties.
 HotspotCorp Percentage of a fund’s AUM that is invested in firms whose
 headquarters are located in a Hotspot county.
 HiSCI Indicator variable for a non-hotspot county whose aggregate SCI to
 Hotspot counties is in the top quartile.
 LnAge The natural logarithms of 1 + the Fund’s age in years.
 Hotspot Indicator for counties which have more than 2,000 COVID-19 cases
 reported by March 30, 2020.
 Perf_BB Indicator variable set to 1 if a fund is in the top tercile of value added
 as defined by Berk and van Binsbergen (2015). Fund manager
 performance measurement begins in 2010 and ends 1 year before the
 date being tested (i.e., end date of 2018 for any 2019 mutual fund
 regressions).
 Perf_CAPM Indicator variable for high fund manager skill defined similarly to
 Perform with historical alpha estimated using the CAPM model
 instead of Carhart 4 factors.
 Perf_Car4 Indicator variable set to 1 if a fund is in the top tercile of alpha in the
 previous period. The alpha is measured using returns adjusted for the
 Carhart (1997) 4 factors over the rolling past 5 years using monthly
 data.

 28
SCI Social Connectedness Index from Facebook. See Appendix A.2 on
 how it is developed.
Share Change (%) The scaled change in number of shares held by a mutual fund, defined
 as the change in number of shares over the quarter scaled by number
 of shares in the previous quarter, in percentage form.
Share Change The scaled change in number of shares held by a mutual fund, defined
Per Shrout as the change in number of shares over the quarter scaled by number
 of shares outstanding (in 10-5s).
VRet Fund return (net of cost such as management fees and expenses) in
 percentages at the end of the current quarter which is calculated as
 the value weighted return of each fund class, using AUM as the
 weight.

 29
You can also read