MONEY MARKET FUNDS AND THE 2020 COVID CRISIS - MAY 2021
←
→
Page content transcription
If your browser does not render page correctly, please read the page content below

MONEY MARKET FUNDS
AND THE 2020 COVID
CRISIS

            MAY 2021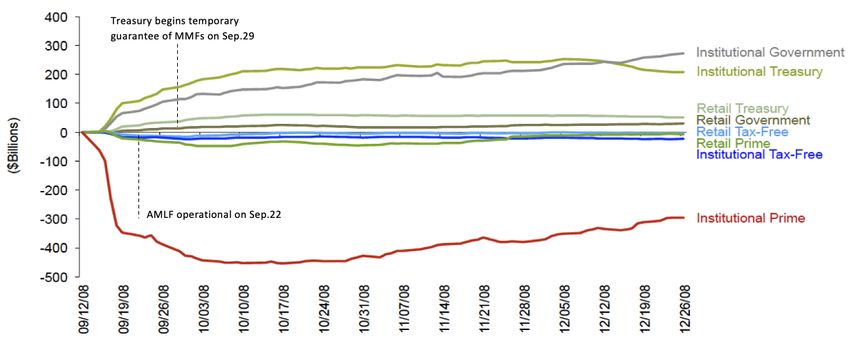
©        Committee on Capital Markets Regulation 2021. All rights reserved. Limited extracts may be reproduced
or translated provided the source is stated.
The Committee on Capital Markets Regulation (the “Committee”) is an independent 501(c)(3) research
organization, financed by contributions from individuals, foundations, and corporations. The Committee’s
membership includes thirty-eight leaders drawn from the finance, business, law, accounting, and academic
communities. The Committee Co-Chairs are R. Glenn Hubbard, Dean Emeritus of Columbia Business
School, and John L. Thornton, Former Chairman of the Brookings Institution. The Committee’s President is
Hal S. Scott, Emeritus Nomura Professor of International Financial Systems at Harvard Law School and
President of the Program on International Financial Systems. Founded in 2006, the Committee undertook its
first major report at the request of the incoming U.S. Secretary of the Treasury, Henry M. Paulson. Over ten
years later, the Committee’s research continues to provide policymakers with an empirical and non-partisan
foundation for public policy. This report was prepared by the Committee’s Executive Director, John Gulliver.
Gregory Babyak     Global Head of Regulatory and Policy Group, Bloomberg L.P.

  Kenneth Bentsen, Jr.   President & Chief Executive Officer, Securities Industry and Financial Markets
                         Association

        Andrew Berry     Managing Director, Head of Regulatory Strategy and Initiatives, Americas, UBS
                         Group AG

        Jeffrey Brown    Senior Vice President & Acting General Counsel, Charles Schwab & Co., Inc.

      Roel C. Campos     Partner, Locke Lord Bissell & Liddell LLP; Former Commissioner, Securities and
                         Exchange Commission

        Jason Carroll    Managing Director, Hudson River Trading

         Douglas Cifu    Chief Executive Officer, VIRTU Financial, Inc.

         Allen Ferrell   Harvey Greenfield Professor of Securities Law, Harvard Law School

          John Finley    Senior Managing Director and Chief Legal Officer, The Blackstone Group Inc.

Benjamin M. Friedman     William Joseph Maier Professor of Political Economy, Harvard University

     Kenneth A. Froot    Andre R. Jakurski Professor of Business Administration, Harvard Business School

       Dan Gallagher     Chief Legal Officer, Robinhood

   Kenneth C. Griffin    President & Chief Executive Officer, Citadel LLC

    R. Glenn Hubbard     Russell L. Carson Professor of Finance and Economics & Dean Emeritus, Columbia
                         Business School; Co-Chair, Committee on Capital Markets Regulation

        Jennifer Imler   Managing Director, Head of Capital Markets Liquidity, Corporate & Investment
                         Banking, Wells Fargo & Company

     Victoria Ivashina   Lovett-Learned Professor at Harvard Business School

            Wei Jiang    Arthur F. Burns Professor of Free and Competitive Enterprise & Vice Dean for
                         Curriculum and Instruction Dean’s Office, Columbia Business School

         Michael Koh     Managing Director and Head of Regulatory Strategy & Policy, BNP Paribas
                         S.A.
    Andrew Kuritzkes     Executive Vice President & Chief Risk Officer, State Street Corporation

        Craig Lazzara    Managing Director and Global Head of Index Investment Strategy, S&P Dow Jones
                         Indices
Andrei Magasiner Corporate Treasurer, The Bank of America Corporation
Andrew Nash Managing Director and Head of Regulatory Affairs, Morgan Stanley
Andy Navarrete Executive Vice President, External Affairs, Capital One Financial Corporation
Barbara G. Novick Vice Chairman, BlackRock, Inc.
Jamie Pagliocco Head of Fixed Income Division, Fidelity Investments Inc
C.D. Baer Pettit President and Chief Operating Officer, MSCI Inc.
Craig Phillips Former Counselor to the Secretary, U.S. Department of the Treasury
Robert C. Pozen Senior Lecturer, MIT Sloan School of Management
David Rubenstein Co-Founder and Co-Executive Chairman, The Carlyle Group
David Sampson President and Chief Executive Officer, American Property Casualty Insurance
Association
Hal S. Scott Emeritus Nomura Professor, Director of the Program on International Financial
Systems, Harvard Law School; Director, Committee on Capital Markets Regulation
Leslie N. Silverman Senior Counsel, Cleary Gottlieb Steen & Hamilton LLP; Committee Legal Advisor
JPMorgan Chase & Co. JPMorgan Chase & Co.
John Suydam Chief Legal Officer, Apollo Global Management
John L. Thornton Former Chairman, The Brookings Institution; Co-Chair, Committee on Capital
Markets Regulation
Joseph Ucuzoglu Chief Executive Officer, Deloitte US
Yuqiang Xiao General Manager of ICBC New York, Industrial and Commercial Bank of China,
Limited
Michael Zarcone Head of Corporate Affairs and Chief of Staff to the Chairman and CEO, MetLife,
Inc.Money Market Funds and the 2020 COVID Crisis
Table of Contents

Executive Summary ........................................................................................................................ 1
Part I: Overview of MMFs: Regulation, Trends in AUM and Role in Short-Term Funding ......... 3
   A.         Regulation ........................................................................................................................... 3
        i.       2010 Liquidity Rules for MMFs ..................................................................................... 4
        ii.      Additional 2014 Reforms to Prime MMFs ..................................................................... 5
   B.         MMF Assets – Size and Trends .......................................................................................... 6
   C.         The Role of Prime MMFs in Short-Term Funding Markets ............................................... 7
Part II: Assessing the Role of Prime MMFs in the 2008 and 2020 Crises ..................................... 8
   A.         MMFs During the 2008 Financial Crisis ............................................................................ 8
   B.         MMFs During the March 2020 COVID Crisis ................................................................... 9
   C.         Key Differences Between the Role of MMFs in the 2008 and 2020 Crises ..................... 11
Part III: Cause of 2020 Withdrawals and Systemic Risk Posed by Prime MMFs ........................ 13
   A.         Liquidity Fees & Gates Drove Withdrawals from Prime MMFs in 2020 Crisis .............. 13
   B.         Prime MMFs, Contagion and Systemic Risk in 2020 and Beyond .................................. 15
Part IV: Policy Recommendations ................................................................................................ 20
   A.         Enhancing Prime MMF Liquidity..................................................................................... 21
   B.         Capital Requirements for Prime MMFs ............................................................................ 22
   C.         Swing Pricing .................................................................................................................... 24
Part V: Conclusion ........................................................................................................................ 27
Executive Summary
This report by the Committee on Capital Markets Regulation (the “Committee”) examines
the role of money market funds (“MMFs”) in the March 2020 COVID crisis and sets forth reforms
that would enhance the liquidity of MMFs that primarily invest in short-term private debt securities
(“prime MMFs”). The Committee’s recommendations are intended to significantly reduce the
likelihood that government intervention to support prime MMFs will be necessary in a future crisis.
Prime MMFs played a central role in the 2008 financial crisis and again played a part in
the 2020 COVID crisis. During the 2008 crisis, prime MMFs experienced a widespread run by
investors. Prime MMFs that are held by institutional investors (“institutional prime MMFs”)
experienced larger and faster withdrawals than prime MMFs held by retail investors (“retail prime
MMFs”). In order to halt the run, the U.S. Treasury Department guaranteed investments in MMFs
and the Federal Reserve created a liquidity facility for MMFs.
Following the 2008 crisis, prime MMFs were subject to new regulations to prevent a
similar event from recurring. The Securities and Exchange Commission (“SEC”) required that
prime MMFs hold a liquidity buffer of 30% of assets invested in cash, private debt securities that
mature within one week, and certain short-term government debt securities. Also, the boards of
prime MMFs were provided the authority to impose fees and gates on retail and institutional
investors if a MMF’s liquid assets fell below the 30% minimum. Institutional prime MMFs were
further required to adopt a floating net asset value (“NAV”), meaning that MMF shares would be
priced and redeemed based on the fair market value of assets.
However, prime MMFs again experienced significant investor withdrawals during the
2020 COVID crisis, predominantly from institutional prime MMFs. The Federal Reserve
intervened to provide liquidity to MMFs, but the Treasury Department did not guarantee MMFs.
Following the 2020 crisis, there is widespread agreement among policymakers that the recent
regulatory reforms failed at making prime MMFs sufficiently resilient against future crises. In this
report, we set forth reforms to enhance their resiliency.
We begin Part I by providing an overview of the regulation of MMFs and trends in assets
under management (“AUM”) by MMFs. We also describe the role of prime MMFs in providing
short-term funding to the financial system. In Part II, we provide an overview of the role of prime
MMFs in the 2008 and 2020 crises, including the size of withdrawals and government support
provided by the Federal Reserve and U.S. Treasury Department. We identify key differences
between the two crises that indicate the prime MMFs were better positioned to withstand the 2020
crisis than the 2008 financial crisis. For example, prime MMFs had lower credit risk and higher
liquidity buffers in 2020 than in 2008. Withdrawals from prime MMFs in 2020 were also half the
size of withdrawals in 2008 and Federal Reserve lending to MMFs was lower in 2020 than it was
in 2008. There also was not a government guarantee of MMFs in 2020 as there was in 2008.
In Part III, we examine the cause of the withdrawals on prime MMFs in 2020. We find that
institutional investors withdrew from prime MMFs in order to avoid liquidity fees and gates that
could be imposed on investors when a prime MMF’s buffer of liquid assets falls below the 30%
minimum. We also consider the risk that prime MMFs could pose for the financial system and
1evidence from the 2020 crisis indicating whether that risk materialized. We find that individual
financial institutions and non-financial companies only rely on prime MMFs for a small amount
of their funding and that the loss of such funding is highly unlikely to cause their insolvency. We
also find no evidence to support that withdrawals from prime MMFs triggered a broader run in
short-term funding markets during the 2020 crisis.
In Part IV, we evaluate policy reforms to prime MMFs that would enhance their resiliency
and reduce the likelihood of future government support. We begin by evaluating whether prime
MMFs should be abolished. We find that doing so would not eliminate the contagion risk
associated with uninsured wholesale short-term funding of which prime MMFs represent only a
very small share. Prohibiting prime MMFs would also have unclear effects on financial stability
as institutional investors could shift their assets to less-regulated alternatives. Abolishing prime
MMFs could also have unintended consequences, including increasing funding costs for issuers of
short-term debt and reducing returns for investors in prime MMFs. We therefore do not support
abolishing prime MMFs.
We then set forth recommendations for enhancing the resiliency of prime MMFs. The 2020
crisis demonstrated that prime MMFs’ liquidity buffers did not function as intended. Investors in
prime MMFs treated the 30 percent minimum as a floor, because breaching that minimum provided
MMF boards with the authority to restrict or apply a fee to withdrawals. The SEC can therefore
reduce the incentive of investors to withdraw by simply eliminating liquidity fees and gates thereby
allowing prime MMFs to use their liquidity buffers to meet investor withdrawals. We further
recommend that the SEC enhance the quality of prime MMFs’ liquidity buffers to promote investor
confidence in the ability of prime MMFs to withstand market stress. One way that the SEC could
do so is by requiring that prime MMFs hold 25-50% of their weekly liquidity buffer in short-term
U.S. government securities, including U.S. government agency securities.
Next, we examine proposals to impose capital buffers on prime MMFs. We find that capital
requirements would substantially increase the cost of operating prime MMFs, which would likely
prevent sponsors from offering such funds. Even if sponsors continued to offer prime MMFs with
capital requirements, it is not clear that capital buffers against losses would meaningfully reduce
the incentive of investors to withdraw in a crisis. We therefore do not support capital buffers for
prime MMFs. Finally, we consider swing pricing proposals for prime MMFs. Swing pricing
authorizes prime MMFs to impose additional fees on redeeming investors, typically after a certain
withdrawal threshold based on total AUM is met (e.g., such as 10% of total AUM are withdrawn
from a fund). We find that swing pricing would be impractical to implement for prime MMFs as
doing so would prevent same-day settlement--a key feature for institutional investors in prime
MMFs. Swing pricing would also be ineffective at reducing the incentive of investors to withdraw
in a crisis. We therefore do not support swing pricing for prime MMFs.
2Part I: Overview of MMFs: Regulation, Trends in AUM and Role in Short-Term Funding
A. Regulation
Money market funds (“MMFs”) are a type of mutual fund registered under the Investment
Company Act of 1940 (the “Act”), and since 1983, regulated under Securities and Exchange
Commission (“SEC”) Rule 2a-7 of the Act. 1 MMFs invest in short-term, high-quality debt
securities and seek to preserve capital while offering investors a diversified portfolio with low-risk
returns and daily liquidity (with some MMFs offering intraday liquidity). 2
There are three types of money market funds. Government money market funds invest
99.5% or more of their total assets in cash, government securities and/or repurchase agreements
that are fully collateralized with government securities. 3 Prime money market funds invest
primarily in private debt instruments issued by non-financial companies and banks, including
commercial paper and certificates of deposit, in addition to government debt. 4 And finally, tax-
free or municipal MMFs invest primarily in municipal debt and offer tax-exempt income to
shareholders. 5
Each of these three types of MMFs can be further bifurcated based on whether they are
offered exclusively to retail investors or offered to institutions. 6 Institutional MMFs currently
account for about two-thirds of the assets under management (“AUM”) in MMFs. 7
Unlike other investment companies, government MMFs, tax-exempt funds and retail prime
funds seek to maintain a stable Net Asset Value (“NAV”) of $1.00. 8 However, a MMF’s $1.00
share price is not government guaranteed and MMFs must publicly state that their shares can lose
value. 9 MMFs with a stable NAV can use amortized cost accounting when valuing their assets.10
Amortized cost accounting facilitates the maintenance of a stable NAV because it permits stable
NAV MMFs to value their assets at the amount paid for the investments rather than at fair market
1
17 C.F.R. § 270.2a-7. See also INVESTMENT COMPANY INSTITUTE, Investment Company Fact Book, 60th Edition,
300 (2020), https://www.ici.org/pdf/2020_factbook.pdf [“ICI Fact Book”].
2
See U.S. SEC. & EXCH. COMM’N, Money Market Funds (2021), https://www.investor.gov/introduction-
investing/investing-basics/investment-products/mutual-funds-and-exchange-traded-
5#:~:text=Government%20money%20market%20funds%20are,collateralized%20fully%20with%20government%2
0securities; BLACKROCK, Operational guide to cash investing: BlackRock U.S. Money Market Funds (2020),
https://www.blackrock.com/cash/literature/investment-guide/operational-guide-to-cash-investing.pdf;
3
17 C.F.R. § 270.2a-7(a)(14); ICI Fact Book, supra note 1, at 298.
4
ICI Fact Book, supra note 1, at 301.
5
FIDELITY, What are money market funds? (2021), https://www.fidelity.com/learning-center/investment-
products/mutual-funds/what-are-money-market-funds.
6
The SEC defines “retail” as as natural persons. 17 C.F.R. § 270.2a-7(a)(14); ICI Fact Book, supra note 1, at 298,
302.
7
INVESTMENT COMPANY INSTITUTE, Money Market Fund Assets (February 24, 2021),
https://www.ici.org/research/stats/mmf/.
8
17 C.F.R. § 270.2a-7(c)(1)(i).
9
SEC Reform (2014), infra note 21, at 47816.
10
17 C.F.R. § 270.2a-7(c)(1)(i).
3value. 11 Amortized cost accounting only requires a readjustment to the value of assets if there is
an event that jeopardizes the repayment expectation, such as a default by an issuer. 12 Institutional
prime MMFs, on the other hand, must value their assets based on fair market value and as a result
they generally do not maintain a stable NAV of $1.00. 13 The “floating NAV” requirement for
institutional prime MMFs is described in further detail later in this section.
i. 2010 Liquidity Rules for MMFs
In February 2010, the SEC amended Rule 2a-7 to significantly increase the liquidity of
MMFs. 14 The SEC adopted liquidity reforms to MMFs in order to reduce the risk of another run
on prime MMFs as experienced in 2008 and described in further detail in Part II of this report. 15
The SEC enhanced the liquidity of MMF portfolios in three key ways. First, the SEC
reduced the maximum permitted weighted average portfolio maturity of MMFs from 90 days to
60 days. 16 Second, as shown by Table 1 below, the SEC required that MMFs invest at least 10%
of their portfolios in “daily liquid assets,” including cash, U.S. government securities, and other
securities that provide the holder the right to demand payment within one day. 17 And third, the
SEC required MMFs to hold 30% of their portfolio in “weekly liquid assets,” which include daily
liquid assets, U.S. government agency discount notes maturing in 60 days or less, and other private
debt securities maturing within five business days, as also shown in Table 1. 18 Critically, these
daily and weekly liquidity buffers are meant to be available to be drawn down in a crisis to allow
MMFs to meet investor withdrawals. 19
Table 1: Liquid Assets 20
Daily Liquid Assets Weekly Liquid Assets
Cash (including demand deposits at banks) Daily liquid assets (see column at left)
Direct obligations of the U.S. government (primarily Government agency discount notes with
U.S. Treasury bills, notes, and bonds). remaining maturities of 60 days or less.
Securities that will mature or are subject to Securities that will mature or are subject to
a demand feature that is exercisable and a demand feature that is exercisable and
payable within one business day (including commercial payable within five business days (including
paper and certificates of deposit). commercial paper and certificates of deposit).
Receivables scheduled to be paid within one Receivables scheduled to be paid within five
business day. business days.
11
Dennis R. Beresford, Amortized Cost is “Fair” for Money Market Funds, CENTER FOR CAPITAL MARKETS
COMPETITIVENESS, 3 (Fall 2012), http://www.centerforcapitalmarkets.com/wp-content/uploads/2010/04/Money-
Market-Funds_FINAL.layout.pdf.
12
Id.
13
17 C.F.R. § 270.2a-7(c)(1)(ii).
14
U.S. SEC. & EXCH. COMM’N, Money Market Fund Reform, 75 FED. REG. 10059 (March 4, 2010),
https://www.federalregister.gov/documents/2010/03/04/2010-4059/money-market-fund-reform [“SEC Reform
(2010)”].
15
CCMR, What to Do About Contagion? A Call By The Committee on Capital Markets Regulation for a Public
Debate, 23 (Sept. 2014), https://www.capmktsreg.org/wp-content/uploads/2018/10/What-to-do-About-
Contagion.pdf.
16
17 C.F.R. § 270.2a-7(a)(8), (d)(1)(ii).
17
17 C.F.R. § 270.2a-7(a)(8), (d)(4)(ii).
18
17 C.F.R. § 270.2a-7(a)(28), (d)(4)(iii).
19
See SEC Reform (2010), supra note 14, at 10062 (describing the new MMF requirements as “liquidity buffers that
will help them withstand sudden demands for redemptions.”).
20
17 C.F.R. § 270.2a-7(a)(8), (28).
4ii. Additional 2014 Reforms to Prime MMFs
In 2014, the SEC finalized additional reforms to prime MMFs to further reduce the risk of
investor runs. 21 These reforms include the authorization of liquidity fees and gates for prime
MMFs and a floating NAV requirement for institutional prime MMFs. 22 The SEC allowed for a
two-year transition period, so the rules came into effect in 2016. 23
The 2014 reforms authorized boards of prime MMFs (including retail and institutional
funds) to impose liquidity (redemption) fees of up to 2 percent or to suspend redemptions for up
to ten days if the fund’s weekly liquid assets fall below the 30 percent weekly liquid asset
requirement. 24 Liquidity fees are intended to provide investors continued access to cash
redemptions but reduce the incentive to redeem because of the increased cost of doing so. 25
Liquidity gates prevent redemptions altogether and thereby allow MMFs to temporarily avoid a
potentially costly fire-sale of assets. 26
The 2014 reforms also require institutional prime MMFs to value their portfolio securities
at fair market value rather than amortized cost accounting and require institutional prime MMFs
to sell and redeem their shares based on a floating NAV. 27 The floating NAV must be priced to
the fourth decimal place or 1/100th of a basis point, so $1.0000. 28 In other words, the 2014 reforms
prohibited institutional prime MMFs from using the special pricing and valuation conventions that
permitted them to maintain a constant share price of $1.00. 29 The floating NAV requirement is
intended to prevent investors from redeeming at a stable share price of $1.00 when the fair market
value of an institutional prime MMF’s portfolio has fallen below $1.00. 30 Instead, investors in
institutional prime MMFs are only able to receive cash withdrawals in the same amount as the fair
market value of the fund’s assets. 31 The floating NAV is also intended to make it more transparent
to investors that they bear the risk of loss. 32
However, MMF investors still have an incentive to redeem early during periods of market
stress as they may fear that withdrawals by other investors will result in the depletion of the MMF’s
highest quality assets or that the MMF will incur future losses. Floating NAVs therefore do not
forestall the possibility of large withdrawals from prime MMFs during market stress.
21
U.S. SEC. & EXCH. COMM’N, Money Market Fund Reform; Amendments to Form PF, 79 FED. REG. 47735 (Aug.
14, 2014), https://www.federalregister.gov/documents/2014/08/14/2014-17747/money-market-fund-reform-
amendments-to-form-pf [“SEC Reform (2014)”].
22
CCMR, What to Do About Contagion? A Call By The Committee on Capital Markets Regulation for a Public
Debate, 23 (Sept. 2014), https://www.capmktsreg.org/wp-content/uploads/2018/10/What-to-do-About-
Contagion.pdf.
23
SEC Reform (2014), supra note 21, at 47775.
24
17 C.F.R. § 270.2a-7(c)(2).
25
SEC Reform (2014), supra note 21, at 47747-47748.
26
SEC Reform (2014), supra note 21, at 47747-47748.
27
SEC Reform (2014), supra note 21, at 47775.
28
17 C.F.R. § 270.2a-7(1)(ii).
29
SEC Reform (2014), supra note 21, at 47775.
30
SEC Reform (2014), supra note 21, at 47773-47774.
31
SEC Reform (2014), supra note 21, at 47773-47774.
32
SEC Reform (2014), supra note 21, at 47775.
5B. MMF Assets – Size and Trends
Figure 1 provides an overview of trends in assets under management (“AUM”) by MMFs
from 2007 to year-end 2020.
From 2007-2014, prime MMFs constituted the majority of total AUM by MMFs. However,
following the implementation of liquidity fees and gates for prime MMFs and a floating NAV
requirement for institutional prime MMFs in 2016, total AUM by prime MMFs quickly fell by
70% to a record low of $400 billion. The AUM by government MMFs also nearly doubled in 2016
to $2.2 trillion as institutional investors shifted out of prime MMFs and into government MMFs
that could still offer a stable NAV and were not subject to liquidity fees and gates. 33
As of year-end 2020, government MMFs accounted for $3.6 trillion in assets (84% of all
MMF assets), prime MMFs held $600 billion total assets (14% of all MMF assets), and the
remaining 2% of MMF assets were in tax-exempt MMFs. We note that total AUM in prime MMFs
at the year-end 2020 were approximately one-third of their total AUM during the 2008 financial
crisis.
Figure 1: 2007-2020 U.S. MMF Assets by Fund Type, 2007-2020 ($T) 34
$4.3
$0.1
$3.8 $0.3
$3.6 $0.3
$0.5 $0.1
$3.3
$3.1 $3.0 $0.5
$0.4
$0.5 $0.8 $2.8 $2.7 $2.7 $2.8 $2.7 $2.8 $0.1 $0.3
$2.7 $2.7 $0.1
$0.1 $0.3
$0.6 $0.3 $0.3 $0.3 $0.3 $0.3 $0.3 $0.3
$0.3 $0.2
$0.4 $0.1 $0.2
$0.8 $0.6 $0.5 $0.5 $0.5
$1.1 $0.6
$3.6
$1.2 $0.9
$1.1 $0.9 $0.9 $0.9 $0.9
$1.1 $2.7
$2.2 $2.3 $2.3
$1.5
$1.1 $1.0 $1.2
$0.8 $0.9 $1.0 $0.9 $1.0
2007 2008 2009 2010 2011 2012 2013 2014 2015 2016 2017 2018 2019 2020
Government Prime Institutional Prime Retail Tax Exempt
33
See generally Catherine Chen, Marco Cipriani, Gabriele La Spada, Philip Mulder, Neha Shah, Money Market
Funds and the New SEC Regulation, FEDERAL RESERVE BANK OF NEW YORK (March 20, 2017),
https://libertystreeteconomics.newyorkfed.org/2017/03/money-market-funds-and-the-new-sec-regulation.html;
Viktoria Baklanova, Isaac Kuznits, Trevor Tatum, Primer: Money Market Funds and the Commercial Paper
Market, U.S. SEC. & EXCH. COMM’N (Feb. 4, 2021), https://www.sec.gov/files/primer-money-market-funds-
commercial-paper-market.pdf.
34
INVESTMENT COMPANY INSTITUTE, Statistics (2021), https://www.ici.org/statistics [“ICI Data”].
6C. The Role of Prime MMFs in Short-Term Funding Markets
Based in part on data from the Investment Company Institute (“ICI”), Table 2 on the next
page provides an overview of the role of prime MMFs’ investments in certain U.S. short-term
assets as of June 2020, including U.S. Treasury bills, repurchase agreements on U.S. Treasuries,
commercial paper (including financial and non-financial commercial paper) and certificates of
deposit. It demonstrates the total dollar value of prime MMFs holdings for each type of asset, as
well as the percentage share owned by prime MMFs.
As of June 2020, prime MMFs held 5% or less of total outstanding short-term U.S.
Treasuries, U.S. agency debt and repurchase agreements. Prime MMFs represent a larger share of
outstanding commercial paper (21%) and certificates of deposit (13%).
Table 2: U.S. Prime MMF Short Term Securities Holdings June 2020 35
Total amount Prime ($B) Prime (% of total outstanding)
Security type
outstanding ($B) Retail Institutional Retail Institutional
Taxable short-term assets $13,762 $413 $275 3% 2%
Short-term US Treasuries1 $7,141 $143 $0 2% 0%
Repurchase agreements2 $2,425 $49 $73 2% 3%
Short-term US agency debt3 $938 $19 $0 2% 0%
Commercial paper4 $1,007 $121 $91 12% 9%
Certificates of deposit5 $1,753 $123 $105 7% 6%
Eurodollar deposits6 $497 $0 $0 0% 0%
Table 3 shows that prime MMFs total dollar holdings as well as total share owned of
commercial paper and certificates of deposit are substantially reduced from end-2007. At end-
2007, prime MMFs held 37% of outstanding commercial paper and 18% of certificates of deposit.
Table 3: U.S. Prime MMF Short Term Securities Holdings Year End 2007 36
Total amount Prime ($B) Prime (% of total outstanding)
Security type
outstanding ($B)
Retail Institutional Retail Institutional
Commercial paper $1,786 $274 $400 15% 22%
Certificates of deposit $2,015 $150 $219 7% 11%
35
INVESTMENT COMPANY INSTITUTE, Report of the COVID-19 Market Impact Working Group: Experiences of US
Money Market Funds During the COVID-19 Crisis, Figure 3.3 (November 2020),
https://www.sec.gov/comments/credit-market-interconnectedness/cll10-8026117-225527.pdf; SEC Form N-MFP;
FEDERAL RESERVE SYSTEM, Financial Accounts of the United States - Z.1 (2021),
https://www.federalreserve.gov/releases/z1/default.htm.
36
ICI Data, supra note 34; FEDERAL RESERVE SYSTEM, Financial Accounts of the United States - Z.1 (2021),
https://www.federalreserve.gov/releases/z1/default.htm.
7Part II: Assessing the Role of Prime MMFs in the 2008 and 2020 Crises
A. MMFs During the 2008 Financial Crisis
Figure 2 on the next page illustrates the run on prime MMFs during the 2008 financial
crisis and the subsequent interventions by the Federal Reserve and U.S. Treasury Department to
stop the run.
During September 2008, prime MMFs experienced $386 billion in total outflows—or
approximately 19% of total AUM. As demonstrated by Figure 2, withdrawals from prime MMFs
began on Friday, September 12th and intensified on Monday, September 15th when Lehman
Brothers filed for bankruptcy. 37 The run on prime MMFs further accelerated on Tuesday,
September 16th when the Reserve Primary Fund, the largest prime MMF, “broke the buck”(i.e., its
NAV fell below $1.00) due to the fact that the Reserve Primary Fund owned commercial paper
issued by Lehman Brothers that was in default. 38
On Friday, September 19th, the Federal Reserve announced the implementation of the
Asset-Backed Commercial Paper Money Market Fund Liquidity Facility (the “AMLF”), which
financed bank purchases of asset-backed commercial paper from MMFs, and became operational
on September 22nd. 39 This slowed the run on prime MMFs but, as demonstrated by Figure 2 below,
withdrawals continued until the U.S. Treasury Department announced on September 29th that it
would guarantee all investments in MMFs through the Exchange Stabilization Fund (the “ESF”). 40
During the 2008 crisis, outflows from institutional prime MMFs accounted for the vast
majority of outflows from prime MMFs—approximately 92 percent or $354 billion—while
government MMFs experienced large inflows.
37
Jill E. Fisch, The Broken Buck Stops Her Here: Embracing Sponsor Support in Money Market Fund Reform, 93
N.C. L. Rev. 935 (2015),
https://scholarship.law.upenn.edu/cgi/viewcontent.cgi?article=2324&context=faculty_scholarship.
38
Marco Cipriani, Michael Holscher, Antoine Martin, Patrick E. McCabe, Money Market Funds and Systemic Risk,
FEDERAL RESERVE BANK OF NEW YORK: LIBERTY STREET ECONOMICS (June 11, 2012),
https://libertystreeteconomics.newyorkfed.org/2012/06/money-market-funds-and-systemic-risk.html.
39
Naohiko Baba, Robert N McCauley, Srichander Ramaswamy, US dollar money market funds and non-US banks,
BANK FOR INTERNATIONAL SETTLEMENTS, 74-79 (March 2009), https://www.bis.org/publ/qtrpdf/r_qt0903g.pdf;
FEDERAL RESERVE SYSTEM, Federal Reserve Board announces two enhancements to its programs to provide
liquidity to markets (Sept. 19, 2008),
https://www.federalreserve.gov/newsevents/pressreleases/monetary20080919a.htm.
40
U.S. DEPT. OF TREASURY, Treasury Announces Temporary Guarantee Program for Money Market Funds (Sept.
29, 2008), https://www.treasury.gov/press-center/press-releases/pages/hp1161.aspx.
841
Figure 2: U.S. MMF Asset Flows during 2008 Crisis
B. MMFs During the March 2020 COVID Crisis
Figure 3 illustrates the withdrawals on prime MMFs during the March 2020 COVID crisis
and the Federal Reserve intervention to halt investor withdrawals.
During March 2020, prime money market funds saw total outflows of $139 billion or 17%
of total assets. 42 As illustrated by Figure 3, Prime MMFs experienced $86 billion in outflows from
March 11th to March 18th. The Federal Reserve then announced on March 18th that it would create
the Money Market Fund Liquidity Facility (the “MMLF”) to provide liquidity to MMFs.43
Although the pace of withdrawals from prime MMFs immediately slowed, an additional $53
billion was withdrawn from prime MMFs from March 18th to March 23rd. Withdrawals from prime
MMFs stopped after the MMLF launched on March 23rd. 44
Similar to 2008, Figure 3 below further shows that withdrawals from prime MMFs were
primarily from institutional prime MMFs ($91 billion) rather than from retail prime MMFs ($48
billion) and that government MMFs experienced large inflows from investors during the 2020
COVID crisis.
41
IMONEYNET, Money Market Mutual Funds Asset Flows (July 29, 2013), available at
http://www.imoneynet.com.
42
ICI Data, supra note 34.
43
FEDERAL RESERVE SYSTEM, Money Market Mutual Fund Liquidity Facility (April 12, 2021),
https://www.federalreserve.gov/monetarypolicy/mmlf.htm.
44
COMMITTEE ON CAPITAL MARKETS REGULATION, Treasury and Fed Lending Programs: An Assessment and Call
for Continued Support for SMEs, 2 (Dec. 2020), https://www.capmktsreg.org/wp-content/uploads/2020/12/CCMR-
Report-Treasury-Fed-Programs-Assessment-and-Recommendations-12.29.2020.pdf
9Figure 3: U.S. MMF Asset Flows During 2020 Crisis 45
45
ICI Data, supra note 34.
10C. Key Differences Between the Role of MMFs in the 2008 and 2020 Crises
In this section we describe key differences between the role of prime MMFs in the 2008
financial crisis as compared to the role of prime MMFs during the 2020 COVID crisis. 46 We
conclude that prime MMFs in 2020 faced less credit risk than prime MMFs in 2008 and were also
more liquid. The run on prime MMFs in 2008 was also larger than withdrawals from prime MMFs
in 2020, and substantially more government support to prime MMFs was provided in 2008 than in
2020. 47 These differences indicate that prime MMFs were better positioned going into the 2020
COVID crisis than they were going into the 2008 financial crisis.
First, in 2008, prime MMFs experienced losses on their investments after Lehman Brothers
failed. 48 There was also widespread concern that other major financial institutions were insolvent
and that other short-term debt securities held by prime MMFs would be further impaired. 49 Prime
MMFs were also heavily invested in the asset backed commercial paper market, 50 which largely
consisted of commercial paper backed by subprime loans that were in default. Prime MMFs
therefore faced significant credit risk and incurred actual losses in 2008. However, in 2020, the
issuers of commercial paper and other short-term assets held by prime MMFs did not default on
their obligations or go into bankruptcy as Lehman Brothers did in 2008. Nor was there similar
widespread concern (as there was in 2008) that issuers of the short-term debt securities held by
prime MMFs would default. Indeed, Li et al. (2020) find that credit risk concerns were not a factor
in investor withdrawals in 2020. 51
Prime MMFs were also more liquid in 2020 than they were in 2008 meaning that prime
MMFs were better positioned to meet investor withdrawals in 2020 than in 2008. For example, in
2020, the weighted average maturity of prime MMFs portfolios was 35 days and in 2008 it was 46
days (a portfolio with a shorter maturity is more liquid). 52 Furthermore, in 2020, over 40% of prime
MMF assets were invested in weekly liquid assets. Prior to the 2008 crisis, prime MMFs held less
than 30% of assets in weekly liquid assets. 53
46
See generally BLACKROCK, Lessons from COVID-19: U.S. Short-Term Money Markets (July 2020),
https://www.blackrock.com/corporate/literature/whitepaper/viewpoint-lessons-from-covid-19-us-short-term-money-
markets-july-2020.pdf [“BlackRock on MMFs”]; INVESTMENT COMPANY INSTITUTE, Experiences of US Money
Market Funds During the COVID-19 Crisis, 2 (Nov. 2020), https://www.sec.gov/comments/credit-market-
interconnectedness/cll10-8026117-225527.pdf [“ICI on MMFs during COVID”].
47
See BlackRock on MMFs, supra note 46, at 14.
48
See, e.g., Marco Cipriani, Michael Holscher, Antoine Martin, and Patrick E. McCabe, Twenty-Eight Money
Market Funds That Could Have Broken the Buck: New Data on Losses during the 2008 Crisis, FEDERAL RESERVE
BANK OF NEW YORK: LIBERTY STREET ECONOMICS (Oct. 9, 2013),
https://libertystreeteconomics.newyorkfed.org/2013/10/twenty-eight-money-market-funds-that-could-have-broken-
the-buck-new-data-on-losses-during-the-2008-c.html
49
See, e.g., ICI on MMFs during COVID, supra note 46, at 12.
50
See BlackRock on MMFs, supra note 46, at 6.
51
Lei Li, Yi Li, Marco Macchiavelli, and Xing (Alex) Zhou, Liquidity Restrictions, Runs, and Central Bank
Interventions: Evidence from Money Market Funds (Dec. 30, 2020),
https://papers.ssrn.com/sol3/papers.cfm?abstract_id=3607593. See also Fernando Avalos and Dora Xia, Investor
size, liquidity and prime money market fund stress, BANK FOR INTERNATIONAL SETTLEMENTS (March 1, 2021),
https://www.bis.org/publ/qtrpdf/r_qt2103b.htm (“In March 2020, prime institutional money market funds serving
large investors experienced withdrawals irrespective of the liquidity of underlying assets.”).
52
ICI on MMFs during COVID, supra note 46, at Figure 3.11.
53
ICI on MMFs during COVID, supra note 46, at Figure 3.12.
11Unsurprisingly given the decline in prime MMF assets since 2014, the size of withdrawals
were much larger in 2008 than in 2020. Prime MMFs in 2008 experienced total withdrawals of
$386 billion whereas prime MMFs in 2020 only experienced total withdrawals of $139 billion.54
As a result, prime MMFs received significantly less government support in 2020 than in 2008.
Most importantly, there was no government guarantee of investments in MMFs in 2020 as there
was in 2008. 55 And the Fed’s AMLF program in 2008 lent $152 billion in support of MMFs
whereas the Fed’s MMLF in 2020 lent $53 billion to MMFs at its peak. 56
54
ICI Data, supra note 34; IMONEYNET, supra note 41.
55
U.S. DEPT. OF TREASURY, Treasury Announces Temporary Guarantee Program for Money Market Funds (Sept.
29, 2008), https://www.treasury.gov/press-center/press-releases/pages/hp1161.aspx.
56
ICI on MMFs during COVID, supra note 46, at 25; COMMITTEE ON CAPITAL MARKETS REGULATION, Treasury
and Fed Lending Programs: An Assessment and Call for Continued Support for SMEs, 2 (Dec. 2020),
https://www.capmktsreg.org/wp-content/uploads/2020/12/CCMR-Report-Treasury-Fed-Programs-Assessment-and-
Recommendations-12.29.2020.pdf
12Part III: Cause of 2020 Withdrawals and Systemic Risk Posed by Prime MMFs
A. Liquidity Fees & Gates Drove Withdrawals from Prime MMFs in 2020 Crisis
Despite the fact that prime MMFs faced less credit risk and were more liquid in the 2020
COVID crisis than they were in the 2008 financial crisis, prime MMFs still experienced large
withdrawals in 2020. In this section, we evaluate the driver of investor withdrawals in the 2020
COVID crisis.
Empirical research by Avalos and Xia (2021) at the Bank for International Settlements
(2021), Cipriana and La Spada (2020) at the New York Fed, 58 and Li et. al (2020) at the Federal
57
Reserve Board 59 find that institutional investors withdrew from prime MMFs to avoid liquidity
fees and gates that could be triggered by a fund’s board once a fund’s 30% minimum WLA
threshold is breached. Rather than enhancing the stability of prime MMFs, liquidity fees and gates
exacerbated investor withdrawals. 60 Investor surveys by ICI confirm that the avoidance of liquidity
fees and gates was the primary factor in motivating withdrawals. 61 ICI further found that although
prime MMFs generally maintained liquidity buffers in excess of the 30% minimum requirement
and no fees and gates were actually imposed on investors, withdrawals accelerated as soon as
funds’ WLA approached 35%. 62
A further indicator of the importance of avoiding breaching the 30% minimum WLA
requirement is provided by the prime MMFs managed by Goldman Sachs and BNY Mellon. These
funds are notable because they experienced some of the largest withdrawals of any prime
institutional MMFs on a percentage basis, as demonstrated by Table 4 on the next page. In
response to investor withdrawals, Goldman Sachs and BNYMellon each purchased $1.2 billion
and $2.5 billion in securities from their institutional prime MMFs in order to avoid breaching the
30% WLA threshold. 63 Thus, sponsors clearly sought to avoid breaching the 30% WLA threshold.
Of course, the experience of Goldman Sachs and BNYMellon raises the question as to why
these funds experienced some of the largest withdrawals. One commonality that both funds share
is that they are both managed by bank sponsors. It could be that bank sponsors took on more
liquidity risk and were therefore more likely to experience large withdrawals. However, Li et al.
(2020) studied this possibility and found that prime institutional MMFs sponsored by banks were
57
Fernando Avalos and Dora Xia, Investor size, liquidity and prime money market fund stress, BANK FOR
INTERNATIONAL SETTLEMENTS (March 2021), https://www.bis.org/publ/qtrpdf/r_qt2103b.pdf
58
Marco Cipriani and Gabriele La Spada, Sophisticated and Unsophisticated Runs, FEDERAL RESERVE BANK OF
NEW YORK (Dec. 2020), https://www.newyorkfed.org/medialibrary/media/research/staff_reports/sr956.pdf.
59
Lei Li, Yi Li, Marco Macchiavelli, and Xing (Alex) Zhou, Liquidity Restrictions, Runs, and Central Bank
Interventions: Evidence from Money Market Funds (Dec. 30, 2020),
https://papers.ssrn.com/sol3/papers.cfm?abstract_id=3607593.
60
See ICI on MMFs during COVID, supra note 46, at 2; BlackRock on MMFs, supra note 46, at 10.
61
INVESTMENT COMPANY INSTITUTE, Letter to the SEC re: Report of the President’s Working Group on Financial
Markets, 11-12 (April 12, 2021), https://www.sec.gov/comments/s7-01-21/s70121-8662926-235321.pdf.
62
INVESTMENT COMPANY INSTITUTE, Letter to the SEC re: Report of the President’s Working Group on Financial
Markets, 11-12 (April 12, 2021), https://www.sec.gov/comments/s7-01-21/s70121-8662926-235321.pdf
63
BlackRock on MMFs, supra note 46, at 13; Lei Li, Yi Li, Marco Macchiavelli, and Xing (Alex) Zhou, Liquidity
Restrictions, Runs, and Central Bank Interventions: Evidence from Money Market Funds, 60 (Dec. 30, 2020),
https://papers.ssrn.com/sol3/papers.cfm?abstract_id=3607593.
13not more likely to experience investor withdrawals than prime institutional MMFs sponsored by
independent asset managers. 64
Table 4 sets forth the fall in AUM by large sponsors of prime MMFs. It demonstrates that
Northern Trust, DWS and Wells Fargo also experienced a fall in AUM of similar magnitude as
Goldman Sachs and BNY Mellon. One commonality between these five sponsors is that each of
them are very small in terms of total AUM as compared to other sponsors of prime MMFs. This
could indicate that small prime MMFs face concentration risk from withdrawals by large investors.
Table 4: March 2020 U.S. Prime Institutional MMF
Drop in AUM by Large Sponsors 65
Assets as of Assets as of Change in Assets Feb % Change in Assets
Sponsor
Feb 28 ($M) Mar 31 ($M) 28 to Mar 31 ($M) Feb 28 to Mar 31
American Funds $104,887 $99,091 -$5,796 -5.5%
BlackRock $74,166 $65,861 -$8,305 -11.2%
BMO $576 $516 -$60 -10.4%
Columbia $16,197 $14,664 -$1,533 -9.5%
Dreyfus/BNY $14,594 $7,112 -$7,482 -51.3%
DWS $498 $261 -$237 -47.6%
Federated $46,209 $32,708 -$13,501 -29.2%
Fidelity $81,808 $67,116 -$14,692 -18.0%
First American $372 $363 -$9 -2.5%
Goldman Sachs $25,235 $11,405 -$13,830 -54.8%
Invesco $2,501 $2,092 -$408 -16.3%
JPMorgan $66,468 $48,140 -$18,328 -27.6%
Meeder $362 $343 -$19 -5.2%
Morgan Stanley $18,863 $12,535 -$6,328 -33.5%
Northern Trust $3,780 $1,622 -$2,158 -57.1%
PGIM $17,113 $15,271 -$1,842 -10.8%
Schwab $5,699 $3,732 -$1,967 -34.5%
State Street $22,007 $14,543 -$7,464 -33.9%
T Rowe Price $21 $21 $0 0.0%
UBS $23,833 $18,074 -$5,759 -24.2%
Vanguard $67,231 $64,817 -$2,414 -3.6%
Wells Fargo $11,084 $6,760 -$4,324 -39.0%
Western $2,131 $1,759 -$371 -17.4%
Total $605,634 $488,805 -$116,829 -19.3%
Note: Calculations only include funds that experienced a decline in assets for the period February 28, 2020 to March 31, 2020.
64
Lei Li, Yi Li, Marco Macchiavelli, and Xing (Alex) Zhou, Liquidity Restrictions, Runs, and Central Bank
Interventions: Evidence from Money Market Funds (Dec. 30, 2020),
https://papers.ssrn.com/sol3/papers.cfm?abstract_id=3607593.
65
CCMR calculations based on Crane Data, supra note 70.
14Although the boards of prime MMFs have the authority to impose liquidity fees and gates
once a fund breaches the 30% minimum WLA, they are not required to do so. 66 This raises the
question of why boards of prime MMFs did not simply notify institutional investors that they did
not intend to suspend redemptions or impose liquidity fees—since doing so could have reduced
the incentive of investors to withdraw to avoid such liquidity fees and gates.
The answer is that the SEC generally prohibits funds from making such an advance
determination. In the adopting release for the rule providing the boards of prime MMFs with the
authority to impose liquidity fees and gates, the SEC states, “commenters proposed that boards
should be permitted to reasonably determine and commit themselves in advance to a policy to not
allow a fee or gate to…be imposed on a fund. We disagree. A blanket decision on the part of a
fund board to not impose fees or gates…would be flatly inconsistent with the fees and gates
amendments we are adopting today.” 67
However, even without the SEC prohibition, pre-emptively refusing to exercise liquidity
fees or liquidity gates could be inconsistent with a fund board’s fiduciary duty to act in the best
interest of remaining fund shareholders. 68 Remaining shareholders in a fund may be better off with
the imposition of gates to stop withdrawals and allow a more orderly liquidation of assets,
especially during market stress. Thus, fund boards could also be constrained by their fiduciary
duties from pre-emptively announcing an intention not to exercise liquidity fees and gates.
Of course, boards of prime MMFs are not required to impose liquidity fees and gates, so
institutional investors withdrew from prime MMFs under the assumption that the boards of prime
MMFs might impose liquidity fees and gates, even if under the circumstances it is unlikely that
the board of a prime MMF would do so. An ICI survey of institutional investors in prime MMFs
found that investors withdrew because “they could not predict how a fund board might act if the
fund breached [the 30% WLA threshold].” 69
B. Prime MMFs, Contagion and Systemic Risk in 2020 and Beyond
A run on prime MMFs could pose systemic risk in two ways. First, if financial institutions
and non-financial corporates rely on prime MMFs as a critical source of short-term funding then
losing access to such funding could threaten their solvency. Second, withdrawals by investors in
prime MMFs could act as a trigger setting off contagion in money markets more broadly.
Table 5 demonstrates that as of end-Q1 2021 the largest U.S. banks each rely on prime
MMFs for less than 1% of total funding. Table 5 further shows that large U.S. banks’ reliance on
prime MMFs for funding is down 75% from 2012 when large banks received 1-4% of total funding
from prime MMFs.
66
17 C.F.R. § 270.2a-7(c)(2).
67
SEC Reform (2014), infra note 21, at 47761.
68
See K&L GATES, Duties of Directors and Trustees of Registered Investment Companies (2012),
https://files.klgates.com/files/upload/dc_im_09_duties_directors_trustees.pdf.
69
INVESTMENT COMPANY INSTITUTE, Letter to the SEC re: Report of the President’s Working Group on Financial
Markets, 11-12 (April 12, 2021), https://www.sec.gov/comments/s7-01-21/s70121-8662926-235321.pdf
15Table 5: U.S. Prime MMF Funding of Large U.S. Banks 70
September 30, 2012 March 31, 2021
Bank $ Billions % of Total Funding Bank $ Billions % of Total Funding
Goldman Sachs $36.5 3.80% Goldman Sachs $8.0 0.61%
Bank of America $64.0 3.00% Bank of America $13.2 0.44%
JPMorgan $51.0 2.20% JPMorgan $23.8 0.65%
Citigroup $42.0 2.20% Citigroup $8.6 0.37%
Wells Fargo $17.5 1.30% Wells Fargo $7.2 0.37%
Table 6 demonstrates that the same is true for foreign banks as it is for U.S. banks. Foreign
banks rely on prime MMFs for less than 1% of their total funding and such reliance is down
substantially from 2012. U.S. and foreign banks have clearly further diversified their funding
sources.
Table 6: U.S. Prime MMF Funding of Large Foreign Banks 71
September 30, 2012 March 31, 2021
Bank $ Billions % of Total Funding Bank $ Billions % of Total Funding
Barclays $84.5 3.30% Barclays $19.0 1.03%
Credit Agricole $31.5 1.40% Credit Agricole $19.8 0.89%
Société Générale $31.0 1.90% Société Générale $16.8 0.93%
BNP Paribas $33.5 1.30% BNP Paribas $27.0 0.88%
HSBC $24.5 0.90% HSBC $4.1 0.14%
Prime MMFs provide an even smaller amount and share of total funding to non-financial
corporates than financial companies. As shown in Table 7, as of end Q1 2021, the non-financial
corporations that receive the largest dollar amount of funding from prime MMFs include Toyota
($1.9 billion) and Exxon Mobil ($1.6 billion). 72 However, each of these large non-financial
corporates issue large amounts of non-financial commercial paper. Toyota has $22 billion in
commercial paper outstanding, 73 and Exxon Mobil has $18 billion outstanding. 74 Thus, prime
MMFs hold less than 10% of their commercial paper. Furthermore, non-financial companies have
access to sources of short-term funding other than commercial paper. For example, Toyota has a
70
CRANE DATA, Money Market Fund Intelligence (2021), https://cranedata.com/subscribers/content/ [“Crane
Data”]; selected bank’s balance sheets available on their investor relations websites.
71
Crane Data, supra note 70; selected bank’s balance sheets available on their investor relations websites.
72
Crane Data, supra note 70.
73
TOYOTA MOTOR CORPORATION, Form 20-F, fiscal year ended March 21, 2020 (June 24, 2020),
https://s3.amazonaws.com/toyota-cms-media/toyota-pdfs/20-F_202003_final.pdf.
74
EXXONMOBIL, 2020 Annual Report (2020), https://corporate.exxonmobil.com/-/media/Global/Files/investor-
relations/annual-meeting-materials/annual-report-summaries/2020-Annual-Report.pdf.
16large unused short-term revolving line of credit of $17.5 billion75 and Exxon Mobil has the same
for $11.3 billion. 76
Table 7: U.S. Prime MMF Funding ofSelect Large Non-Financial Corporations 77
Company CP Outstanding ($B) Prime MMF Holdings ($B) % of CP Outstanding
Toyota $38.0 $1.9 5.00%
Exxon Mobil $17.3 $1.6 9.24%
Prime MMFs therefore only provide a very small share of total funding for large financial
institutions and non-financial companies. It is therefore highly unlikely that the loss of funding
from prime MMFs alone could cause the failure of large financial institutions or non-financial
companies. 78
Although prime MMFs play a limited role in directly funding large financial institutions,
it is still possible that a run on prime MMFs could act as a “spark” setting off a run in short-term
funding markets generally and that such a widespread run could pose systemic risk. However, as
illustrated by Figure 4 on the next page, prime MMFs were not the “spark” that set off contagion
in financial markets in 2020. Instead, the most significant problems in short-term funding markets
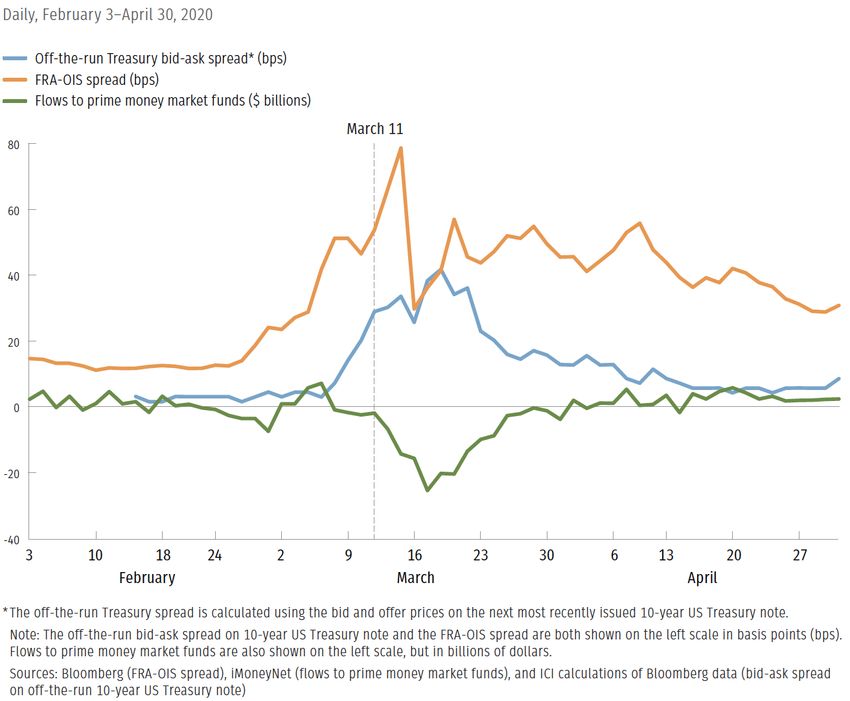
in 2020 occurred before there were withdrawals on prime MMFs. 79 Figure 4 below shows that the
FRA-OIS spread, which measures the cost of short-term funding for banks, increased before
withdrawals on prime MMFs began on March 11th. 80 Similarly, spreads on off-the-run Treasuries,
which measures liquidity in the Treasury markets that financial institutions rely on for short-term
funding through repurchase agreements, were also elevated before withdrawals on prime MMFs
began on March 11th. 81 Stress in these short-term funding markets actually declined shortly after
the run on prime MMFs began, likely due to large purchases of U.S. Treasuries by the Federal
Reserve.
75
TOYOTA MOTOR CORPORATION, Form 20-F, fiscal year ended March 21, 2020 (June 24, 2020),
https://s3.amazonaws.com/toyota-cms-media/toyota-pdfs/20-F_202003_final.pdf.
76
EXXONMOBIL, 2020 Annual Report (2020), https://corporate.exxonmobil.com/-/media/Global/Files/investor-
relations/annual-meeting-materials/annual-report-summaries/2020-Annual-Report.pdf.
77
Crane Data, supra note 70.
78
See Hal S. Scott, Connectedness and Contagion: Protecting the Financial System from Panics, Kindle Ed., THE
MIT PRESS, loc. 7491-7646 (2016).
79
ICI on MMFs during COVID, supra note 46, at 15.
80
Alex Harris, Why It Matters That the FRA-OIS Spread Is Widening, BLOOMBERG (March 9, 2020),
https://www.bloomberg.com/news/articles/2020-03-09/why-it-matters-that-the-fra-ois-spread-is-widening-
quicktake?sref=a6D9m9Mp/.
81
ICI on MMFs during COVID, supra note 46, at 15.
1782
Figure 4: Stresses in Short-Term Funding Markets Preceeded Prime MMF Outflows
Even if prime MMFs were not the “spark” that set off contagion in 2020, they could have
still contributed to the stress in short-term funding markets by liquidating assets, such as
repurchase agreements and commercial paper. However, Treasury markets stabilized on the week
of March 16th shortly after withdrawals on prime MMFs began, likely due to Federal Reserve
purchases of U.S. Treasuries. 83 Thus, there are no signs that the unwinding of Treasury repurchase
agreements by prime MMFs contributed to stress in short-term funding markets. On the other hand,
stresses in commercial paper markets were evident during and shortly after withdrawals on prime
MMFs were at their peak. And, as we noted earlier in this report, prime MMFs hold 22% of
outstanding commercial paper, 84 so large withdrawals from prime MMFs and attendant sales of
commercial paper could significantly exacerbate stress in commercial paper markets. However,
prime MMFs sold only $6.2 billion in commercial paper during the week of March 9th, representing
less than 20% of the $29 billion in commercial paper sold that week. 85 In our view, $6.2 billion in
sales of commercial paper by prime MMFs is unlikely to have been the primary cause of stresses
in commercial paper markets with approximately $1 trillion in commercial paper outstanding.
Although commercial paper markets are not the focus of this report, we note that enhancing the
secondary market structure for commercial paper would likely enhance the liquidity of commercial
paper markets during periods of market stress and warrants further examination. 86
82
ICI on MMFs during COVID, supra note 46, at 15.
83
https://www.capmktsreg.org/wp-content/uploads/2021/03/NBTF-US-Treasury-Markets-During-Covid.pdf
84
ICI Data, supra note 34; FEDERAL RESERVE SYSTEM, Financial Accounts of the United States - Z.1 (2021),
https://www.federalreserve.gov/releases/z1/default.htm.
85
INVESTMENT COMPANY INSTITUTE, Letter to the SEC re: Report of the President’s Working Group on Financial
Markets, 44 (April 12, 2021), https://www.sec.gov/comments/s7-01-21/s70121-8662926-235321.pdf.
86
See, e.g., BlackRock on MMFs, supra note 46, at 2.
18In conclusion, we find that individual financial institutions and non-financial companies
only rely on prime MMFs for a small amount of their funding and the loss of such funding is highly
unlikely to cause their insolvency. As to contagion risk, it is possible that a run on prime MMFs
could trigger a broader run in short-term funding markets, including commercial paper, however,
we find no evidence to support that prime MMFs posed such contagion risk in 2020.
19Part IV: Policy Recommendations
In 2020, prime MMFs experienced $139 billion in investor withdrawals and received $53
billion in liquidity support from the Federal Reserve. Clearly the post-2008 regulatory reforms to
prime MMFs failed to ensure that prime MMFs were sufficiently resilient against future crises.
We therefore strongly support reforms to prime MMFs that would enhance their resilience and
significantly reduce the likelihood of future government support. In Part IV of this report, we
assess policy recommendations focused on enhancing prime MMF liquidity, capital requirements
for prime MMFs and swing pricing. 87
However, certain policymakers, such as Boston Federal Reserve President Eric Rosengren,
have gone so far as to recommend abolishing prime MMFs altogether. 88 We do not believe that
the 2020 COVID crisis provides support for abolishing prime MMFs. As we demonstrated in Part
III, there is no evidence to support the view that prime MMFs acted as a trigger for contagion in
2020 nor that the loss of funding from prime MMFs would have threatened the solvency of large
financial institutions or non-financial companies. It is therefore unclear that Federal Reserve
lending to prime MMFs was necessary to protect the financial system in 2020. We believe that in
future crises the Fed should consider the limited role of prime MMFs in short-term funding markets
before establishing a lending program for prime MMFs, as such a program may not be necessary.
However, we cannot rule out the possibility that the Federal Reserve would create a new
lending program for MMFs in a future financial crisis. The only way to guarantee that such a
program would not be created is to abolish prime MMFs. Doing so, however, would not address
the root cause of the need for government liquidity—the risk of financial contagion. Contagion
involves the withdrawal of investors or depositors from providing short-term funding to the
financial system that is not government guaranteed. 89 In the face of uncertainty, depositors and
investors are incentivized to withdraw short-term funding and shift to cash or assets that are
government guaranteed. Such runnable liabilities include—uninsured bank deposits, repurchase
agreements, commercial paper, and securities lending in addition to prime MMFs. Figure 5 on the
next page demonstrates that prime MMFs constitute only 4% of such runnable liabilities. Thus,
eliminating prime MMFs would not eliminate the need for future government liquidity support
during a crisis.
87
We do not support expanding the floating NAV requirement from institutional prime MMFs to retail prime
MMFs. As noted in Part I of the report, the floating NAV requirement does not sufficiently discourage investors
from withdrawing from prime MMFs during a crisis.
88
in November 2020, Boston Fed President Eric Rosengren said that “my personal preference would be not to have
prime money market funds” because efforts to reform the sector were “not very successful.” Greg Robb, Prime
money-market funds on the regulatory hot seat, MORNINGSTAR (Nov. 16, 2020),
https://www.morningstar.com/news/marketwatch/20201116361/prime-money-market-funds-on-the-regulatory-hot-
seat; FEDERAL RESERVE BANK OF BOSTON, President Rosengren to speak about the economy and current financial
conditions (Nov. 10, 2020), https://www.bostonfed.org/news-and-events/events/presidents-
speeches/2020/1110b.aspx
89
Hal S. Scott, Connectedness and Contagion: Protecting the Financial System from Panics, Kindle Ed., THE MIT
PRESS, loc. 2528 (2016).
20You can also read