NATIONAL MINIMUM WAGE - LABOUR RESEARCH SERVICE
←
→
Page content transcription
If your browser does not render page correctly, please read the page content below

National Minimum Wage

               01
Copyright © International Labour Organization 2015
First published (2015)

Publications of the International Labour Office enjoy copyright under Protocol 2 of the Universal
Copyright Convention. Nevertheless, short excerpts from them may be reproduced without
authorization, on condition that the source is indicated. For rights of reproduction or translation,
application should be made to ILO Publications (Rights and Licensing), International Labour
Office, CH-1211 Geneva 22, Switzerland, or by email: rights@ilo.org. The International Labour
Office welcomes such applications.
Libraries, institutions and other users registered with a reproduction rights organization may
make copies in accordance with the licences issued to them for this purpose. Visit www.ifrro.org to
find the reproduction rights organization in your country.

Towards a South African National Minimum Wage

International Labour Office – Geneva: ILO, 2015

Wages/income distribution/national minimum wage/South Africa

978-92-2-129968-4 (print)
978-92-2-129969-1 (web pdf)

						                                                    ILO Cataloguing in Publication Data

The designations employed in ILO publications, which are in conformity with United Nations
practice, and the presentation of material therein do not imply the expression of any opinion
whatsoever on the part of the International Labour Office concerning the legal status of any
country, area or territory or of its authorities, or concerning the delimitation of its frontiers.
The responsibility for opinions expressed in signed articles, studies and other contributions rests
solely with their authors, and publication does not constitute an endorsement by the International
Labour Office of the opinions expressed in them.
Reference to names of firms and commercial products and processes does not imply their
endorsement by the International Labour Office, and any failure to mention a particular firm,
commercial product or process is not a sign of disapproval.
ILO publications and digital products can be obtained through major booksellers and digital
distribution platforms, or ordered directly from ilo@turpin-distribution.com. For more information,
visit our website: www.ilo.org/publns or contact ilopubs@ilo.org.

Printed in (South Africa)
Towards a South African
National Minimum Wage

 Acknowledgements:
 Labour Research Service would like to thank the following organisations and
 individuals for the production of this booklet:

 Author:            Eddie Cottle
 Contributor:       George Mthethwa
 Reviewers:         Trenton Elsley, Saliem Patel, Nina Benjamin and Michelle
                    Taal of LRS and Inviolata Chinyangarara of ILO,
                    Decent Work Team
 Copy Editor:       Margaret Farred
 Cover Design:      Donovan Ward
 Design and Layout: The Media Chilli
 Photographs:       Workers’ World Media Production
 Printer:           Fingerprint Co-operative Ltd
Towards a South African

                 The Aim of this Booklet
                 This booklet is an accessible educational resource for trade unions on
                 the important subject of a National Minimum Wage in South Africa.

                 The booklet provides an overview of the key issues and is intended
                 to assist trade unions to popularise democratic debates on a NMW
                 amongst workers, shop stewards and officials.

4
National Minimum Wage

Foreword
Productive employment and decent work are key elements to achieving a reduction in poverty.
The International Labour Organisation (ILO) has developed an agenda for putting the Decent
Work Agenda into practice through four strategic pillars, namely, employment, rights at work,
social protection and social dialogue, with gender equality as a cross-cutting objective.             Vic van Vuuren

The ILO notes in its Global Wage Report 2014/2015 that while the income of low-income groups
has been raised through direct employment programmes in South Africa, the most effective and
sustainable route out of poverty for the working-age population is a productive job that is fairly
paid. The report further notes that there has been a decline in real wages and a rise in inequality
because the income growth of the bottom poorest households stagnated in real terms, while that
of more affluent households continued to increase.

The ILO Africa is supportive of the decision of the South African government to investigate
the possibility of a National Minimum Wage (NMW) as one of the key mechanisms to reduce
income inequality.

The collaboration with Labour Research Service in Cape Town, South Africa to produce this booklet
is geared towards assisting the labour movement in its endeavour to achieve a minimum wage
system that contributes to poverty eradication and decent work.

Vic van Vuuren
Director: International Labour Organization (ILO)
Decent Work Team for Eastern and Southern Africa and ILO Country Office
for South Africa, Botswana, Lesotho, Namibia and Swaziland
Crestway Block C, 20 Hotel Street, Persequor Park, 0020, Pretoria
PO Box 11694, Hatfield, 0028
Tel: +27 (012) 818 8000
Fax: +27 (012) 818 8087
Website: http://www.ilo.org/pretoria

                                                                                                                   ii
Towards a South African

                 Towards a South African
                 National Minimum Wage
                 Contents:

                 1. Introduction ............................................................................................................. 01

                 2. What is a Minimum Wage? ..................................................................................... 03

                 3. The Goals of a National Minimum Wage Policy . ..................................................... 04

                 4. Arguments in Response to a National Minimum Wage .......................................... 09

                 5. The Structure of a National Minimum Wage (Universal or Sectoral System) . ......... 15

                 6. Criteria for fixing a National Minimum Wage ......................................................... 17

                 7. The Impact of a National Minimum Wage . ............................................................. 25

                 8. How to Campaign for a National Minimum Wage .................................................. 31

iii
06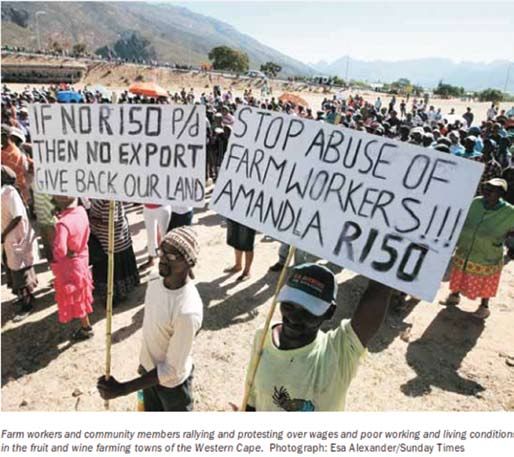
National Minimum Wage

Glossary of Terms
Average wage: this is the typical wage or salary paid to workers in an occupation or industry. The
average is calculated by adding up all the wages or salaries of people working in the position and
then dividing that sum by the number of people working in the position. The amount received is
the average salary.

Median wage: is the boundary between what the highest 50% of earners are paid and what the
lowest 50% of earners are paid. Thus if the median wage in South Africa is R3, 033 this means that
50% of workers are earning above the median and 50% are paid below.

Minimum wage: this is the lowest level of pay established through a minimum wage fixing
system which is guaranteed by law.

Median minimum wage: is the median of all the minimum wages in an occupation or an industry.

Living wage: it is the level of wages that allows workers to meet their own as well as dependents’
needs. Furthermore, a living wage must satisfy more than the basic survival in terms of food,
housing and clothing needs and also make provision for participation in a country’s social and
cultural life.

Poverty line: is a measure used to separate the poor and the not poor. Statistics South Africa calculates
the poverty line by determining the food and non-food items that are essential for daily survival.

Gini coefficient: is a measurement of the national income distribution of a country’s residents.
This number, which ranges between 0 and 1 and is based on residents’ net income, helps define
the gap between the rich and the poor, with 0 representing perfect equality and 1 representing
perfect inequality.

Gross operating profit: the profit of a company for the sale of goods and services after operational
expenses are deducted. Interest and taxes are not deducted.

                                                                                                                   iv
Towards a South African

                 Introduction

                 This booklet addresses the desirability of a general National Minimum Wage (NMW) in South
                 Africa. Over a period of several decades since the 1930s this matter has been subject to struggles
                 and representations, largely by the trade union movement, to the various governments of the
                 day. Most of these representations by the labour movement to government were made for
                 the introduction of a NMW system that would enforce a minimum wage across all industries
                 throughout the country.

                 As early as 1935 a Bill was prepared by the Department of Labour to establish an enforceable
                 NMW, but dropped after protests from employer organisations and in favour of amendments to
                 an existing 1925 Wage Act. There were several other reviews on the implementation of a NMW
                 in the 1940’s as a result of the labour market abnormalities created by World War II and further
                 again in 1961 and 1974 when the economy became stronger. By 1977 South African Congress
                 of Trade Unions (SACTU) called for a national minimum wage of R50 per week. This was after the
                 Durban strikes of 1973 and the Soweto uprisings of 1976 that the government felt pressured to
                 establish the Wiehahn Commission of Enquiry of 1977 in order to look at the industrial relations
                 system in South Africa and that a substantive investigation took place on the issue of a NMW.
                 The Commission stated that, “although there was a difference of opinion on the issue in the
                 commission itself, it came to a clear conclusion that a number of weighty considerations preclude
                 a recommendation that South Africa should introduce such legislation”. These were:

                 a). That such a policy would run counter to the government’s policy of encouraging and
                     promoting free collective bargaining at industry and company level.
                 b). That the introduction of a NMW would have a detrimental effect on the country’s high rate of
                     unemployment and job creation.
                 c). That the ILO prescribed a careful approach which took into consideration certain economic
                     factors in determining minimum wages.

                 The above factors, as we shall demonstrate later, would be critical in determining future policy in
                 South Africa. Building on the Wiehahn Commission, against the backdrop of rising trade union
                 militancy of the 1980s, the National Manpower Commission Report of 1983 on “The Principle
                 and Application of a National Minimum Wage” concluded that, “in a developing community
                 such as that in South Africa there was certainly room for a partial system of statutory
                 minimum wage determination, [but] it could not find justification for either a general
                 National Minimum Wage or a regional minimum wage system”. The commission was convinced
                 that production and employment growth would slow down, and in particular, that
                 the development pattern would become less labour intensive. Furthermore, a NMW could not be

01
National Minimum Wage

extended to certain sectors such as agriculture as South Africa had a dual economy consisting of
a technologically advanced economy existing side by side with an underdeveloped economy. The
specific development of an economy, it argued, is therefore very important when developing a
policy on a NMW.

Despite the conclusions of the National Manpower Commission, COSATU, at its Inaugural
Congress in 1985, called for “a legally enforced national minimum living wage”. And while the
Freedom Charter of 1955 called for a “national minimum wage” it was only in the African National
Congress’ (ANC) 2014 Election Manifesto that the party decided under pressure from COSATU to
include an investigation into the introduction of a national minimum wage.

In the President’s State of the Nation Address in July 2014 he spoke of the need to explore
minimum wages in the context of the triple challenges of unemployment, poverty and inequality.
He went further in stating that:

     Given the impact of the untenable labour relations environment on the economy, it is
     critical for social partners to meet and deliberate on the violent nature and duration of
     the strikes. The social partners will also need to deliberate on wage inequality. On our
     side as Government we will during this term investigate the possibility of a [national
     minimum wage] as one of the key mechanisms to reduce the income inequality.
     Deputy President Cyril Ramaphosa will convene the social partners’ dialogue, within
     the ambit of NEDLAC.

At a Labour Relations Indaba in November 2014 a committee, which included 6 cabinet ministers
and representatives of labour and business, was appointed to develop an agreement and report
back by July 2015.

A NMW is a necessary and powerful weapon the trade union movement
can use in the struggle against poverty and the low wage system inherited
from apartheid.

The long-term aim of a minimum wage is to remove the problem of poverty pay, which exists
when the earnings from paid work do not result in a living minimum wage and fail to push people
out of poverty.

                                                                                                            02
Towards a South African

                 What is a Minimum Wage?

                 ILO legal experts have defined the minimum wage as: “the minimum sum payable to a worker
                 for work performed or services rendered, within a given period (…) which may not be reduced
                 either by individual or collective agreement (and) which is guaranteed by law”. According to ILO
                 Convention No. 131 the primary purpose of such a minimum wage is to provide protection for
                 wage earners against “unduly low wages”. In other words, a minimum wage aims to set a
                 floor to the distribution of wages, below which no worker can legally be paid.

                                   I WANT TO
                                   LIVE NOT
                                  JUST EXIST

03
National Minimum Wage
The Goals of Minimum
Wage Policy
The primary goal of any minimum wage policy is to increase the incomes of those at the very
bottom of the wage scale through a distribution of national income. Low wages are a prime
contributor to poverty and misery for large sections of the working class – thus the reference to
poverty wages in the labour movement. The policy tries to ensure that every worker is paid at a
level of income that enables him or her to maintain a minimum living standard above the bare
subsistence level that employers are keen to maintain. A NMW is thus generally seen as a way to
dealing with poverty which the capitalist system is unable to deal with, as a primary national goal,
on its own.
A NMW policy will also deal with income inequality as wages and salaries are the main components
of income. Wage compression will reduce the gap between those at the top and bottom of the
wage scale as it will lift the wage of those at the very bottom.
For government it is hoped that a NMW will lead to a reduction in industrial unrest. Government in
particular was concerned about the Association of Mineworkers and Construction Union (AMCU)
led 5 month long platinum strike which was the longest and most costly strike in South African
history and also the month long strike by the National Union of Metalworkers of South Africa
(NUMSA) in 2014. In particular there appears to be an upward trend in both the number of strikes
(doubling after the 2008 financial crisis) which reached 114 by 2013, indicating a new upward
trend in worker militancy.
While organised business has been largely quiet about a NMW they are having intense discussions
behind the scenes. Business will not come out publically against less inequality and poverty, but
against a national minimum wage that they claim will exacerbate unemployment.
For the labour movement the increased wages due to the implementation of a NMW will expand
demand for more goods and services and thus jobs will be created as the economy expands.
In many ways, for the supporters of a NMW policy the goal is that it must contribute to overcoming
the triple challenges of unemployment, poverty and inequality. A NMW is however, just one
policy measure to take workers out of poverty; one other is the social wage bill of government.
Let’s now examine the extent of the triple challenge in South Africa.
04Towards a South African
Poverty
Statistics South Africa published a set of three national poverty lines for individuals in 2014:
* The upper-bound poverty line
* The lower-bound poverty line
* The food poverty line
Source: http://mg.co.za/data/2015-02-05-infographic-poverty-in-south-africa
In 2006, more than half (57.2%) of the population of South Africa were living in poverty. By 2011,
less than half (45.5%) of all South Africans were living below the poverty line which reflects a 20%
reduction in poverty from 2006 to 2011. However, the revised calculations of poverty estimates
overall poverty increased from 45.5% in 2011 to 53.8% in 2014. This means that 27 million
people live in poverty.
05National Minimum Wage
Source: http://mg.co.za/data/2015-02-05-infographic-poverty-in-south-africa
However, the drop since 2006 in poverty levels is largely due to social wages in South Africa.
This includes free primary health care; no-fee paying schools; social grants (most notably old-
age pensions and child support grants); RDP housing; and the provision of basic services to
households, namely water, electricity and sanitation. In 1998, 2.5m people received grants. By
the end of 2012/2013, nearly 16.1m people were beneficiaries. Close to 60% of government
spending is allocated to the social wage.
According to the World Bank, social grant programmes typically represent 1-2% of GDP in
developing countries. In SA, the ratio has remained 3.4% since 2009/2010, in line with average
welfare spending in advanced countries.
Unemployment
The largest concern with regard to the NMW is the issue of unemployment. According to the World
Economic Forum’s Global Risk 2014 Report, South Africa has the third highest unemployment
rate in the world for people between the ages of 15 to 24 and estimates that more than 50% of
young South Africans between 15 and 24 are unemployed.
Recent statistics released by Stats SA (2015) show that joblessness in South Africa has reached its
highest level since 2008, and is currently at a rate of 24.3%. The number of unemployed persons
increased to 4.9 million. Taking into account the expanded definition, which includes people who
have given up looking for jobs, unemployment has risen to 7.3million (36%).
06Towards a South African
The Labour Force in South Africa 2014
Labour Force
20.2 million
Formal sector (non-agricultural)
10. 9 million
Informal sector (non-agricultural)
2. 5 million
Agriculture
742 000
Private households
1 million
Unemployed
4. 9 million
Unemployment Rate
24.3%
Expanded Unemployment
7. 3 million
Expanded Unemployment Rate
36%
Source: Stats SA, Labour Market Dynamics in South Africa, 2014
The gain in employment in 2014 by occupational categories was mainly in skilled jobs due to
a rise in Sales (468 000), Managerial (234 000) and Clerical (110 000) occupations. White and
Indian/Asian populations are more dominant in skilled occupations compared to the black African
and coloured population groups. Proportions of employed black African and coloured populations
are the largest among low-skilled occupations for both men and women. However, black African
women remained vulnerable – about 42% were employed in low-skilled occupations compared
to only 1.3% of white women and 2.1% of Indian/Asian women.
07National Minimum Wage
Inequality
The post-1994 period in the South African economy is characterised, perhaps most powerfully, by
the fact that the economy recorded one of its longest periods of positive economic growth in the
country’s history. From 1993 until 2013, South Africa’s GDP growth rate averaged 3.2 % reaching
an all-time high of 7.6 % in 1996. Until the last quarter in 2008 South Africa had seventeen years
of positive economic growth.
Despite this positive economic growth, the country has the most unequal income
distribution in the world with a Gini coefficient of 0.69 in 2013, an increase from 0.64 in 1995
just one year after apartheid officially ended. South Africa’s Gini coefficient was also much higher
than countries such as Brazil at 0.54, India at 0.33, China at 0.47 and Russia at 0.42, a country
deemed to be on a high level of human development by the UN.
Figure 1: Wage Share of GDP in South Africa 1993-2010
60%
58%
56%
54%
52%
50 %
48%
46%
44%
42%
40%
1993 1994 1995 1996 1997 1998 1999 2000 2001 2002 2003 2004 2005 2006 2007 2008 2009 2010
Whole Economy Private Business Sector
Source: AIDC (2014)
Figure 1 shows that the labour share of GDP compared to profit dropped over an 18 year period
from 57% to 51% between 1993 and 2012. In other words, less of the total wealth
generated through economic growth is going to workers and more is going
the upper classes.
Furthermore, a Labour Research Service study on the wage gap of some 90 listed companies
shows that there was on average a 40 year wage gap between directors and workers in 1994. The
wage gap in 2014 has increased to an average of 200 years between directors and workers.
South African Census 2011 showed while the income of black households had increased by nearly
170% in the last decade, they still earned the least. The income of white South African households
is six times higher than black ones. The average annual income for blacks is R60, 613 while for
their white counterparts it is R365, 134.
08Towards a South African
Arguments in Response to a
National Minimum Wage
Arguments for and against a national minimum wage are usually based on economics. But
economics itself is also a reflection of class interests and thus we find that the bosses, political
parties and governments, conservative academics and even certain trade unions oppose the
introduction of a NMW. Even where there is agreement to fix a national minimum wage some (like
the government and business) want to maintain a low wage economy. Thus in most circumstances
it is often those in well off positions who earn high incomes who are opposed to a NMW and are
resistant to accept such measures that redistribute national income. Thus supporters of a NMW
argue that for every worker and their family to be able to maintain a certain “minimum living
standard” there has to be state intervention as the free market is not only resistant but also cannot
achieve these broader national goals. When trade unions normally oppose a national minimum
wage they do so because they believe it would undermine collective bargaining or that it may
increase unemployment.
There are three major arguments for and against a NMW. There are issues relating to inflation,
unemployment and investment.
Arguments Against a National
Minimum Wage
Probably the most common argument against a NMW made by employers and some trade unions is
that it will have a negative effect on employment levels which could happen in the following ways:
JOB
Effect on Unemployment
WANTED
a). If wage costs are unreasonably increased employers will be forced to reduce the number of
workers employed.
b). Employers will make more productive use of labour because of higher labour costs and thus
require fewer workers.
c). Employers adopt more capital intensive production and thus replace semi-skilled and
unskilled workers with machinery especially in traditional labour intensive industries.
d). Employers may also increase their reliance on more part-time and casualised work and
reduce the number of hours of work leading to a drop in the wage bill.
09National Minimum Wage
Effect on Inflation
a). By increasing wages of lower paid workers employers will merely follow with an increase in
prices of goods and services leading to higher inflation.
b). Due to the higher cost structure that is introduced with a NMW on the final products, these
increases will be passed onto the consumers, thus creating an inflationary effect.
c). There will be an increase in the cost structure of goods and thus exports will be uncompetitive
in the global market and may well decline. There will be an overall negative effect on the
export sectors of the economy especially in agriculture, textiles and mining.
d). The increased inflation will force employers to reduce the other possible services provided to
workers including housing, transport, water and electricity (the so-called social wage), which
are not fully factored into the wage bill. This problem is particularly important in the agricultural
and mining sectors.
Productivity
a). Increases in the real value of a NMW will affect the price of labour and thus levels of
productivity. A NMW will artificially set the price of labour above its value thus lowering levels
of productivity.
b). Decent work for the few was achieved through rising capital intensity and job destruction.
This is tragic for the millions of unskilled, unemployed South Africans whose only hope of
regular employment is a more labour-intensive growth path.
Effect on Investment and Economic Growth
a). There will be a decline in the real demand for goods and services resulting from higher
prices after a NMW that has been fixed too high. There will therefore be a negative effect
on employment as fewer profits will be available for reinvestment and expansion of
businesses.
b). The higher cost structure is likely to lead to reduced investment by companies both locally
and internationally and will thus have a negative effect on economic growth.
c). The higher cost structure may lead to a reduced and less successful export sector which may
conflict with the trade and exchange rates policy of government.
d). The setting of a NMW does not take into account the present and expected profit of a
company or an industry and may result in the bankruptcy of some firms. There will thus be
an increased bankruptcy rate of businesses especially smaller business as a result of the
higher labour cost.
e). Industries that rely heavily on semi-skilled and unskilled labour or labour intensive industries
may experience a decline in growth and hamper the economy’s ability to create employment.
f). Potential new firms do not open businesses because of poor profit expectations.
10Towards a South African
Arguments in Support of a National
Minimum Wage
Inflation
Employers argue that the introduction of a NMW would rapidly increase inflation. But we know
that workers do not control prices of commodities, the bosses do and they often increase the
prices regardless of costs and consideration for inflation through cartels. A cartel is a collection
of businesses that act together and agree to influence prices for certain goods and services by
controlling production, marketing and pricing thus nullifying free competition. In general, firms
engage in cartel activities to maximise the joint profits of cartel members. We recall here the
recent activities of the national food companies, Pioneer, Premier and Tiger Brands, that fixed the
selling price of bread - they all contravened the Competition Act. They caused harm to consumers
in the form of higher prices, less choice and inferior services. Bread market supplies a staple food
to millions of South Africans and any increases in prices would have a disproportionate impact on
the poor and the working class. Thus when we consider inflation we cannot only look at wages.
In countries where a NMW has been implemented it generally added less than 1% to inflation but
real inflationary effects can be neutralised by the following factors:
a). Wages forms only one small part of the unit cost of production and employers can reduce the
non-wage input costs. The overall unit percentage increase will be lower than the percentage
increase in costs of wages.
b). Increases in cost can also be borne by lower returns on profit by shareholders resulting in an
increase in the wage share.
c). The macro-economic consequences of an increase in disposable income of the
low paid might actually reduce average costs as production runs increase to meet higher
demand. There is thus no need to pass on costs to the consumer.
Productivity
a). Many employers underpay workers despite improvements in productivity and profit thus
maintaining the cheap labour system inherited from apartheid.
b). Low wages permit inefficient companies to remain in business and low pay effectively serves
to subsidise inefficiency and incompetence of employers.
c). When labour costs increase employers will use labour more efficiently, provide training and
improve management and production methods for producing goods and services. In the
process companies will have higher productivity and so recover the additional wage costs
without increasing the price of goods and services or reducing the profit margin.
11National Minimum Wage
d). The minimum wage should not raise total costs if companies improve management and
production methods.
e). There will be a decrease in industrial disputes and an improvement in workers’ morale and
living standards which will improve the workers’ capacity to work and ensure a reduction
in debilitating disease and time off due to illness and accidents caused by fatigue. Low
productivity is thus a direct consequence of low pay.
Unemployment JOB
WANTED
a). Those who argue that unemployment must take precedence over poverty wages until
unemployment is substantially reduced base this upon a false assumption that poverty
wages reduce unemployment. The persistently high average rate of 25%
unemployment since the days of Apartheid testifies that poverty wages
do not save workers from retrenchment.
b). The main flaw in the argument is that labour is treated as a cost like all other costs of production.
But labour is unique in that it is also at the time a buyer of goods and services. When wages
are low workers cannot buy the outputs of production and workers get retrenched. In this
case low pay is the cause of unemployment.
c). The increased productivity arising from a NMW will increase the buying power of workers
and expand markets thus increasing employment in the economy as a whole.
Investment and Economic Growth
It is argued that if a NMW entails redistribution from the owners of capital to the low paid workers
then savings and investment in the economy would decline. For one it is true that workers will
likely spend their new higher incomes rather than save it.
In post-Apartheid South Africa there has been massive redistribution of wealth towards capital
and the profit rate in the non-financial corporate sector more than doubled between 1994 and
2012 to 13.5%. For the large firms listed on the Johannesburg Stock Exchange (JSE), business
has been particularly good. A 2013 Credit-Suisse study compared these companies to more than
30 000 competitors and found them to be amongst the most profitable anywhere in the world.
Returns for shareholders have been consistently high, averaged 18.4% p.a. over the 10 years up
to 2013. However, the track record of the rich in South Africa shows that they are not inclined to
either save or invest their profits in the local economy.
12Towards a South African
Figure 2: Investment as a Percentage of GDP 1973 – 2013
0.35
0.3
0.25
0.2
0.15
0.1
0.05
0
1973 1975 1977 1979 1981 1983 1985 1987 1989 1991 1993 1995 1997 1999 2001 2003 2005 2007 2009 2011 2013
Total General government Public corporations Private business enterprises
Source: Nail Reddy (2014)
As we can see above, investment in South Africa over the last four decades averaged just 15.6% of
GDP for 1994 to 2003 and 19.2% between 2004 and 2013 compared to 26.4% in the 1970s. These
rates are far below those commonly agreed to be a precondition of rapid growth. Investment, of
course, is the precondition for high growth and employment creation. This low investment rates
occur despite the maintenance of a cheap labour system in South Africa. Most of the wealth of the
rich has been transferred overseas and much of it has been spent on the consumption of luxury
imported goods. On the other hand workers spend most of their income on basic goods which
have very low import content.
The core economic logic of the old system was the cheapening of the price of labour. As many early
Marxist scholars pointed out, this functioned by making workers partly reliant on the subsistence
economies in Bantustans and rural areas, allowing employers to get away with paying extremely
low wages. The current macro-economic strategy perpetuates the legacy of Apartheid South Africa
which suffers from a weak internal market.
Instead, those who do not support a NMW or at least a ‘living national minimum wage’ tend to
confine the debate to a single dimension of higher wages causing unemployment by causing
lower profits and thus a lack of investment. They base their views on the low wage growth path
inherited from apartheid and perpetuated by the African National Congress (ANC) government.
One of the most striking critiques levelled against the government’s macro-economic strategy,
the National Development Plan is that it plans to create 11 million precarious and low paid jobs
in the Small Medium and Micro-sized Enterprises (SMMEs) - outside the core productive sectors
of the economy.
13National Minimum Wage
It is further argued that the SMME sector would not be able to afford the higher wages imposed by
a NMW and thus most of the un-skilled and semi-skilled workers employed in this sector would
be retrenched. The key question is should workers who find themselves in poverty continue
to subsidise unproductive business enterprises with low pay? Low pay reduces the loss of
unprofitable firms and permits them to stay in business longer. Workers are thus subsidising
their employers by accepting low wages. Furthermore, the tax payer also provides subsidies
to unproductive companies through the youth wage subsidy of the government. Should we
continue to subsidise unproductive companies that rely on the maintenance of a cheap labour
system (including through subsidies) or should they be allowed to go out of business?
14Towards a South African
The Structure of a
National Minimum Wage
South Africa does not have a national minimum wage. Unlike many other countries, the minimum
wage in South Africa is different for each sector. The Basic Conditions of Employment Act (BCEA),
allows the Minister of Labour to set minimum wages for sectors and areas of the economy
considered to be vulnerable. Minimum wages are set as part of overall conditions of employment
in identified sectors. These conditions are published in legislation called sectoral determinations.
The body responsible for guiding state legislation on the various sectoral determinations is
the Employment Conditions Commission (ECC). The ECC is a representative body within the
Department of Labour (DoL) established to advise the Minister of Labour on appropriate and
feasible sectoral wage schedules.
Sectoral minimum wages were first introduced in South Africa in the post-Apartheid period in
1999 in the Contract Cleaning sector, followed by sectoral minima for the Civil Engineering and
Private Security sectors in 2001.
Department of Labour: Sectoral and Ministerial Determinations
• Domestic workers
• Wholesale and retail
• Farm workers
• Forestry
• Hospitality
• Taxi
• Contract cleaning
• Private security sector
Expanded Public Works Programme*
*Ministerial determination
15National Minimum Wage
How Does a Minimum Wage Work?
Industrial relations in South Africa have always entailed that employers and unions negotiate and
agree on minimum wages and conditions of employment in a given sector. A national minimum
wage would not replace these arrangements, but would set a floor below which they cannot
go. The minimum wage refers to the lowest wage an employer can legally pay an employee. It
protects the most vulnerable employees from excessive wage exploitation by establishing a wage
higher than what the market would otherwise establish. Parliament would pass a minimum wage
through legislation and everybody would have to pay at least that. Unions and employers would
still engage in collective bargaining, and the ECC would still recommend minimum conditions
of employment, but none of this could be lower than the national minimum. In other words,
all other forms of collective bargaining or determination can be set equal to a NMW or higher
towards the achievement of a living wage.
Universal Coverage versus Sector Specific
Minimum Wages
The first decision for policy makers and trade unions to make is whether there shall be one
minimum wage applicable to all workers or whether there can be exemptions for certain sectors.
There are several countries where all workers are covered on a national level and in other countries,
certain categories of workers are exempted completely or a different wage rate is fixed for them.
The main consideration here is the distinction between tradable and non-tradable sectors. The
non-tradable sectors (such as private security, domestic work, retail and restaurants) do not face
competition from imports.
Agriculture is a good example of a tradable sector that exports fruit, flowers, wine, meat and wool
and requires special treatment as it is export oriented and prone to international competition and
trade agreements. The effects of fixing the minimum wage too high could lead to considerable
retrenchment of farm workers. It may thus be strategic to think about setting a NMW at the level
of the better paying farmers so that all workers can be included in a single NMW.
The other concern when developing a universal NMW system is geographical as living costs vary
enormously from one region to the other. Noting all the various considerations and judgments
that have to be made, it is advantageous to have a universal NMW as it will be administratively
simple and would ease enforcement. Since all workers and employers would more readily know
what the NMW is, the more difficult it would be for non-compliance.
16Towards a South African
Criteria for Fixing Minimum
Wage Determination
The primary goal of a NMW is to protect the most vulnerable section of workers from gross
exploitation. The ILO developed six criteria, to be taken into account in determining the level of
minimum wages, namely:
1. The needs of workers and their families
2. The general level of wages in the country
3. The cost of living and changes therein
4. Social security benefits
5. The relative living standards of other social groups and
6. Economic factors, including the requirements for economic development, levels of
productivity and the level of employment.
We have dealt with elements of the criteria in previous sections and will only focus here on
addressing points 1, 2 and 5.
The most common reference for setting a minimum wage is the needs of the worker. According
to the ILO, a minimum wage should be able “to cover the minimum needs of the worker and
his or her family”. What those needs are is often disputed. For employers, basic needs refer to
a subsistence/ minimum wage where workers and their families can physically reproduce
themselves at a meagre standard. This is why the labour movement has preferred to use the term,
a “national minimum living wage” to signify a wage that takes workers out of poverty and closer
to a living wage.
However, determining a NMW is fraught with methodological difficulties as experts tend not to
agree how to calculate the needs of a worker and the household. Thus there are various ways to
benchmark where a NMW should be fixed. The poverty line translates into an average household
income of R2, 648.6 i.e. R779 multiplied by the average household size of 3.4 people in 2014.
Should we use the upper-bound poverty line to fix the minimum wage? Clearly this does not take
workers out of poverty.
The other benchmark is to look at median earnings. Statistics South Africa reported that while
median earnings increased from R2, 900 in 2010 to R3, 033 in 2013 and remained the same
at R3, 033 in 2014. As we can see the median wage is not far off from the poverty line for a
household of R2, 648 per month.
17National Minimum Wage
Table 1: Monthly Earnings of Employees, 2010 & 2014
Number of Bottom Bottom Bottom Top Top
employees 5% 10% 25% Median 25% 10% Top 5%
2010 11 638 600 866 1500 2900 6900 12885 17106
RANDS
2014 11 692 500 700 1574 3033 8000 17000 24000
Source: Stats SA, Labour Market Dynamics 2014
Between 2010 and 2014, the monthly median earnings for men increased from R3, 200 to R3, 500,
while those of women increased by R200 (from R2, 400 to R2, 600). There is thus a huge gender wage
gap of R900 per month. A NMW for all workers would thus greatly assist in terms of reducing the
gender wage gap especially at the lower end of the labour market where most women find themselves
in vulnerable employment.
According to Table 1, in 2010, the top 5% earned almost 30 times more than the bottom 5% of
employees, and by 2014, this had increased to almost 50 times.
In 2014, the bottom 25% (2. 9 million) of workers earned below R1, 574 per month and 50% (5.8
million of an 11.7 million workforce) of workers earned below the median wage of R3, 033 per
month. Whereas the top 25% of workers (or 2.9 million) earned up to R8, 000 per month, the top
5% (585 000) of workers earned up to R24, 000 per month.
Will work
for a national
minimum
living wage
18Towards a South African
Figure 3: Median Monthly Earnings per Racial Group 2010-2014
12 000
10 000
8 000
Rand 6 000
4 000
2 000
-
2010 2011 2012 2013 2014
Black African 2 200 2 491 2 600 2 600 2 800
Coloured 2 600 3 000 3 250 3 000 3 033
Indian/Asian 6 700 7 000 7 000 7 000 6 000
White 9 850 10 000 10 006 10 500 10 000
Total 2 900 3 000 3 115 3 033 3 033
Source: Stats SA, Labour Markets Dynamics 2014
In 2010 the monthly median earnings (figure 3) of the white population was R9, 850 and reached
R10, 000 per month in 2014. Moreover, the median earnings of this population group were more
than three times those of the black African (R2, 800) population group. The median earnings of
Indians/Asians (R7, 000) remained unchanged over the period 2011–2013, but declined by R1, 000
in 2014 to R6, 000. We can thus clearly see that the so called coloured (R3, 033) and black African
median earning are poverty wages.
Table 2 indicates the monthly median earnings per economic sector. Median earnings of
employees in Utilities were the highest for two consecutive years (2013–2014) and the lowest
for Private households over the period 2010–2014. In 2014, the monthly median earnings were
higher for employees employed in Utilities (R7, 000), Mining (R7, 000) and Services (R5, 000)
and lowest for employees engaged in Private household activities (R1, 400). The highest increase
in the monthly median earnings over the period 2010–2014 was observed in the Mining (R2,
000) and Utilities (R1, 000) sectors. Median earnings in Services declined by R1, 000.
19National Minimum Wage
Table 2: Median Earnings per Economic Sector per month
2010 2011 2012 2013 2014
Rand
Agriculture 1 295 1 300 1 495 1 733 2 153
Mining 5 000 5 800 6 000 6 000 7 000
Manufacturing 3 250 3 500 3 500 3 672 3 900
Utilities 6 000 6 000 6 000 8 666 7 000
Construction 2 437 2 600 2 600 2 800 2 816
Trade 2 505 2 800 3 000 3 000 3 033
Transport 3 500 3 600 3 800 3 900 4 000
Finance 3 501 4 333 4 000 4 000 4 000
Services 6 000 6 000 6 500 6 000 5 000
Private
Households 1 000 1 200 1 200 1 300 1 400
Total 2 900 3 000 3 115 3 033 3 033
Source: Stats SA, Labour Market Dynamics 2014
A different method of determining a benchmark for a NMW is to look at the Labour Research
Service’s Actual Wage Rates Database, which collects information of minimum wages of actual
collective bargaining agreements representing 392 collective agreements representing over
2.2 million workers and 9 sectoral determinations representing 4.5 million workers. LRS uses
minimum wages per industry to calculate the median minimum wages of the lowest paid
workers.
Table 3: Bargaining Levels and Worker Coverage 2014
Bargaining Units Sample Estimated Coverage
All Industries 392 2196 022
Enterprise CBA 341 309 705
Bargaining Council 51 1 886 317
Sectoral Determination 9 4 549 657
Source: LRS Actual Wage Rates Database, Ministry of Labour, Industry Reports, LRS’ Calculations.
20Towards a South African
Figure 4 indicates the median minimum wage per industry in 2014 with the exception of
agriculture which only has one minimum wage which is R2, 420 per month.1 The highest median
minimum wage is in the electricity industry at R6, 021 per month.
Figure 4: Median Minimum Wage per Industry 2014
5512 6021
4756
4365
3140 3603
2917 3001
2420
Agriculture
Construction
Finance
Wholesale & Retail Trade
Manufacturing
Transport
Community
Mining
Electricity
Source: LRS, Actual Wage Rates Database
Figure 5 indicates that the lowest median minimum wage according to sectoral determination is
in the domestic sectoral determination at R1, 631 per month and the highest median minimum
wage at R3, 037 per month is contained in the private security industry sectoral determination.
An important point to note is that government’s Expanded Public Works Programme (EPWP)
employs workers in the most vulnerable conditions where women are more likely to participate
in these programmes, with the share of women among those who participated increasing from
59.3% in 2011 to 63.1% in 2014. The wage of workers in the EPWP where there is only one
minimum wage has one of the lowest minimum wages paid (R1, 819) per month, just higher
than domestic workers.
1. Due to challenges in the collection of collective agreements for agricultural workers, they have been
omitted.
21National Minimum Wage
Figure 5: Minimum Median Wage for Sectoral Determinations 2014
Private Security 3037
Contact Cleaning 2810
Hospitality 2749
Retail Trade 2457
Farm workers 2420
Forestry 2420
Taxi 2274
Public Works Programmes 1819
Domestic Workers 1631
0 500 1000 1500 2000 2500 3000 3500
Source: LRS, Actual Wage Rates Database
Figure 6 indicates the median minimum wage by bargaining level. LRS data shows a median
minimum wage for sectoral determinations at R2, 420 and all industries at R3, 600 per month.
It further shows that workers who bargain at enterprise level scored higher median minimum
wages (R4, 077 per month) than workers at bargaining council level (R3, 300 per month).
Figure 6: Median Minimum Wages by Bargaining Level 2014
4500 4077
4000 3600
3500 3300
3000
2420
2500
2000
1500
1000
500
0
Sectoral Determination Bargaining Council All Industries Enterprise CBA
Source: LRS, Actual Wage Rates Database
Having looked at poverty levels and two sets of data (Statistics South Africa and Labour Research
Service) on median earnings for workers in South Africa we can now consider a benchmark to fix
a NMW.
22Towards a South African
At What Level Do We Fix the NMW?
Our main consideration should be the poverty line of R2, 648 per month for a household as the
primary goal of any minimum wage policy is to increase the incomes of those at the very bottom
of the wage scale and in so doing lift them out of poverty. Our concern therefore when fixing a
NMW is to fight poverty wages. We should also consider that the majority of workers’ incomes are
being determined by the employer and only 31% (3.6 million workers) by collective bargaining
arrangements. The vast majority of workers (69% or 8 million workers) of the 11.7 million (formal
sector) workers in total are not directly covered by any form of collective bargaining.
The NMW must therefore, by its very nature, be universal so that it is able to assist the lowest paid
in the workforce who is currently earning around R2, 648 per month or less and who is living in
poverty regardless of the economic sector or industry.
In many countries the NMW is set using the figure of 35 - 45% of the national average wage
or 40 - 60% of the median wage. According to Statistics South Africa, Quarterly Employment
Statistics (QES), the average monthly income for the formal non-agricultural sector was R16, 470
in November 2014. In South Africa, the average minimum wage based on the average wage
level would therefore be somewhere between R5, 766 and R7, 412. If the minimum wage would
be based as 50 - 60% of the median wage of R3, 033, it would result in a wage of R1, 517 - R1,
820. Clearly, using the average and median wage as the rate to fix a NMW would either be too
high (as it almost exceeds the highest minimum for all industries) or too low (since it’s below the
poverty line) and would leave workers in the poverty trap. Even using the national median wage
of R3, 033 is clearly too close to the poverty level of R2, 648 per month. Another suggestion could
be to fix the NMW in relation to the LRS median minimum wage amount of R3, 600 per month
for all industries.
There is much concern as outlined earlier that a high NMW may increase unemployment and
that there is a difference between conditions for economic sectors involved in the export sector
and those that essentially serve the domestic market. A NMW that is fixed too high might lead to
considerable retrenchments in the agricultural sector. In the famous 2012 farm workers revolt in
the Western Cape farm workers demanded a minimum wage of R3, 000 and on the other hand
the Marikana striking workers demanded a living wage of R12, 500. What is important is that
workers themselves have their own perception of what their needs are for a minimum wage and
a living wage regardless of what experts might determine.
In broader terms the figure of R3, 000 in 2012 was what farm workers felt would take them out of
a poverty wage and a minimum wage they could live on. Would it therefore be feasible to use the
LRS median minimum wage for all industries as a benchmark of R3, 600 to fix a NMW in 2015 or
is it still too close to the poverty level?
Finally, we cannot set a benchmark for the NMW without first examining the most important
benchmark for workers - that of a living wage which should be based upon any working class
23National Minimum Wage
family being able to afford a low cost house – a housing-based living wage. According to LRS a
housing-based living wage is premised on important assumptions, namely:
1. That housing is the largest item for expenditure in household income and
2. That a living wage can be derived from the monthly cost of housing if this is set at a
particular percentage of total income.
According to the banking industry a household should look at spending no more than a third
(33.33%) of its monthly income (after tax and deductions) towards monthly bond repayments. The
First National Bank’s property barometer for former “township” markets indicates that the average
house price is R323, 000 in 2015. Using the bank’s bond calculator we have a monthly bond cost
of R3, 067 per month and a qualifying minimum gross income of R10, 224 per month. We have
thus derived at calculating a housing-based living wage of R10, 224 per month for 2015.
It thus appears that in order to take workers out of the poverty wage system inherited from apartheid
the NMW would have to be located somewhere between the all industries median minimum
wage of R3, 600 and the housing-based living wage of R10, 224. An important consideration is
that the fixing of a NMW should not be set too high so that it is confused with a living wage.
Figure 7: Comparison of Various Median Minimum Wages and Living Wages
14000
12000
10000 12500
8000 10224
6000 6021
4000 4365 4756 5512
2749 2810 3037 2917 3001 3140 3600 3603
2000 1631 1819 2274 2420 2420 2457
0
Domestic Workers
Public Works Programme
Taxi
Forestry
Farm Workers
Retail Trade
Hospitality
Contract Cleaning
Private Security
Construction
Finance
Wholesale & Retail Trade
All Industries
Manufacturing
Transport
Community
Mining
Electricity
Housing-based living wage
Marikana living wage
Source: LRS AWARD, Author’s Calculations
Looking at Figure 7, we now have a clearer picture of the various minimum wages in all industries
and living wage benchmarks. If the all industries median wage of R3, 600 is accepted then workers
covered by sectoral determinations (from domestic workers to private security) and workers in
construction, finance and wholesale and retail then about 7 million workers will benefit out of the
11.7 million formal sector workers in South Africa. The extent of the coverage depends on how high
the NMW is finally set between the all industries and the housing based living wage benchmark.
But how feasible would it be to adopt a universal NMW without shedding jobs and causing harm
to the broader economy? We shall now consider lessons from experiences of implementing
minimum wages in South Africa and elsewhere.
24Towards a South African
The Impact of a National
Minimum Wage
How do employers in a low-wage labour market respond to an increase in the minimum wage?
Those that largely oppose a NMW would argue that it would lead to job losses.
A famous 1993 study by researchers David Card and Alan Krueger found no evidence that the
rise in New Jersey’s minimum wage reduced employment at fast-food restaurants in the state.
In 2009, after 10 years of monitoring, the United Kingdom Low Pay Commission (consisting of
employers and workers) had not found any significant negative effect on employment. In Brazil we
saw the creation of 17 million formal sector jobs from 2002-2011. Brazil increased real wages by
81% in this period with no apparent consequences for employment and for economic growth. The
Brazilian GDP rose from -0.5% in 2003 to 9.1% in 2010 and unemployment decreased from 12%
in 2003 to 5% in 2014. This year the Brazilian NMW is set at R3, 091 per month or similar to the
South African median wage of R3, 033. Similarly, Turkey’s clothing and textile sector consistently
out-competes South Africa’s despite Turkish wages having been 24% to 41% higher in 2011.
In South Africa there have been numerous studies on the impact of minimum wages on employment
and the economy. Researchers at the University of Cape Town, Development Policy Research Unit
studied how the introduction of the “sectoral determinations” affected jobs. Their study focused on
the impact of the wholesale and retail, domestic workers, forestry, taxi, and private security sectors
on unemployment since the dates of their introduction. Together, these sectors accounted for
approximately 2.2 million workers in September 2007, which amounts to 17.2% of non-agricultural
employment. We summarise in full the findings of their research below.
JOB
WANTED Unemployment
For the wholesale and retail sector, there was an increase in employment following the introduction
of minimum wages. For domestic workers there was an insignificant initial decline after which
it increased to new highs. Employment in the forestry sector showed a statistically insignificant
decline; the private security sector experienced a sustained and large increase in employment.
There was also a significant increase in full-time employment in these sectors after the sectoral
minimums were implemented.
The only sector in which we see a significant decline in employment is the taxi sector – but this
could be as a result of the decline of the industry itself a few years before the introduction of the
sectoral minimum.
25National Minimum Wage
However, these findings contrast strongly with those of the agricultural sector, in which minimum
wage laws appear to have contributed to an overall decline in the likelihood of employment of as
much as 13% in the four years after the law was introduced.
Wages
As far as real wages are concerned, the only significant changes were increases in two sectors. In
the wholesale and retail sector, real wages increased significantly – and also the domestic work
sector experienced a sustained upward trend in real hourly wages.
Collectively the results suggest that the introduction of minimum wage laws were associated with
subsequent positive increases in real hourly earnings in four of the five sectors, i.e. in all sectors
except forestry. In addition, wages tended to rise more in districts where wages initially were far
below the introduced minimum wage.
Hours of Work
The minimum wage has had an effect on the deployment of workers in terms of the usual number
of hours worked per week. Significant declines in hours of work occurred in wholesale and retail
(2.2 hours per week), domestic work (3.3 hours) and the security sector (2.7 hours). These are also
the sectors in which the employment numbers continued to rise after minimum wage laws were
enacted. This suggests that employers started to reduce the usual work hours of employees in order
to afford, or counter, higher hourly wages.
However, as far as the effect of the laws on real monthly income is concerned, the wholesale and
retail, domestic work and security sectors showed an increase in real hourly wages that was sufficient
to outweigh any reductions in hours worked – workers ended up being better off on aggregate.
Workers in the forestry and taxi sectors appear to have been unaffected in real income terms.
Level of Compliance
A low level of compliance with prescribed minimum wages occurred in four of the five sectors,
40-60% of workers were paid less than the applicable minimum wage. In domestic work, non-
compliance was even worse, averaging 75% (though declining). However, the share of workers
with wages near the ‘compliant’ region far outweighed those that were non-compliant outside the
region of the prescribed minimum.
The ‘Special’ Case of Agriculture
Of all the sectors studied the researchers at UCT found that it was only the agricultural sector where
there was significant occurrence of unemployment after the implementation of the agriculture
sectoral determination of 2003. However, reports of economic growth of the agricultural sector
remained positive and thus there were no economic shocks (even in exports) that could have
caused the unemployment in the sector’s largest employers – citrus, maize and grapes.
26You can also read