NATURE: A CRITICAL CLIMATE SOLUTION - Savanna Institute
←
→
Page content transcription
If your browser does not render page correctly, please read the page content below

NATURE: A CRITICAL CLIMATE SOLUTION
Leveraging Nature Helps Address Climate Change While Benefiting
Farmers, Foresters and More
American farmers, ranchers and forest owners are on the front lines of climate change. Natural solutions
through habitat protection and restoration and climate-smart practices on working lands can provide one-
fifth of the emissions reductions needed to reach our climate goals. Together with a transition to clean energy,
these actions will create a more sustainable and resilient future.

The Meaker Farm Project in Montrose, Colorado demonstrates forest and fire management, and irrigation efficiency projects. Photo credit: © TNC/Ken Geiger

FROM COVER CROPS TO PLANTING TREES TO                                                          1) Increasing reforestation, controlling invasive species,
RESTORING COASTAL WETLANDS                                                                     and growing forests to greater maturity;

A real commitment to natural climate solutions                                                 2) Protecting carbon stocks through avoided conversion;
involves all lands across the American landscape. From                                         and
farm and ranch lands to private and public forests to
coastal wetlands, it’s about enhancing the ability to                                          3) Reducing emissions from uncharacteristically severe
store carbon through voluntary conservation programs,                                          wildfires through the use of controlled burning.
climate-smart practices, and investing in research.
                                                                                               Restoring coastal habitats can also make a significant
People and nature face immense challenges from the                                             contribution to climate mitigation. Coastal wetlands
impacts of climate change. The Nature Conservancy                                              store more carbon per acre than forests while protecting
supports actions to provide farmers, ranchers and                                              communities from flooding and improving habitat and
private forest owners with climate-smart tools they                                            water quality.
need to adapt, mitigate and become more resilient to
climate change.

Through climate-smart agriculture, we can produce
food in ways that reduce greenhouse gas (GHG)
emissions while improving habitat and protecting
biodiversity. In many cases, climate-smart
(regenerative) food systems are more productive than
conventional systems while preserving the livelihoods
of the farmers, and ranchers.

Similarly, we can enhance our forests’ ability to store
carbon while protecting drinking water, improving
wildlife habitat and increasing fiber supplies by:
                                                                                               Planting a young American elm seedling at Hubbardton River Clayplain Natural Area,
                                                                                               Vermont. © Erika Nortmann/TNC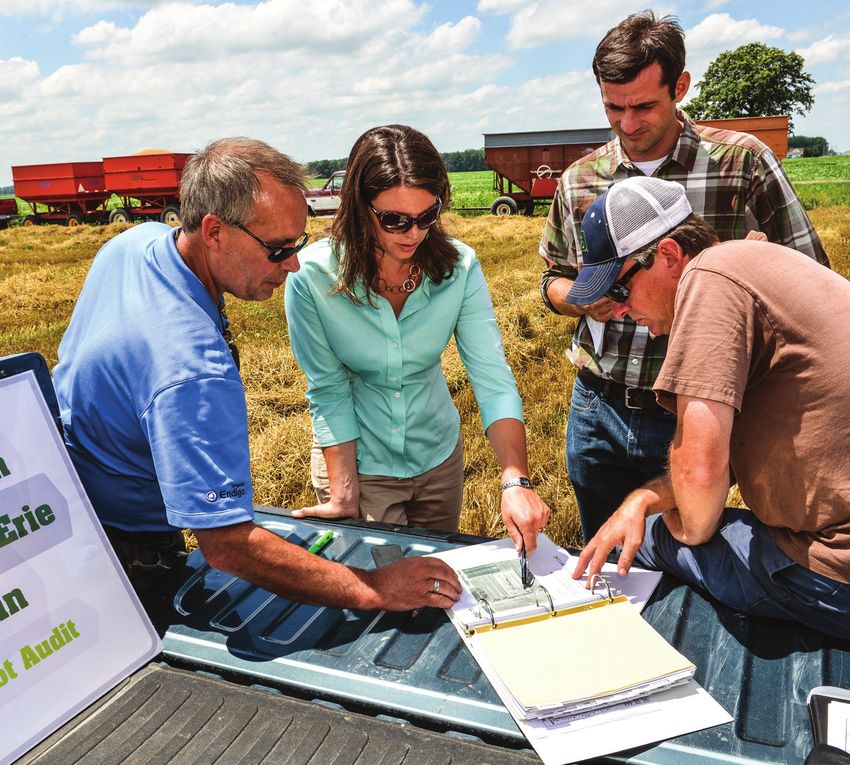
Increased investments and climate-smart policies would • Issue science-based guidance regarding carbon
support nature as a critical component of a comprehensive management principles to protect existing carbon
climate solution. The following policies address gaps in stocks and enhance carbon sequestration.
funding, science, markets and climate-smart practices: • Ensure agency budget allocations prioritize climate
mitigation and adaptation outcomes by investing
Supporting Private Landowners. Providing voluntary,
in federal forests and coastal wetlands programs,
incentive-based tools for farmers, ranchers and forest
including the USFS Vegetation and Watershed
owners is key to optimizing the sequestration of carbon,
Management, DOI Burned Area Rehabilitation, and
preventing greenhouse gas emissions, and increasing the
NOAA Restoration Center programs.
resilience of natural and working lands.
• Address the reforestation backlog on national forests
• Use tools like those in the Growing Climate Solutions through the REPLANT Act and complementary
Act (GCSA) to reduce barriers to participation in policies to support expansion of seed banks,
carbon markets by farmers and forest landowners nurseries and workforce training.
• Provide federal loan guarantees to de-risk private • Increase tree planting investments in communities,
capital investment in projects that help family forest including investments in urban canopy maintenance,
owners using similar mechanisms as in the Rural Forest with a focus on increased tree equity across cities.
Markets Act. Funding Research and Development. Decisions about
• Develop a transferrable tax credit program that would land management and accounting for carbon storage
reward farmers, ranchers, and forest landowners for must be grounded in science.
verified carbon sequestration.
• Increase capacity of USDA Climate Hubs and other
• Establish a Forest Conservation Easement Program
research units for delivering climate-related science.
with new funding to prevent conversion risks and
enhance carbon sequestration. • Update national forest-level carbon assessments
every five years with publicly available data, trend
• Expand funding and flexibility for technical assistance
analysis and state-level information.
to help farmers and foresters adopt emission-reducing
practices. • Create universal protocols for measurement across
agencies, including the Agricultural Research Service.
• Advance pilot projects designed to test and inform
federal policies and programs to accelerate the • Complete life cycle analysis to inform policies
voluntary adoption of natural climate solutions. to increase use of wood products to ensure net
emissions reductions and guard against unintended
• Develop an efficient and effective carbon bank to
consequences.
sequester carbon in natural working lands and help
scale voluntary carbon markets. • Incorporate climate considerations into all forest
restoration and reforestation activities.
• Provide mandatory funding for the National Grazing
Lands Coalition and amend the program purpose to • Improve data development, integration, and
add soil health and grazing system resilience. accessibility across agencies and increase
investments in research programs, such as the USFS
Improving Public Land Management. Federal agencies
Forest Inventory and Analysis Program; USDA’s
need climate-informed planning and policy tools to restore
COMET Tool; NASA’s GEDI and Landsat programs;
and manage forests and coastal wetlands in ways that
USFS/DOI LANDFIRE program; the National Land
increase their ability store carbon, ensure their resilience,
Cover Database; the EPA’s National Greenhouse Gas
protect clean drinking water, support biodiversity, and
Inventory; NRCS National Resources Inventory and
secure these areas for generations.
Conservation Effects Assessment Project; NOAA’s
Digital Coast public-private partnership.
ALSO VISIT:
Food and Agriculture Climate
Alliance (FACA)
agclimatealliance.com
Forest Climate Working Group
forestclimateworkinggroup.org
Cattle herding on the Alderspring Ranch in May, Idaho. People enjoying Gantry Plaza State Park along the
© Bridget Besaw East River in Queens. ©Diane Cook and Len Jenshel
Contact: Jennifer A. Conner | The Nature Conservancy | jconner@tnc.org | (305) 324-1424
Cecilia Clavet | The Nature Conservancy | cclavet@tnc.org | (703) 841-7425
The Nature Conservancy is a leading conservation organization working around the world to protect ecologically important lands and waters for nature and people. Visit nature.org.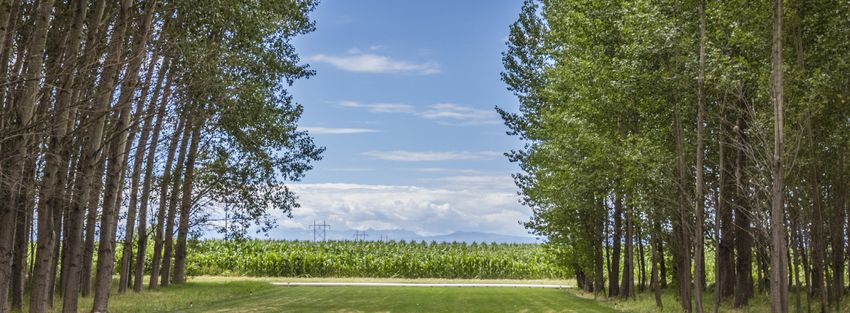
REDUCE YOUR COMPANY’S CARBON FOOTPRINT
                            with the Family Forest Carbon Program

               Local                 Natural climate solutions represent one of the greatest opportunities for companies to
                                     act on climate, reducing their carbon footprint and creating a positive impact on our
       State                         planet. The greatest untapped potential lies in rural America’s family-owned forests.

                   Family            The FAMILY FOREST CARBON PROGRAM is a new program that helps companies
   Federal                           reach their sustainability goals and make a meaningful contribution to our climate and
                                     communities through family-owned forests. Specifically, the Family Forest Carbon

             Corporate               Program offers companies:

                                                     CARBON CREDITS generated by the many family forest owners taking
                                                     positive actions to sequester additional carbon in their forest across a
                                                     landscape.

   WHY FAMILY
   FORESTS?                                          IMPROVED FORESTS as well as better wildlife habitat, protected water
                                                     resources and increased forest resiliency for the future.

Families and individuals own
the largest portion - 36% - of                       SUPPORT FOR RURAL COMMUNITIES by working with family forest
forests in the U.S.                                  owners and providing them ecomomic stimulus.

The majority of forest owners
struggle with the cost of forest                     CLIMATE LEADERSHIP by supporting a new unique carbon
care and conservation, leaving                       methodology co-created with AFF, TNC and Verra’s leading voluntary
their forests unmanaged and                          greenhouse gas program, the Verified Carbon Standard (VCS).
not reaching their full potential.

Markets can help. Yet carbon                         GUARANTEED CARBON SUPPLY through an early commitment that
markets have thus far been                           helps companies get ahead of the future demands on carbon.
inaccessible to nearly all small
family forest owners due to
high costs and complexity for
them.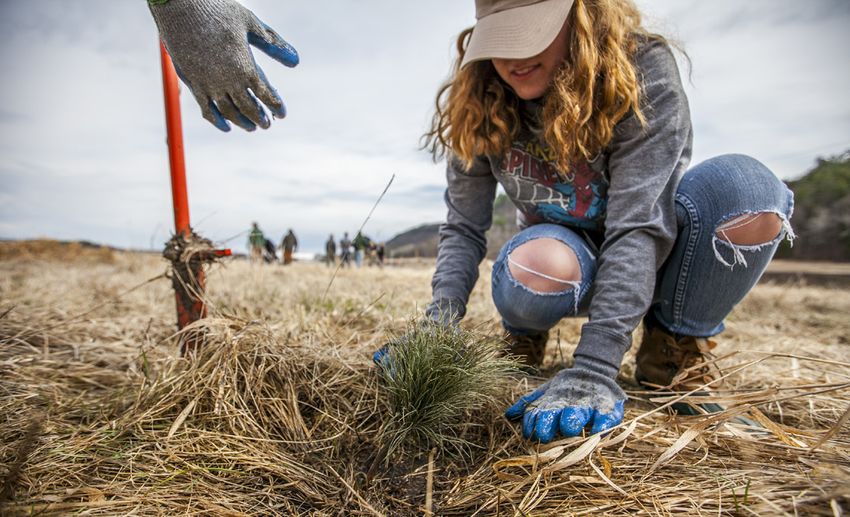
FAMILY FOREST CARBON PROGRAM
                    SUPPORT RURAL LANDOWNERS AND FORESTS RIGHT HERE IN THE U.S.

              The FAMILY FOREST CARBON PROGRAM provides landowners who are enrolled with incentive payments
              to implement geographically specific sustainable forestry practices that increase carbon sequestration
              and storage, while also improving the health of the forest. Specifically, landowners can participate in two
              practices:

                   GROWING MATURE FORESTS The Growing Mature Forests practice promotes the growth of larger, higher
                   quality trees by limiting harvesting over a 20-year contract period, in line with the landowner’s management
                   plan.

                   ENHANCING FUTURE FORESTS The Enhancing Future Forests practice promotes robust regeneration of
                   new forests by having the landowner reduce competing vegetation following or preceding a regeneration
                   harvest. This will allow quality trees to have the space, sunlight and water needed to grow.

                                  INNOVATING AROUND CARBON ACCOUNTING WITH VERRA
              The AFF and TNC teams are using a new methodology to measure carbon sequestered by family forests, co-
              created with Verra, the non-profit organization that oversees the Verified Carbon Standard (VCS).

              This innovative methodology takes a PRACTICE-BASED APPROACH, in which the program measures the
              carbon sequestered based on forest stock changes seen through the landowner taking a positive action from
              the practices noted above. This replaces the more time-intensive, traditional forest carbon inventory method,
              cutting costs to the landowner by 75%. Not only does this new methodology accommodate the constaints of
              small land holdings, but also provides more robust and accurate measurements. This new methodology is
              pending accreditation at the end of 2020.

                                          WWW.FORESTFOUNDATION.ORG/FFCP

Nathan Truitt
Vice President, Strategic Partnerships
American Forest Foundation
202-765-3627
ntruitt@forestfoundation.org

Christine Cadigan
Family Forest Carbon Program Director
American Forest Foundation
804-928-6904
ccadigan@forestfoundation.org
SCIENCE ADVANCES | RESEARCH ARTICLE

ENVIRONMENTAL STUDIES                                                                                                                       Copyright © 2018
                                                                                                                                            The Authors, some
Natural climate solutions for the United States                                                                                             rights reserved;
                                                                                                                                            exclusive licensee
                                                                                                                                            American Association
Joseph E. Fargione1*, Steven Bassett2, Timothy Boucher3, Scott D. Bridgham4, Richard T. Conant5,                                            for the Advancement
Susan C. Cook-Patton3,6, Peter W. Ellis3, Alessandra Falcucci7, James W. Fourqurean8,                                                       of Science. No claim to
Trisha Gopalakrishna3, Huan Gu9, Benjamin Henderson10, Matthew D. Hurteau11,                                                                original U.S. Government
Kevin D. Kroeger12, Timm Kroeger3, Tyler J. Lark13, Sara M. Leavitt3, Guy Lomax14,                                                          Works. Distributed
Robert I. McDonald3, J. Patrick Megonigal6, Daniela A. Miteva15, Curtis J. Richardson16,                                                    under a Creative
                                                                                                                                            Commons Attribution
Jonathan Sanderman17, David Shoch18, Seth A. Spawn13, Joseph W. Veldman19,                                                                  License 4.0 (CC BY).
Christopher A. Williams9, Peter B. Woodbury20, Chris Zganjar3, Marci Baranski21, Patricia Elias3,
Richard A. Houghton17, Emily Landis3, Emily McGlynn22, William H. Schlesinger23,
Juha V. Siikamaki24, Ariana E. Sutton-Grier25,26, Bronson W. Griscom3

Limiting climate warming to
SCIENCE ADVANCES | RESEARCH ARTICLE

Fig. 1. Climate mitigation potential of 21 NCS in the United States. Black lines indicate the 95% CI or reported range (see table S1). Ecosystem service benefits linked
with each NCS are indicated by colored bars for air (filtration), biodiversity (habitat protection or restoration), soil (enrichment), and water (filtration and flood control).
See the Supplementary Materials for detailed findings and sources.

levels within the historic range of variation and enables managed                         the maximum mitigation would be achieved. This means that 1.1 Pg
forests and plantations to transition to longer harvest rotations (see                    CO2e year−1 are available at USD 100 per Mg CO2e, which equals
the Supplementary Materials). We assume that extensive natural                            the emission reductions needed to meet the U.S. NDC under the
forests on private lands can all undergo harvest extension, with                          Paris Agreement (see the Supplementary Materials). If NCS were
the temporary loss of timber supply replaced by reforestation and                         pursued in combination with additional mitigation in the energy
thinning for fire risk reduction (12) or with thinning or select har-                     sector, then it would therefore enable the United States to exceed its
vest practices that still provide timber but maintain carbon levels                       current NDC ambition. This is important because, globally, current
(Supplementary Materials) (13, 14). We further constrain our analy-                       NDCs (7 to 9 Pg CO2e year−1) would need to be dramatically in-
sis to avoid impacts on biodiversity. This biodiversity constraint pre-                   creased (by an additional 10 to 16 Pg CO2e year−1) to limit warming
cludes both the conversion of natural habitat to energy crops and                         below 2°C (16).
the afforestation of native grasslands.                                                      This estimate of maximum NCS potential is similar to or higher
                                                                                          than several previous syntheses of mitigation opportunities in the
                                                                                          land sector. For example, the United States Mid-Century Strategy
RESULTS                                                                                   for Deep Decarbonization estimated a potential land sink of 912 Tg
We find a maximum additional NCS mitigation potential of 1.2 Pg                           CO2e year−1, 30% lower than our estimate (5). While other efforts
CO2e year−1 [95% confidence interval (CI), 0.9 to 1.6 Pg CO2e year−1]                     have focused on the forest sector (7) or the agricultural sector (6),
in the year 2025 (Fig. 1 and table S1). This is 21% of the 5794.5 Pg                      this analysis presents a comprehensive and up-to-date synthesis of
CO2e of net emissions in 2016 (15). The majority (63%) of this po-                        NCS opportunities in the United States. For example, this analysis
tential comes from increased carbon sequestration in plant bio-                           considers potential additional mitigation from tidal wetlands and
mass, with 29% coming from increased carbon sequestration in soil                         seagrass (“blue carbon”), which has been comprehensively analyzed
and 7% coming from avoided emissions of CH4 and N2O. At the                               for its current status in the United States (17), but not its potential
USD 10, 50, and 100 price points, 25, 76, and 91%, respectively, of                       for additional mitigation.

Fargione et al., Sci. Adv. 2018; 4 : eaat1869   14 November 2018                                                                                                        2 of 14
SCIENCE ADVANCES | RESEARCH ARTICLE
Reforestation has the single largest maximum mitigation poten- crops, grown when fields are normally bare, provide additional car-
tial (307 Tg CO2e year−1). The majority of this potential occurs in bon inputs to soils. Growing cover crops on the 88 Mha of the five
the northeast (35%) and south central (31%) areas of the United States primary crops in United States not already using cover crops presents
(fig. S1). This mitigation potential increases to 381 Tg CO2e year−1 a substantial opportunity for mitigation (103 Tg CO2e year−1). Cover
if all pastures in historically forested areas are reforested. Previous crops are increasingly used by U.S. farmers to improve soil health,
estimates of reforestation potential range widely from 208 to 1290 yields, and yield consistency (27). Improved management of nitro-
Tg CO2e year−1 (7). Higher estimates than ours can be obtained by gen fertilizers reduces N2O emissions and avoids fossil fuel emis-
reforesting or afforesting areas that we excluded (e.g., productive sions associated with fertilizer production (52 Tg CO2e year−1).
crop and pasture lands and natural grasslands) and/or by using rates Fertilizer rates can be reduced while maintaining yields by using
of carbon sequestration from plantation systems rather than from precision agriculture to apply only the amount required in each part
natural regenerating forests [e.g., (7)]. of the field and by splitting fertilizer applications to match the timing
Natural forest management of privately held forests has the sec- and supply of fertilizer with crop demand (see the Supplementary
ond largest maximum mitigation potential (267 Tg CO2e year−1). Materials). Emissions can also be reduced by switching from anhy-
This maximum mitigation is achieved by extending harvest cycles. drous fertilizer to urea, which has lower N2O emission (6).
Mitigation can also be achieved through forest management prac- The agronomic practices of biochar incorporation (95 Tg CO2e
tices such as reduced impact logging and improved silvicultural prac- year−1) and alley cropping (planting widely spaced trees interspersed
tices that release suppressed forest growth (18–20), although often with a row crop; 82 Tg CO2e year−1) also have high maximum poten-
at lower sequestration rates than extending harvest cycles. These tial. However, current adoption is negligible due to a variety of cul-
management practices can be implemented at low or no net cost tural, technological, and cost barriers that would need to be overcome
(21, 22) and do not require a change in business-as-usual (BAU) if these practices were to achieve their mitigation potential (28, 29).
land use or ownership rights. Tidal wetland restoration is the largest wetland NCS (12 Tg CO2e
Another promising opportunity associated with forests is fire year−1). Roughly 27% of U.S. salt marshes are disconnected from the
management (18 Tg CO2e year−1; fig. S6). Fire management entails ocean and subject to freshwater inundation. This results in a large
restoring frequent, low-intensity, understory fires in fire-prone forest increase in CH4 emissions from these “freshened” salt marshes. Re-
ecosystems to reduce the potential for high-severity wildfires (23). connecting salt marshes with the ocean, such as via culverts under
The primary carbon benefit from fire management is avoiding de- roads or other barriers, can avoid these CH4 emissions (30).
creased net ecosystem production from tree-killing wildfire. In the The 10 opportunities described above account for 90% (1082 Tg
absence of improved fire management, climate change is expected CO2e year−1) of the maximum NCS mitigation potential across all
to continue to increase the frequency of high-severity fires and com- 21 opportunities. An additional 11 opportunities, which sum to 122
promise the ability of forests to regenerate following these fires (24). Tg CO2e year−1, account for just 10% of the maximum potential.
The high uncertainty associated with the climate mitigation bene- However, these NCS may offer optimal ecological and economic
fits of fire management would be reduced by additional research to opportunities at local scales (Fig. 1 and Supplementary Materials).
quantify the carbon storage benefits of prescribed fire across a di- For example, peatland restoration offers a high per hectare mitiga-
versity of forest types, including the length of time that prescribed tion benefit, especially in regions of the United States with warm
fire reduces the risk of subsequent high-severity fires. temperate climates (8.2 Mg CO2e ha−1 year−1).
Avoided conversion protects carbon stored in extant forests and Lower-cost opportunities represent particularly promising areas
grasslands from ongoing losses. More than two-thirds of the avoided for increased near-term investment. We identified 299 Tg CO2e year−1
forest conversion potential (38 Tg CO2e year−1) occurs in the Southern of NCS opportunities that could be realized for USD 10 Mg CO2e−1
and Pacific Northwest regions (table S14 and fig. S9). Many of the or less (table S1), a price that is in line with many current carbon
most intensive areas of rapid forest conversion were located near markets (9). The two largest lower-cost opportunities are improved
urban zones, with additional hot spots in recent agricultural expan- management practices: cover crops (100 Tg CO2e year−1) and im-
sion zones (such as California’s Central Valley) and semi-arid re- proved natural forest management (64 Tg CO2e year−1). Both of
gions of the West. Avoided conversion of grassland to cropland these practices, along with planting windbreaks (5 Tg CO2e year−1)
prevents emissions from soils and root biomass (107 Tg CO2e year−1; and legumes in pastures (3 Tg CO2e year−1), have the potential to
fig. S12). The emissions from grassland conversion exceed the emis- increase yields (21, 22, 27) and therefore to generate additional rev-
sions from forest conversion because both the rate of conversion enue for landowners. Improved manure management can also provide
and the per hectare emissions are higher (table S1). Cropland ex- low-cost mitigation (12 Tg CO2e year−1) (8). In addition, lower-cost
pansion is a major cause of conversion that affects grasslands much NCS include increased efficiencies (cropland nutrient management,
more than forests (25). The higher rate of emissions occurs because 28 Tg CO2e year−1; grazing optimization, 6 Tg CO2e year−1) and
the conversion of grasslands to croplands results in a 28% loss of avoided conversion (avoided forest conversion, 37 Tg CO2e year−1;
soil carbon from the top meter of soil (26). This generates 125 Mg avoided grassland conversion, 24 Tg CO2e year−1).
CO2e ha−1 in emissions, comprising 81% of the emissions from grass- By itself, the marginal abatement cost gives an incomplete pic-
land conversion (see the Supplementary Materials). Because research ture of the potential for implementation of NCS, in part because NCS
shows conflicting conclusions regarding the impact of forest con- provide a variety of co-benefits (Fig. 1 and table S2). The values of
version in the United States on soil carbon, we do not include the these co-benefits are not captured in our marginal abatement costs
soil carbon pool in our estimate of emissions from forest conversion yet may drive NCS implementation. For example, investments in fire
(see the Supplementary Materials). management are needed to avoid impacts on air quality and drink-
Carbon sequestration opportunities in croplands include the use of ing water provision; urban forestry provides human health, aesthetic,
cover crops and improved cropland nutrient management. Cover and direct temperature reduction benefits; nutrient management is
Fargione et al., Sci. Adv. 2018; 4 : eaat1869 14 November 2018 3 of 14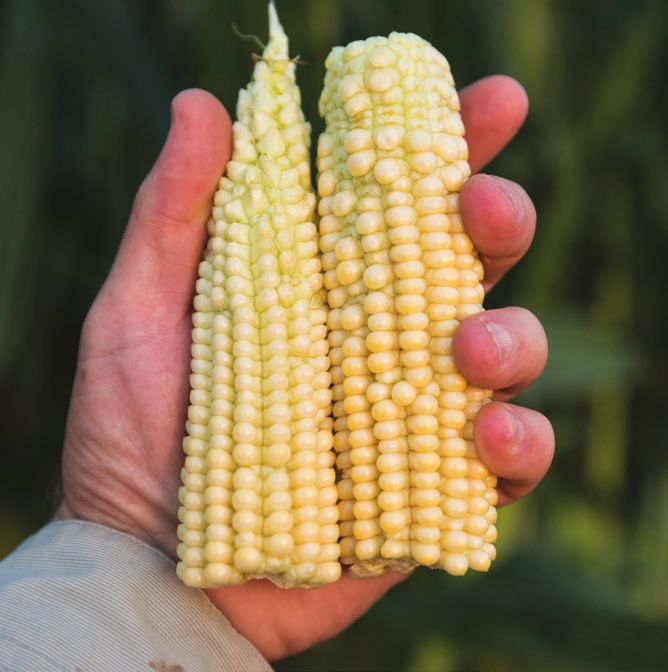
SCIENCE ADVANCES | RESEARCH ARTICLE

needed to improve water quality and avoid toxic algal blooms (table S2).   by the total carbon contained in the habitat. Our analysis assumes
Further, NCS can help provide resilience to climate change impacts         that rates of conversion persist at current levels in a BAU scenario,
on nature and people. For example, building soil carbon increases          which would represent a continuing source of emissions for at least
the resilience of cropland (31); protecting coastal wetlands can pro-      67 years for each habitat considered here before reaching “saturation”
vide coastal defense against storms (32); and fire management can          when the total area has been lost. However, the long-term benefit of
help avoid damaging wildfires (23).                                        avoided conversion depends on assumed future BAU conversion rates.
    We have restricted our analysis to those opportunities where the           The permanence of the ~2270 Pg C currently stored globally in
literature conclusively demonstrates the potential for mitigation.         biomass (42) and soils to 1 m (26) is a significant concern, because
This suggests that new research may reveal additional opportunities        unmitigated climate change is likely to cause feedbacks that may
for NCS, which would increase the potential identified here. At the        increase disturbances such as fire or pest outbreaks (43) or limit net
same time, substantial uncertainties exist in some NCS opportuni-          ecosystem productivity or forest regeneration (24). While NCS would
ties (Fig. 1 and table S1), highlighting the need for implementation       marginally increase this large carbon pool, putting some additional
to be coupled with monitoring and assessment of NCS.                       carbon at risk, rapid and widespread implementation of NCS would
                                                                           reduce the overall risk of impermanence to the terrestrial biosphere
                                                                           that unmitigated climate change is likely to cause.
DISCUSSION                                                                     Another challenge is that avoiding conversion in one area can
The United States is the largest cumulative emitter of carbon dioxide      cause conversion to shift to other areas, often referred to as “leakage.”
from fossil fuels (33). Despite the immense size of U.S. GHG emissions     Large-scale sectoral and landscape approaches to land use planning
from fossil fuel use, we find that NCS have the potential to generate      and policies will be needed to realize the NCS opportunities identi-
mitigation equivalent to 21% of net annual emissions. This reveals         fied here. These approaches can and should be designed to buffer
the important contribution to climate mitigation that the land sec-        risks of leakage associated with individual projects (44).
tor can make, even in developed countries such as the United States.           Reducing carbon-intensive energy consumption is necessary but
   Globally, current NCS efforts receive only 0.8% of public and           insufficient to meet the ambitious goals of the Paris Agreement.
private climate financing (34), despite offering roughly 37% of po-        Comprehensive mitigation efforts that include fossil fuel emission
tential mitigation needed through 2030 (3). One concern that may           reductions coupled with NCS hold promise for keeping warming
have limited the adoption of NCS to date includes competition with         below 2°C. Beyond providing meaningful climate mitigation, NCS
other land uses such as food and bioenergy production. A growing           investment can increase other important ecosystem services. The
body of literature suggests that future global food demand can be          conservation, restoration, and improved management of lands in
met via investments in yield increases, closing yield gaps, diet shifts,   the United States represent a necessary and urgent component of
aquaculture, and biofuel policy, without the need to further expand        efforts to stabilize the climate.
cropland into natural areas (35, 36). In the United States, marginal
cropland, much of which is unprofitable (37), could be restored to
grassland or forests with net societal benefits (38). Similarly, NCS       MATERIALS AND METHODS
may compete with bioenergy production. However, this conflict can          Below, we provide a brief overview of methods for each of the 21 NCS
be reduced or avoided depending on the form of bioenergy produc-           that we quantified. Full methodological details are provided in the
tion or NCS. Some forms of biomass production, such as residues            Supplementary Materials.
and wastes, or high-yielding methods, such as algae, do not require            Reforestation: Additional carbon sequestration in above- and
productive land (39). Our grassland restoration pathway could pro-         belowground biomass and soils gained by converting nonforest (25% tree cover (45)] in areas of the contermi-
sequestration in soils if low-productivity croplands are converted to      nous United States where forests are the native cover type. We ex-
perennial energy grasses (40). Further, NCS based on improved              cluded areas with intensive human development, including all major
management of existing land uses do not create land use conflict and       roads (46), impervious surfaces (47), and urban areas (48). To elimi-
can even increase productivity within that land use (e.g., fire manage-    nate double counting with the peatland restoration pathway, we re-
ment or cover crops). However, aggressive expansion of dedicated           moved Histosol soils (49). To safeguard food production, we removed
bioenergy crops, given the large land requirement of both first- and       most cropland and pasture. We discounted the carbon sequestra-
second-generation bioenergy crops (41), would be likely to reduce the      tion mitigation benefit in conifer-dominated forests to account for
mitigation potential available through NCS, notably via reforesta-         albedo effects.
tion, avoided grassland conversion, and natural forest management.             Natural forest management: Additional carbon sequestration in
   A second concern is that ecosystems have a limited ability to store     above- and belowground biomass gained through improved manage-
additional carbon. For each pathway, we quantified the duration of         ment in forests on private lands under nonintensive timber manage-
time for which mitigation is expected to occur at the rates we esti-       ment. The maximum mitigation potential was quantified on the basis
mate, before saturation effects decrease this rate (table S1). We note     of a “harvest hiatus” scenario starting in 2025, in which natural for-
that carbon can continue to accumulate in forests for hundreds             ests are shifted to longer harvest rotations. This could be accom-
of years and in soils for centuries or millennia (table S1 and the         plished with less than 10% reduction in timber supply with new
Supplementary Materials). Further, four of our NCS opportunities           timber supply from thinning treatments for fuel risk reduction until
(cropland nutrient management, tidal wetland restoration, manure           new timber from reforestation is available in 2030.
management, and improved rice management) are based on avoided                 Fire management: Use of prescribed fire to reduce the risk of
emissions of CH4 and N2O, which are benefits that do not saturate.         high-intensity wildfire. We considered fire-prone forests in the west-
The mitigation potential of avoided conversion of habitat is limited       ern United States. We assume that treatment eliminates the risk of

Fargione et al., Sci. Adv. 2018; 4 : eaat1869   14 November 2018                                                                             4 of 14
SCIENCE ADVANCES | RESEARCH ARTICLE

subsequent wildfire for 20 years, but only on the land that was di-         biochar carbon persists on a time scale of >100 years (53, 54) and that
rectly treated. We assume that 5% of lands are treated each year, and we    there are no effects of biochar on emissions of N2O or CH4 (55, 56).
calculated the benefits that accrue over 20 years, finding that the ini-        Alley cropping: Additional carbon sequestration gained by plant-
tial increase in emissions associated with prescribed fire treatment        ing wide rows of trees with a companion crop grown in the alley-
is more than offset over time by the avoided impacts of wildfires. We       ways between the rows. We estimated a maximum potential of alley
report the average annual benefit across these 20 years. The impact         cropping on 10% of U.S. cropland (15.4 Mha) (57).
of wildfires includes both direct emissions from combustion and                 Cropland nutrient management: Avoided N2O emissions due to
suppression of net ecosystem productivity following wildfires.              more efficient use of nitrogen fertilizers and avoided upstream emis-
    Avoided forest conversion: Emissions of CO2 avoided by avoiding         sions from fertilizer manufacture. We considered four improved
anthropogenic forest conversion. Most forest clearing is followed by        management practices: (i) reduced whole-field application rate, (ii)
forest regeneration rather than conversion to another land use. To          switching from anhydrous ammonia to urea, (iii) improved timing
estimate the rate of persistent conversion (i.e., to another land use),     of fertilizer application, and (iv) variable application rate within
we first calculated forest clearing in the conterminous United States       field. We projected a 4.6% BAU growth in fertilizer use in the United
from 2000 to 2010 and then used the proportion of forest clearing           States by 2025. On the basis of these four practices, we found a maxi-
that historically was converted to another land use to estimate con-        mum potential of 22% reduction in nitrogen use, which leads to
version rates in 2000 to 2010. We used estimates of avoided carbon          a 33% reduction in field emissions and a 29% reduction including
emissions from above- and belowground biomass that are specific             upstream emissions.
to each region and forest type. We did not count forest loss due to             Improved manure management: Avoided CH4 emissions from
fire to avoid double counting with the improved fire management             dairy and hog manure. We estimated the potential for emission
opportunity. We did not count forest loss due to pests because it           reductions from improved manure management on dairy farms
is unclear whether this loss can be avoided. We reduced the benefit         with over 300 cows and hog farms with over 825 hogs. Our calcu-
of avoided conversion in conifer-dominated forests to account for           lations are based on improved management practices described
their albedo effects.                                                       by Pape et al. (8).
    Urban reforestation: Additional carbon sequestration in above-              Windbreaks: Additional sequestration in above- and belowground
and belowground biomass gained by increasing urban tree cover.              biomass and soils from planting windbreaks adjacent to croplands
We considered the potential to increase urban tree cover in 3535            that would benefit from reduced wind erosion. We estimated that
cities in the conterminous United States. We considered the poten-          windbreaks could be planted on 0.88 Mha, based on an estimated
tial for additional street trees, and for those cities not in deserts, we   17.6 Mha that would benefit from windbreaks, and that windbreaks
also considered the potential for park and yard tree plantings. The         would be planted on ~5% of that cropland (8).
potential percent increase in tree cover was estimated on the basis of          Grazing optimization: Additional soil carbon sequestration due
high-resolution analysis of 27 cities, which excluded sports fields,        to grazing optimization on rangeland and planted pastures, derived
golf courses, and lawns (50).                                               directly from a recent study by Henderson et al. (58). Grazing opti-
    Improved plantations: Additional carbon sequestration gained in         mization prescribes a decrease in stocking rates in areas that are
above- and belowground tree biomass by extending rotation lengths           overgrazed and an increase in stocking rates in areas that are under-
for a limited time in even-aged, intensively managed wood production        grazed, but with the net result of increased forage offtake and live-
forests. Rotation lengths were extended from current economic opti-         stock production.
mal rotation length to a biological optimal rotation length in which            Grassland restoration: Additional carbon sequestration in soils
harvest occurs when stands reach their maximum annual growth.               and root biomass gained by restoring 2.1 Mha of cropland to grass-
    Cover crops: Additional soil carbon sequestration gained by             land, equivalent to returning to the 2007 peak in CRP enrollment.
growing a cover crop in the fallow season between main crops. We            Grassland restoration does not include restoration of shrubland.
quantified the benefit of using cover crops on all of the five major            Legumes in pastures: Additional soil carbon sequestration due
crops in the United States (corn, soy, wheat, rice, and cotton) that        to sowing legumes in planted pastures, derived directly from a re-
are not already growing cover crops (27), using the mean sequestra-         cent global study by Henderson et al. (58). Restricted to planted
tion rate quantified in a recent meta-analysis (51).                        pastures and to where sowing legumes would result in net seques-
    Avoided conversion of grassland: Emissions of CO2 avoided by            tration after taking into account potential increases in N2O emis-
avoiding conversion of grassland and shrubland to cropland. We              sions from the planted legumes.
quantified avoided emissions from soil and roots (for shrubs, we also           Improved rice management: Avoided emissions of CH4 and
considered aboveground biomass) based on the spatial pattern of             N2O through improved practices in flooded rice cultivation. Prac-
conversion from 2008 to 2012. We used spatial information on lo-            tices including mid-season drainage, alternate wetting and drying,
cation of recent conversion and variation in soil carbon and root           and residue removal can reduce these emissions. We used a U.S. En-
biomass to estimate mean annual emission rate from historic con-            vironmental Protection Agency (EPA) analysis that projects the po-
version. We estimated a 28% loss of soil carbon down to 1 m (26).           tential for improvement across U.S. rice fields, in comparison with
We modeled spatial variation in root biomass based on mean annual           current agricultural practices (59).
temperature and mean annual precipitation using data from (52).                 Tidal wetland restoration: In the United States, 27% of tidal wet-
    Biochar: Increased soil carbon sequestration by amending agri-          lands (salt marshes and mangroves) have limited tidal connection
cultural soils with biochar, which converts nonrecalcitrant carbon          with the sea, causing their salinity to decline to the point where CH4
(crop residue biomass) to recalcitrant carbon (charcoal) through            emissions increase (30). We estimated the potential for reconnect-
pyrolysis. We limited the source of biochar production to crop resi-        ing these tidal wetlands to the ocean to increase salinity and reduce
due that can be sustainably harvested. We assumed that 79.6% of             CH4 emissions.

Fargione et al., Sci. Adv. 2018; 4 : eaat1869   14 November 2018                                                                            5 of 14
SCIENCE ADVANCES | RESEARCH ARTICLE

    Peatland restoration: Avoided carbon emissions from rewetting                             Table S15. Urban reforestation maximum potential annual net C sequestration in 2025.
                                                                                              Table S16. Uncertainty in urban reforestation average annual abatement (Tg CO2) by 2025 at a
and restoring drained peatlands. To estimate the extent of restor-
                                                                                              cost of USD 100 per Mg CO2.
able peatlands, we quantified the difference between historic peat-                           Table S17. Profitability impacts of cover crops for selected crops.
land extent [based on the extent of Histosols in soil maps (60)] and                          Table S18. Marginal abatement costs of cover crops in the five primary crops.
current peatland extent. Our estimate of mitigation potential ac-                             Table S19. Maximum feasible N2O reduction for multiple nitrogen fertilizer practices.
counted for changes in soil carbon, biomass, and CH4 emissions,                               Table S20. Results from the literature of the potential for reducing N fertilizer rate using
                                                                                              within-field management.
considering regional differences, the type of land use of the converted                       Table S21. Current and projected GHG emissions from nitrogen fertilizer manufacturing in the
peatland, and whether the peatland was originally forested.                                   United States.
    Avoided seagrass loss: Avoided CO2 emissions from avoiding sea-                           Table S22. Mitigation potential for grazing optimization and legumes in pasture NCS at
grass loss. An estimated 1.5% of seagrass extent is lost every year (61).                     different marginal abatement costs.
                                                                                              Table S23. Areas and carbon fluxes for Histosols in the conterminous United States.
We assumed that half of the carbon contained in biomass and sedi-
                                                                                              Table S24. Peatland restoration mitigation calculations for climate zones within the United
ment from disappearing seagrass beds is lost to the atmosphere (62).                          States.
    Seagrass restoration: Increased sequestration from restoring the                          Table S25. 95% CIs for Histosol calculations.
estimated 29 to 52% of historic seagrass extent that has been lost                            References (64–398)
and could be restored (61). We estimated the average carbon se-
questration rate in the sediment of seagrass restorations based on                            REFERENCES AND NOTES
data from six seagrass restoration sites in the United States (63).                            1. United Nations, United Nations Framework Convention on Climate Change: Adoption of the
                                                                                                  Paris Agreement (United Nations, 2015).
                                                                                               2. P. Smith, S. J. Davis, F. Creutzig, S. Fuss, J. Minx, B. Gabrielle, E. Kato, R. B. Jackson,
                                                                                                  A. Cowie, E. Kriegler, D. P. van Vuuren, J. Rogelj, P. Ciais, J. Milne, J. G. Canadell,
SUPPLEMENTARY MATERIALS                                                                           D. McCollum, G. Peters, R. Andrew, V. Krey, G. Shrestha, P. Friedlingstein, T. Gasser,
Supplementary material for this article is available at http://advances.sciencemag.org/cgi/       A. Grübler, W. K. Heidug, M. Jonas, C. D. Jones, F. Kraxner, E. Littleton, J. Lowe,
content/full/4/11/eaat1869/DC1                                                                    J. Roberto Moreira, N. Nakicenovic, M. Obersteiner, A. Patwardhan, M. Rogner, E. Rubin,
Supplementary Materials and Methods                                                               A. Sharifi, A. Torvanger, Y. Yamagata, J. Edmonds, C. Yongsung, Biophysical and
Fig. S1. Mapped reforestation opportunity areas in the lower 48 states.                           economic limits to negative CO2 emissions. Nat. Clim. Change 6, 42–50 (2016).
Fig. S2. Conceptual framework for improved forest management carbon accounting.                3. B. W. Griscom, J. Adams, P. W. Ellis, R. A. Houghton, G. Lomax, D. A. Miteva,
Fig. S3. MAC for carbon sequestration through forest management and aging, after                  W. H. Schlesinger, D. Shoch, J. V. Siikamäki, P. Smith, P. Woodbury, C. Zganjar,
Golub et al. (99).                                                                                A. Blackman, J. Campari, R. T. Conant, C. Delgado, P. Elias, T. Gopalakrishna,
Fig. S4. MAC for natural forest management after Latta et al. (98) and best-fit functions.        M. R. Hamsik, M. Herrero, J. Kiesecker, E. Landis, L. Laestadius, S. M. Leavitt,
Fig. S5. MAC curves for improved plantations.                                                     S. Minnemeyer, S. Polasky, P. Potapov, F. E. Putz, J. Sanderman, M. Silvius, E. Wollenberg,
Fig. S6. Fire management analysis area.                                                           J. Fargione, Natural climate solutions. Proc. Natl. Acad. Sci. U.S.A. 114,
Fig. S7. Regions used for reporting avoided forest conversion results.                            11645–11650 (2017).
Fig. S8. Forest conversion from 1986 to 2000.                                                  4. C. B. Field, K. J. Mach, Rightsizing carbon dioxide removal. Science 356, 706–707 (2017).
Fig. S9. Potential carbon emissions from areas at high risk of forest conversion.              5. The White House, United States Mid-Century Strategy for Deep Decarbonization (The White
Fig. S10. Cities included in the urban reforestation analysis.                                    House, 2016).
Fig. S11. Calibration of remote sensing data for forest cover estimation in urban areas.
                                                                                               6. A. J. Eagle, L. R. Henry, L. P. Olander, K. Haugen-Kozyra, N. Millar, G. P. Robertson,
Fig. S12. Avoided grassland conversion map.
                                                                                                  Greenhouse Gas Mitigation Potential of Agricultural Land Management in the United States:
Fig. S13. MAC curve for avoided grassland conversion.
                                                                                                  A Synthesis of the Literature (Nicholas Institute, Duke University, 2012).
Fig. S14. Nitrogen fertilizer use in the United States.
                                                                                               7. C. Van Winkle, J.S. Baker, D. Lapidus, S. Ohrel, J. Steller, G. Latta, D. Birur, US Forest Sector
Fig. S15. Marginal abatement cost curve for reducing N fertilizer rate.
                                                                                                  Greenhouse Mitigation Potential and Implications for Nationally Determined Contributions
Fig. S16. Marginal abatement cost curve for applying variable rate technology fertilizer
                                                                                                  (RTI Press, 2017).
application.
                                                                                               8. D. Pape, J. Lewandrowski, R. Steele, D. Man, M. Riley-Gilbert, K. Moffroid, S. Kolansky,
Fig. S17. Grazing optimization map.
                                                                                                  Managing Agricultural Land for Greenhouse Gas Mitigation Within the United States
Fig. S18. Legumes in pastures map.
                                                                                                  (U.S. Department of Agriculture, 2016); www.usda.gov/oce/climate_change/
Fig. S19. Grassland restoration map.
                                                                                                  mitigation.htm.
Fig. S20. MAC curve for grassland restoration.
                                                                                               9. World Bank; Ecofys; Vivid Economics, State and Trends of Carbon Pricing 2017
Fig. S21. Break-even prices for GHG abatement from rice production.
                                                                                                  (World Bank, 2017).
Fig. S22. MAC curve for salt marsh restoration.
                                                                                              10. National Academies of Science Engineering and Medicine, Valuing Climate Damages:
Fig. S23. MAC of avoided GHG emissions from seagrass.
                                                                                                  Updating Estimation of the Social Cost of Carbon Dioxide (The National Academies
Table S1. Mitigation potential of NCS in 2025.
                                                                                                  Press, 2017).
Table S2. Co-benefits of NCS.
Table S3. Literature MAC estimates for reforestation of agricultural lands.                   11. W. D. Nordhaus, Evolution of modeling of the economics of global warming: Changes in
Table S4. Literature estimates of reforestation costs used to estimate MAC of reforesting         the DICE model, 1992–2017. Clim. Change 148, 623–640 (2018).
natural ecosystems.                                                                           12. K. E. Skog, P. J. Ince, H. Spelter, A. Kramp, R. J. Barbour, in Woody Biomass Utilization:
Table S5. Estimated marginal abatement cost of fire management by major forest region.            Challenges and Opportunities (Forest Products Society, 2008), pp. 3–14.
Table S6. Forest disturbance rates by source.                                                 13. S. C. Davis, A. E. Hessl, C. J. Scott, M. B. Adams, R. B. Thomas, Forest carbon
Table S7. Mean annual forest hectares cleared per year from 1986 to 2000.                         sequestration changes in response to timber harvest. For. Ecol. Manage. 258,
Table S8. Mean annual forest hectares cleared per year from 2001 to 2010.                         2101–2109 (2009).
Table S9. Mean annual forest hectares converted per year from 1986 to 2000.                   14. C. Hoover, S. Stout, The carbon consequences of thinning techniques: Stand structure
Table S10. Proportion of areas cleared from 1986 to 2000 that had not regenerated to forest       makes a difference. J. For. 105, 266–270 (2007).
by 2010.                                                                                      15. U.S. Environmental Protection Agency, Inventory of U.S. Greenhouse Gas Emissions and
Table S11. Mean predisturbance dry biomass (kg m−2) in forest areas converted from 1986           Sinks: 1990–2016 (U.S. Environmental Protection Agency, 2018); www.epa.gov/
to 2000.                                                                                          ghgemissions/inventory-us-greenhouse-gas-emissions-and-sinks-1990-2016.
Table S12. Mean predisturbance dry biomass (kg m−2) in forest areas converted from 2001       16. J. Rogelj, M. den Elzen, N. Höhne, T. Fransen, H. Fekete, H. Winkler, R. Schaeffer, F. Sha,
to 2010.                                                                                          K. Riahi, M. Meinshausen, Paris Agreement climate proposals need boost to keep
Table S13. Carbon emissions (Mg C year−1) from estimated forest conversion from 2001              warming well below 2°C. Nat. Clim. Change 534, 631–639 (2016).
to 2010.                                                                                      17. Commission for Environmental Cooperation, North America’s Blue Carbon: Assessing
Table S14. Albedo-adjusted carbon emissions equivalent (Mg Ce year−1) from estimated forest       Seagrass, Salt Marsh and Mangrove Distribution and Carbon Sinks (Commission for
conversion from 2001 to 2010.                                                                     Environmental Cooperation, 2016).

Fargione et al., Sci. Adv. 2018; 4 : eaat1869    14 November 2018                                                                                                                         6 of 14
SCIENCE ADVANCES | RESEARCH ARTICLE
18. T. D. Lee, S. E. Eisenhaure, I. P. Gaudreau, Pre-logging treatment of invasive glossy 42. K. H. Erb, T. Kastner, C. Plutzar, A. L. S. Bais, N. Carvalhais, T. Fetzel, S. Gingrich, H. Haberl,
buckthorn (Frangula alnus Mill.) promotes regeneration of eastern white pine C. Lauk, M. Niedertscheider, J. Pongratz, M. Thurner, S. Luyssaert, Unexpectedly large
(Pinus strobus L.). Forests 8, 16 (2017). impact of forest management and grazing on global vegetation biomass. Nature 553,
19. T. M. Schuler, M. Thomas-Van Gundy, J. P. Brown, J. K. Wiedenbeck, Managing 73–76 (2018).
Appalachian hardwood stands using four management practices: 60-year results. 43. J. T. Abatzoglou, A. P. Williams, Impact of anthropogenic climate change on wildfire
For. Ecol. Manage. 387, 3–11 (2017). across western US forests. Proc. Natl. Acad. Sci. U.S.A. 113, 11770–11775 (2016).
20. S. A. Moss, E. Heitzman, The economic impact of timber harvesting practices on NIPF 44. J. Sayer, T. Sunderland, J. Ghazoul, J.-L. Pfund, D. Sheil, E. Meijaard, M. Venter,
properties in West Virginia, in Proceedings of the 18th Central Hardwood Forest Conference, A. Klintuni Boedhihartono, M. Day, C. Garcia, C. van Oosten, L. E. Buck, Ten principles for a
G. W. Miller, T. M. Schuler, K. W. Gottschalk, J. R. Brooks, S. T. Grushecky, B. D. Spong, landscape approach to reconciling agriculture, conservation, and other competing land
J. S. Rentch, Eds. (U.S. Department of Agriculture, Forest Service, 2013), pp. 129–141. uses. Proc. Natl. Acad. Sci. U.S.A. 110, 8349–8356 (2013).
21. Ruslandi, C. Romero, F. E. Putz, Financial viability and carbon payment potential of 45. M. C. Hansen, P. V. Potapov, R. Moore, M. Hancher, S. A. Turubanova, A. Tyukavina,
large-scale silvicultural intensification in logged dipterocarp forests in Indonesia. D. Thau, S. V. Stehman, S. J. Goetz, T. R. Loveland, A. Kommareddy, A. Egorov, L. Chini,
For. Policy Econ. 85, 95–102 (2017). C. O. Justice, J. R. G. Townshend, High-resolution global maps of 21st-century forest
22. V. P. Medjibe, F. E. Putz, Cost comparisons of reduced-impact and conventional logging cover change. Science 342, 850–853 (2013).
in the tropics. J. For. Econ. 18, 242–256 (2012). 46. Open Street Map, Osm2Shp (2016); http://osm2shp.ru/.
23. J. Williams, Exploring the onset of high-impact mega-fires through a forest land 47. G. Xian, C. G. Homer, J. Dewitz, J. Fry, N. Hossain, J. Wickham, The change of impervious
management prism. For. Ecol. Manage. 294, 4–10 (2013). surface area between 2001 and 2006 in the conterminous United States.
24. C. S. Stevens-Rumann, K. B. Kemp, P. E. Higuera, B. J. Harvey, M. T. Rother, D. C. Donato, Photogramm. Eng. Remote Sens. 77, 758–762 (2011).
P. Morgan, T. T. Veblen, Evidence for declining forest resilience to wildfires under climate 48. U.S. Census Bureau, Cartographic Boundary File, Urban Area for United States (U.S. Census
change. Ecol. Lett. 21, 243–252 (2018). Bureau, 2015); www.census.gov/geo/maps-data/data/cbf/cbf_ua.html.
25. T. J. Lark, J. Meghan Salmon, H. K. Gibbs, Cropland expansion outpaces agricultural and 49. Soil Survey Staff, U.S. General Soil Map (STATSGO2) (U.S. Department of Agriculture, 2017);
biofuel policies in the United States. Environ. Res. Lett. 10, 044003 (2015). https://sdmdataaccess.sc.egov.usda.gov.
26. J. Sanderman, T. Hengl, G. J. Fiske, Soil carbon debt of 12,000 years of human land use. 50. T. Kroeger, R. I. McDonald, T. Boucher, P. Zhang, L. Wang, Where the people are: Current
Proc. Natl. Acad. Sci. U.S.A. 114, 9575–9580 (2017). trends and future potential targeted investments in urban trees for PM10 and
27. Conservation Technology Information Center, Sustainable Agriculture Research and temperature mitigation in 27 U.S. cities. Landsc. Urban Plan. 177, 277–240 (2018).
Education, American Seed Trade Association, Annual Report 2016-2017 Cover Crop Survey 51. C. Poeplau, A. Don, Carbon sequestration in agricultural soils via cultivation of cover
(Conservation Technology Information Center, Sustainable Agriculture Research and crops—A meta-analysis. Agric. Ecosyst. Environ. 200, 33–41 (2015).
Education, American Seed Trade Association, 2017). 52. K. Mokany, R. J. Raison, A. S. Prokushkin, Critical analysis of root: Shoot ratios in
28. D. Knowler, B. Bradshaw, Farmers’ adoption of conservation agriculture: A review and terrestrial biomes. Glob. Chang. Biol. 12, 84–96 (2006).
synthesis of recent research. Food Policy 32, 25–48 (2007). 53. R. S. Dharmakeerthi, K. Hanley, T. Whitman, D. Woolf, J. Lehmann, Organic carbon
29. S. Shackley, G. Ruysschaert, K. Zwart, B. Glaser, Biochar in European Soils and Agriculture: dynamics in soils with pyrogenic organic matter that received plant residue additions
Science and Practice (Routledge, 2016). over seven years. Soil Biol. Biochem. 88, 268–274 (2015).
30. K. D. Kroeger, S. Crooks, S. Moseman-valtierra, J. Tang, Restoring tides to avoid methane 54. B. Liang, J. Lehmann, D. Solomon, S. Sohi, J. E. Thies, J. O. Skjemstad, F. J. Luizão,
emissions in impounded wetlands: A new and potent Blue Carbon climate change M. H. Engelhard, E. G. Neves, S. Wirick, Stability of biomass-derived black carbon in soils.
intervention. Sci. Rep. 7162, 1–23 (2017). Geochim. Cosmochim. Acta 72, 6069–6078 (2008).
31. S. Banwart, S. Banwart, H. Black, Z. Cai, P. Gicheru, H. Joosten, R. Victoria, E. Milne, 55. X. Song, G. Pan, C. Zhang, L. Zhang, H. Wang, Effects of biochar application on fluxes of
E. Noellemeyer, U. Pascual, G. Nziguheba, R. Vargas, A. Bationo, D. Buschiazzo, three biogenic greenhouse gases: A meta-analysis. Ecosyst. Health Sustain. 2,
D. de-Brogniez, J. Melillo, D. Richter, M. Termansen, M. van Noordwijk, T. Goverse, e01202 (2016).
C. Ballabio, T. Bhattacharyya, M. Goldhaber, N. Nikolaidis, Y. Zhao, R. Funk, C. Duffy, 56. J. Wang, Z. Xiong, Y. Kuzyakov, Biochar stability in soil: Meta-analysis of decomposition
G. Pan, N. la Scala, P. Gottschalk, N. Batjes, J. Six, B. van Wesemael, M. Stocking, F. Bampa, and priming effects. Glob. Change Biol. Bioenergy 8, 512–523 (2016).
M. Bernoux, C. Feller, P. Lemanceau, L. Montanarella, Benefits of soil carbon: Report on 57. R. P. Udawatta, S. Jose, Carbon sequestration potential of agroforestry practices in
the outcomes of an international scientific committee on problems of the environment temperate North America, in Carbon Sequestration Potential of Agroforestry Systems, vol. 8
rapid assessment workshop. Carbon Manage. 5, 185–192 (2014). of Advances in Agroforestry, B. M. Kumar, P. K. R. Nair, Eds. (Springer Netherlands, 2011),
32. S. Narayan, M. W. Beck, P. Wilson, C. J. Thomas, A. Guerrero, C. C. Shepard, B. G. Reguero, pp. 17–42.
G. Franco, J. Carter Ingram, D. Trespalacios, The value of coastal wetlands for flood 58. B. B. Henderson, P. J. Gerber, T. E. Hilinski, A. Falcucci, D. S. Ojima, M. Salvatore,
damage reduction in the northeastern USA. Sci. Rep. 7, 9463 (2017). R. T. Conant, Greenhouse gas mitigation potential of the world’s grazing lands: Modeling
33. T. A. Boden, R. J. Andres, G. Marland, Global, Regional, and National Fossil-Fuel CO2 soil carbon and nitrogen fluxes of mitigation practices. Agric. Ecosyst. Environ. 207,
Emissions (1751-2014) (V. 2017) (U.S. Department of Energy, 2017). 91–100 (2015).
34. B. K. Buchner, C. Trabacchi, F. Mazza, D. Abramskiehn, D. Wang, Global Landscape of 59. U.S. Environmental Protection Agency, Global Mitigation of Non-CO2 Greenhouse Gases:
Climate Finance 2015 (Climate Policy Initiative, 2015); www.climatepolicyinitiative.org. 2010-2030 (U.S. Environmental Protection Agency, 2013).
35. K.-H. Erb, C. Lauk, T. Kastner, A. Mayer, M. C. Theurl, H. Haberl, Exploring the biophysical 60. Soil Survey Staff, Gridded Soil Survey Geographic (gSSURGO) Database for the Conterminous
option space for feeding the world without deforestation. Nat. Commun. 7, United States (U.S. Department of Agriculture, 2016); https://gdg.sc.egov.usda.gov/.
11382 (2016). 61. M. Waycott, C. M. Duarte, T. J. Carruthers, R. J. Orth, W. C. Dennison, S. Olyarnik,
36. P. Smith, H. Haberl, A. Popp, K. H. Erb, C. Lauk, R. Harper, F. N. Tubiello, A. Calladine, J. W. Fourqurean, K. L. Heck Jr., A. R. Hughes, G. A. Kendrick, W. J. Kenworthy,
A. de Siqueira Pinto, M. Jafari, S. Sohi, O. Masera, H. Böttcher, G. Berndes, M. Bustamante, F. T. Short, S. L. Williams, Accelerating loss of seagrasses across the globe threatens
H. Ahammad, H. Clark, H. Dong, E. A. Elsiddig, C. Mbow, N. H. Ravindranath, C. W. Rice, coastal ecosystems. Proc. Natl. Acad. Sci. U.S.A. 106, 12377–12381 (2009).
C. Robledo Abad, A. Romanovskaya, F. Sperling, M. Herrero, J. I. House, S. Rose, How 62. L. Pendleton, D. C. Donato, B. C. Murray, S. Crooks, W. A. Jenkins, S. Sifleet, C. Craft,
much land-based greenhouse gas mitigation can be achieved without compromising J. W. Fourqurean, J. B. Kauffman, N. Marbà, P. Megonigal, E. Pidgeon, D. Herr, D. Gordon,
food security and environmental goals? Glob. Chang. Biol. 19, 2285–2302 (2013). A. Baldera, Estimating global “blue carbon” emissions from conversion and degradation
37. E. Brandes, G. S. McNunn, L. A. Schulte, I. J. Bonner, D. J. Muth, B. A. Babcock, B. Sharma, of vegetated coastal ecosystems. PLOS ONE 7, e43542 (2012).
E. A. Heaton, Subfield profitability analysis reveals an economic case for cropland 63. A. Thorhaug, H. M. Poulos, J. López-Portillo, T. C. W. Ku, G. P. Berlyn, Seagrass blue carbon
diversification. Environ. Res. Lett. 11, 014009 (2016). dynamics in the Gulf of Mexico: Stocks, losses from anthropogenic disturbance, and
38. K. A. Johnson, B. J. Dalzell, M. Donahue, J. Gourevitch, D. L. Johnson, G. S. Karlovits, gains through seagrass restoration. Sci. Total Environ. 605–606, 626–636 (2017).
B. Keeler, J. T. Smith, Conservation Reserve Program (CRP) lands provide ecosystem 64. J. W. Veldman, G. E. Overbeck, D. Negreiros, G. Mahy, S. Le Stradic, G. W. Fernandes,
service benefits that exceed land rental payment costs. Ecosyst. Serv. 18, 175–185 (2016). G. Durigan, E. Buisson, F. E. Putz, W. J. Bond, Where tree planting and forest expansion are
39. D. Tilman, R. Socolow, J. A. Foley, J. Hill, E. Larson, L. Lynd, S. Pacala, J. Reilly, bad for biodiversity and ecosystem services. Bioscience 65, 1011–1018 (2015).
T. Searchinger, C. Somerville, R. Williams, Beneficial biofuels—The food, energy, and 65. S. Luyssaert, E. D. Schulze, A. Börner, A. Knohl, D. Hessenmöller, B. E. Law, P. Ciais, J. Grace,
environment trilemma. Science 325, 270–271 (2009). Old-growth forests as global carbon sinks. Nature 455, 213–215 (2008).
40. D. Tilman, J. Hill, C. Lehman, Carbon-negative biofuels from low-input high-diversity 66. B. E. Law, O. J. Sun, J. Campbell, S. Van Tuyl, P. E. Thornton, Changes in carbon storage
grassland biomass. Science 314, 1598–1600 (2006). and fluxes in a chronoseuence of ponderosa pine. Glob. Chang. Biol. 4, 510–524 (2003).
41. J. E. Fargione, R. J. Plevin, J. D. Hill, The ecological impact of biofuels. Annu. Rev. 67. D. J. Nowak, J. C. Stevens, S. M. Sisinni, C. J. Luley, Effects of urban tree management and
Ecol. Evol. Syst. 41, 351–377 (2010). species selection on atmospheric carbon dioxide. J. Arboric. 28, 113–122 (2002).
Fargione et al., Sci. Adv. 2018; 4 : eaat1869 14 November 2018 7 of 14You can also read