Navigating the Landscape of Air Cleaning Technologies for COVID-19
←
→
Page content transcription
If your browser does not render page correctly, please read the page content below
Navigating the Landscape of Air
Cleaning Technologies for COVID-19
 Brent Stephens, Ph.D.
 Professor and Department Chair
 Civil, Architectural, and Environmental Engineering
 Illinois Institute of Technology
 Chicago, IL

 Elliott Gall, Ph.D.
 Associate Professor
 Mechanical and Materials Engineering
 Portland State University
 Portland, OR
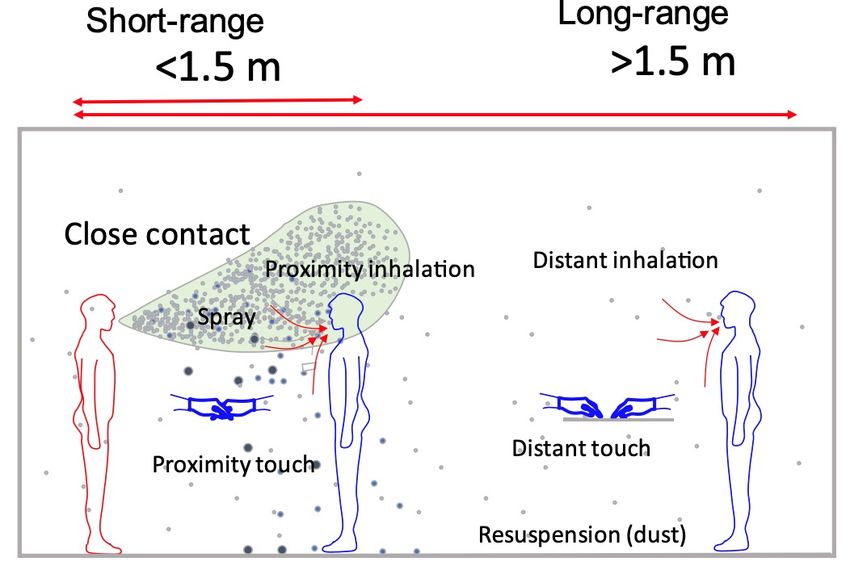
Transmission Routes of SARS-CoV-2

 Li 2021, Indoor Air, 31:3–6
 Possible routes of transmission:
 • Touching contaminated surfaces (both short and long rage)
 • “Transmission of novel coronavirus to persons from surfaces
 contaminated with the virus has not been documented.” CDC, 20201
 • Large droplet spray (short range only)
 • Aerosol inhalation (both short and long range) Adapted from: cdc.gov

 • Aerosol inhalation is increasingly considered dominant.2
1CDC, 2020: www.cdc.gov/coronavirus/2019-ncov/prevent-getting-sick/cleaning-disinfection.html
2Greenhalgh et al. 2021 The Lancet 397(10285):P1603–1605 2
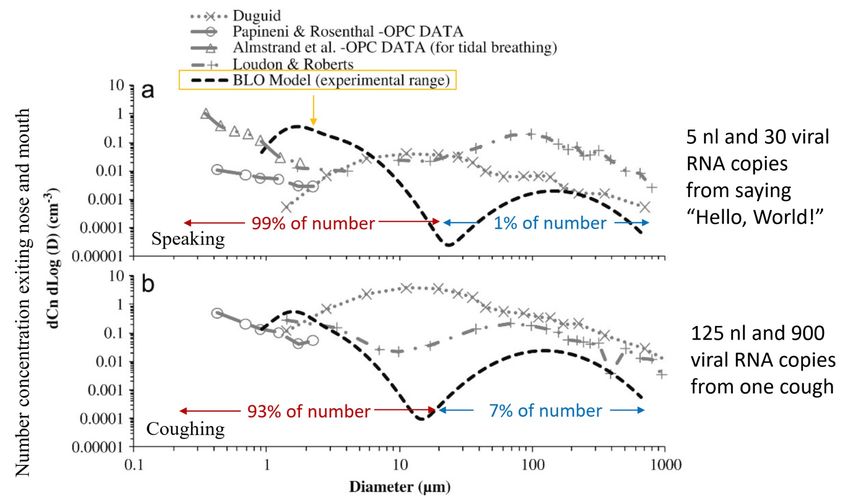
Human Respiratory Emissions of Particles

 Johnson et al., 2011, J. Aerosol Sci, 42, 839–851

Slide source: Linsey Marr, Airborne Transmission of SARS-CoV-2: A Virtual Workshop, Aug. 26, 2020

 3
SARS-CoV-2 in Indoor Air
 The virus in air is enveloped in respiratory fluid.
 There is evidence for SARS-CoV-2 in
 indoor particles across a range of sizes:

 0.1 µm

 Liu et al., 2020 Nature 582:557-560

 0.2 – 100 µm

 Lednicky et al., 2020 Int J Infectious Diseases 100:P476-482

www.nytimes.com/2020/08/11/health/coronavirus-aerosols-indoors.html 4
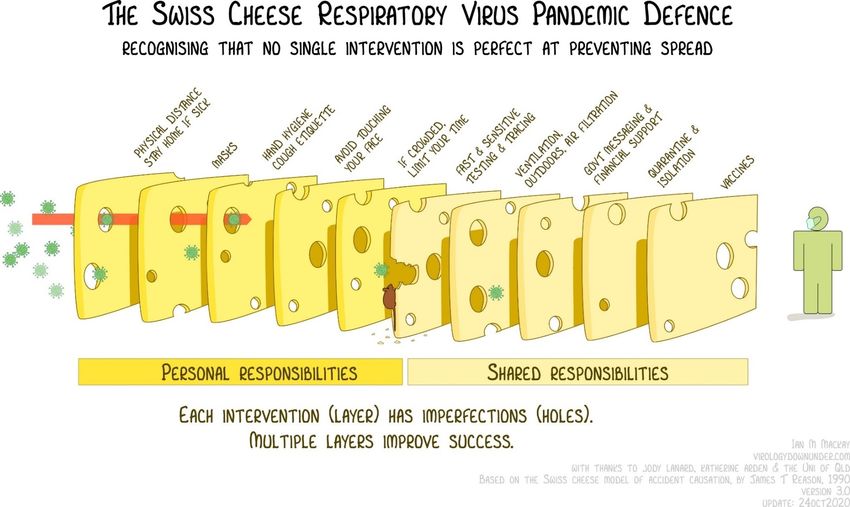
Need for Layered Risk Reduction

www.nytimes.com/2020/12/05/health/coronavirus-swiss-cheese-infection-mackay.html 5
Navigating the Air Cleaning Landscape

 6
Navigating the Air Cleaning Landscape
Air Cleaner Technology A uses reactive
molecules to destroy pathogens.
 Air Cleaner Technology B captures the
 smallest viruses, down to 100 nanometers.
Air Cleaner Technology C delivers 50% more
clean air than HEPA filters.
 Air Cleaner Technology D has been successfully installed
 in over 1,000 buildings, reducing particles by 20%.
Air Cleaner Technology D reduces viable
SARS-CoV-2 by over 99% in 60 minutes.
 Independent testing of Air Cleaner Technology E in a
 15 ft3 chamber demonstrates a net 4 log reduction of
 [P. surrogate] after 45 minutes.
 7
Goals for This Talk
• Understand prevailing guidance on air cleaning
• Understand air cleaning mechanisms of action and their
 potential magnitude of impacts on COVID-19
 transmission in indoor environments
• Understand air cleaner test standards and limitations
• Learn to critically review and interpret air cleaner test
 reports
• Learn to use tools to evaluate air cleaning technologies
• Answer common questions on air cleaning technologies

 8
Prevailing Guidance on Air Cleaning for COVID

 9
CDC Guidance

 “CDC recommends a layered approach to reduce exposures to SARS-CoV-2, the virus that
 causes COVID-19. This approach includes using multiple mitigation strategies”:
 Ventilation improvements, physical distancing, wearing face masks, hand hygiene,
 and vaccination.
 • “…potential target benchmark for good ventilation is CO2 readings below 800 ppm”

 Several “tools in the mitigation toolbox” include:
Improve central air filtration Use portable high-efficiency Supplement with UVGI when
• To as high as possible particulate air (HEPA) options for increasing room
• Refers to ASHRAE fan/filtration systems ventilation and filtration are
 limited
+ Cautionary language on ionization, dry hydrogen peroxide and chemical fogging disinfection

 www.cdc.gov/coronavirus/2019-ncov/community/ventilation.html 10
ASHRAE Guidance

 1. Public health guidance:
 • Follow CDC guidance on hand hygiene, masks, occupancy, etc.
 2. Ventilation, filtration, air cleaning
 • Minimum outdoor air (OA) flow rates, use MERV 13 or better filters
 • Only use air cleaners for which evidence of effectiveness and safety is clear
 3. Air distribution
 • Promote mixing (when directional airflow not required)
 4. HVAC System Operation
 • Maintain temperature, humidity, clean air supply, flush spaces
 5. System Commissioning
 • Verify systems are functioning as designed
www.ashrae.org/file%20library/technical%20resources/covid-19/core-recommendations- 11
for-reducing-airborne-infectious-aerosol-exposure.pdf
EPA Guidance

1. Increase ventilation with outside air
2. Improve natural ventilation
3. Use your HVAC system and consider upgrading filters
 • “By itself…not enough to protect yourself and your family”
 • Run continuously or for longer times
 • Upgrade to the highest efficiency filter that your system fan and filter slot
 can accommodate
4. Use a portable air cleaner if you have one
 • “By itself…not enough to protect people from COVID-19”
5. Increase ventilation with evaporative coolers/whole-house fans

www.epa.gov/coronavirus/indoor-air-homes-and-coronavirus-covid-19 12
Air Cleaning Types and Terminology

 13
Types of Air Cleaners Available
Portable/stand-alone air cleaners
 Vincent2

 EPA1 wired.com
 Narayanan and Yang 2021
 Phys. Fluids 33, 033307

In-duct air cleaners

 EPA1

 ASHRAE achrnews.com

1www.epa.gov/indoor-air-quality-iaq/air-cleaners-and-air-filters-home
2Vincent,
 14
 2020, Upper-room UVGI Air Disinfection, National Academies of Sciences
Types of Air Cleaning Technologies
“Subtractive” technologies Key parameters:
 • Mechanism of action: removing or • Airflow rate
 • Airflow relative to volume
 inactivating targeted contaminants from • Single-pass efficiency
 indoor air when they come in contact • Potential for byproduct
 with the technology formation (e.g., O3 with ESP)
 • Examples: filters, electrostatic precipitators (ESPs), sorbent media (for gases)

“Additive” technologies Key parameters:
 • Mechanism of action: adding • Type, concentration and dose
 of additives
 constituents to the air to remove • Potential toxicity of additives
 particles, inactivate microorganisms • Potential for byproduct
 and/or react with chemical contaminants formation (particles/gases)
 • Examples: ionizers, ozone, plasma, hydrogen peroxide, reactive oxygen species
 Many air cleaners use a combination of technologies! achrnews.com

1https://www.epa.gov/indoor-air-quality-iaq/guide-air-cleaners-home 15
Common Air Cleaning Test Standards
 Test Standards
 Air Cleaning Technology Target Pollutant(s)
 (Rating Metrics)
 Filters:
 ASHRAE 52.2 (MERV)
 ISO 16890 (ePM)
 Fibrous media filters Particles ISO 29463 (HEPA)
 Proprietary standards (FPR,MPR)
 Portable air cleaners:
 AHAM AC-1 (CADR)
 Electrostatic precipitators No rating; some ozone emission
 Particles
 (ESPs) standards (UL 2998)
 Ionizers, plasma, etc. Particles None specifically
 Ultraviolet germicidal Air: ASHRAE 185.1
 Microbial particles
 irradiation (UVGI) Surfaces: ASHRAE 185.2

 + Many devices/technologies are tested in non-standardized ways.
 achrnews.com

1www.epa.gov/indoor-air-quality-iaq/air-cleaners-and-air-filters-home 16
Air Cleaner Evaluation Matrix
• Ideal matrix of demonstrated performance metrics:
 Effectiveness Byproduct formation
 Particle Yes No
 Chemical Yes No
 Microbiological Yes n/a

• More common matrix of demonstrated performance
 metrics for a particular technology:
 Effectiveness Byproduct formation
 Particle Yes* Unknown
 Chemical Unknown Unknown
 Microbiological Yes* n/a
 *Yes, but it’s difficult to interpret the data (will revisit in subsequent slides).

 17
Quantifying Air Cleaning Impacts

 18
Mass Balances on Indoor Air
• Mass balance models allow for predicting the impacts of
 interventions on indoor contaminant concentrations.
• In words, a mass-balance is a statement of conservation
 of mass in which: Accumulation = Inputs – Outputs
 General approach tracks sources and losses in time to predict concentration:
 C = concentration (#/m3)
 Losses
 dC t = time (h)
 = S − LC S = sources (#/(m3-h))
 Sources
 dt L = losses (h-1)
 S
 Time-varying solution: C(t) = C0 e−Lt +
 L
 (1− e−Lt )

 S
 Steady-state solution: Css =
 L
 19
Indoor Air Mass Balance on SARS-CoV-2
Zero viral
 Where:
particles λ!" λ!"
outdoors = infectious virus in particles of diameter d (#/m3)
 '(")*'+"*'!( = infectious viral particle generation rate (#/h)
 = volume of the space (m3)

 λ!" = outdoor air exchange rate (1/h)
 #$% = infectious particle deposition loss rate (1/h)
 #$% '(")*'+"*'!( = viral particle inactivation rate (1/h)
 Air = clean air delivery rate (m3/h)
 cleaner

 = − ! "# − !$% − &'#()&*#)&"' ! −

 Sources Losses

 CADR: the volumetric flow rate of air (or equivalent),
 free of viral particles due to air cleaner
 • i.e., loss rate enhancement due to air cleaning

 20
Goal: High Effectiveness ( ) • Ultimate goal: achieve a high level of effectiveness ( ) o Comparison of indoor concentrations (or indoor/outdoor concentration ratios) with and without an air cleaning technology operation: .,012341556. The effectiveness, , of an air-cleaner is: = 1 − .,72012341556. No air Air cleaner cleaner Uncontrolled Controlled 21
Loss Mechanisms “Layer”
The solution to the mass-balance equation is:

 = 1 − , ) Where: = + + +
 ./01
 "# &'#()&*#)&"' !$% 2
where is the sum of the loss mechanisms: ventilation, inactivation, deposition, air cleaning
 • All terms have units of h-1 (per hour): interventions are additive (i.e., they “layer”)
Example at right: 300
 L = 1 h-1
• 75 m3 space

 1 µm infectious particles (#/m3)
 250 L = 6 h-1
• No viral particles initially (t = 0)
 At 1 h, ~75%
• No viral particles outdoors 200
 reduction in
• Emissions of 1 µm particles viral particles,
 150 or = 0.75
 containing infectious material
 ( = 600 #/min) 100
Baseline: = 1 h-1
 50
with interventions: = 6 h-1
 0
Higher leads to lower indoor 0 0.2 0.4 0.6 0.8 1
particle concentrations Time (h)
• Higher effectiveness ( )
 22
Increasing Loss Mechanisms in Buildings
 Losses, , in a residential space with increased outdoor air:
 7 Outdoor air, open windows/doors1, : ~5 h-1
 • Highly variable, not easily predicted
 6
 Virus inactivation2, -./01-2/1-3. : ~0.6 h-1
 5
L, loss rate (h-1)

 Particle deposition (1-4 µm)3, : ~0.1-0.8 h-1
 4
 4567
 3 No recirculation air cleaning4, : 0 h-1
 8
 2
 ./01
 1 Outdoor air ventilation + air cleaning ( "# + ) are
 2
 where largest increases in can usually be realized
 0 • This sum may be referred to as eACH: equivalent air
 changes per hour (h-1)

 1
 Johnson et al. 2004, JESEE 14:1–22; 2 van Doremalen et al. 2020, N Eng J Med 382(16):1564–1567; 3Hussein and
 Kulmala, 2008, Water Air Soil Pollut. 8:23–34 (2008); 4ANSI/AHAM AC-1
 23
Increasing Loss Mechanisms in Buildings
 Losses, , in a residential space with increased air cleaning:

 7 Outdoor air ventilation1, 3/ : ~0.5 h-1
 6
 Virus inactivation2, -./01-2/1-3. : ~0.6 h-1
 5
L, loss rate (h-1)

 Particle deposition (1–4 µm)3, : ~0.1-0.8 h-1
 4

 4
 3 Recirculation air cleaning , : ~5 h-1

 2
 ./01
 1 Outdoor air ventilation + air cleaning ( "# + ) are
 2
 where largest increases in can usually be realized
 0 • This sum may be referred to as eACH: equivalent air
 changes per hour (h-1)

 1
 Murray and Burrmaster 1995, Risk Analysis 15(4): 459–465; 2 van Doremalen et al. 2020, N Eng J Med 382(16):1564–
 1567; 3Hussein and Kulmala, 2008, Water Air Soil Pollut. 8:23–34 (2008); 4ANSI/AHAM AC-1
 24
Risk Reduction Targets and Tools

 25
Air Cleaning and Ventilation Are Additive

 www.cbsnews.com/news/covid-school-masks-ventilation/

 Adapted from Gettings et al. 2021

 1 2
 3

 1Ventilation only = open doors, open windows or fans
 2Air filtration only = using HEPA filters with or without UVGI and no ventilation
 3Ventilation and air filtration = both 1 and 2

Source: Gettings et al. 2021, CDC MMWR Vol. 70, May 21, 2021 26
Suggested Targets for Loss Rate
 Achievable using a combination of outdoor air ventilation and air cleaning

 Harvard Healthy Buildings1:
 4–6 h-1

 schools.forhealth.org/wp-content/uploads/sites/19/2020/08/Harvard-Healthy-
 Buildings-program-How-to-assess-classroom-ventilation-08-28-2020.pdf

 ASHRAE Standard 170:
 Min. 6 h-1 total (OA + SA with MERV 14)
 [Min. 2 h-1 from OA]2
1Allen et al. 2021 JAMA 325(20):2112–2113; 2ASHRAE Standard 170-2017 27
Reduce Risks by Increasing Loss Rate
 Mass-balance modeling informs risk models (e.g., using the Wells–Riley equation)1

 During a choir practice1: In three rooms, connected by HVAC2:

 Figure adapted from Miller et al.1
 Probability of infection (%)

 (h-1)

 Median emission rate Pease et al.2

 (h-1), total loss rate (ventilation, deposition,
 filtration, and inactivation)

1Miller et al. 2021, Indoor Air 31(2): 314–323; 2Pease et al. 2021, Building and Environment 107633 28
Air Cleaning vs. Ventilation: Cost Effectiveness
 For influenza transmission:
 “HVAC filtration appears more cost effective than outdoor air ventilation.”1
 Figure adapted from: Azimi et al.1

 MERV 13 at point of diminishing returns in
 cost/benefit trade-off

1Azimi et al. 2013 Building and Environment 70, 150–160 29
Online Tools for Risk Evaluation
 Wells–Riley model calculator
 tinyurl.com/covid-estimator

 NatGeo

 Multi-mode transmission model

covid-19.forhealth.org/covid-19-transmission-calculator/

 Inhalation dose model
 safeairspaces.com/safeairspaces-estimator

 30
Interpreting Air Cleaner Performance Data

 31
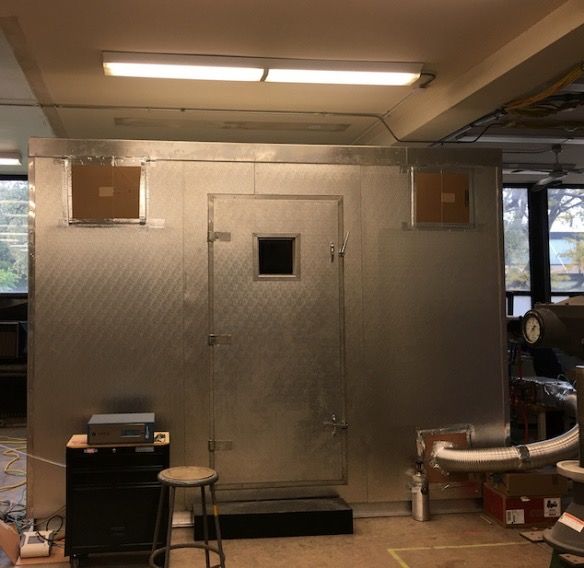
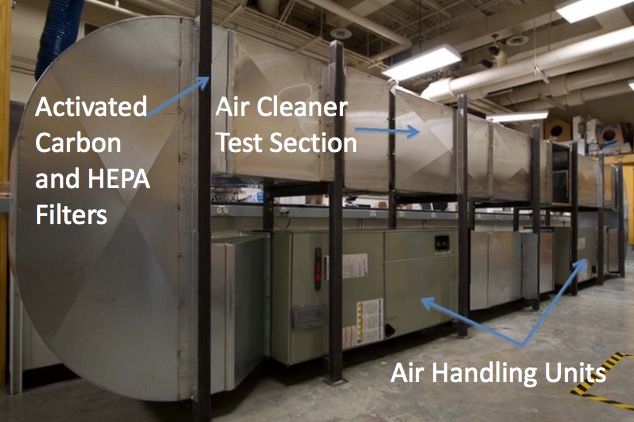
What Information Is Available to Increase L?
 All air cleaners can be evaluated with “pull down” test method.1,2
 • In controlled chamber: injection, static, decay periods
 o With air cleaner on, repeat with air cleaner off
 o Used for particles,1,2,3 gases,4,5,6 microbes7

 Air cleaning
 process

 )$7) = test chamber volume

Compare loss rates with air cleaner (“ ”) on and off
• Change in loss rates is due to air cleaner, if other conditions held constant

 = "# + &'#()&*#)&"' + !$% = "# + &'#()&*#)&"' + !$% +
 )$7)

 − = Where: “ac” = air cleaner
 )$7)
1ANSI/AHAM AC-1; 2Offermann et al. 1985, Atmos. Environ. 19(11):1761–1771; 3Sultan et al. 2011 HVAC&R Res. 17(4):513–525
4Daisey and Hodgson 1989, Atmos. Environ. 23(9):1885–1892; 5Chen et al. 2005, ASHRAE Trans. 111 P1:1101–1114 32
6Howard-Reed et al. 2008 Build Environ 43(3):368–377; 7Schuit et al. 2020, J. Infectious Dis. 222(4): 564–571
What Information Is Available to Increase L?
 For a subtractive portable air cleaner:
 Example testing of a mechanical filter portable air cleaner:

Outcome of testing: #( "' − #( "99 = = )$7) #( "' − #( "99
 )$7)

built-envi.com/portfolio/air-cleaner-testing/ 33
Example Portable Air Cleaner Test Data
 For portable air cleaners (additive or subtractive):
 Figures from EPA Guide to Air Cleaners in the Home1

 7%#($ &'7)#::$!

 CADR

 50 to 500 CFM typical
 Air
 cleaner

 L (or eACH) in space installed depends on
 sizing of air cleaner.
CADR required for 80% effectiveness @ steady state:
 AHAM recommendation for 80% steady-
 state concentration reduction:
 ;
 • > < × ( 2)
 Yields eACH of ~5 h-1

 1www.epa.gov/indoor-air-quality-iaq/air-cleaners-and-air-filters-home
 34
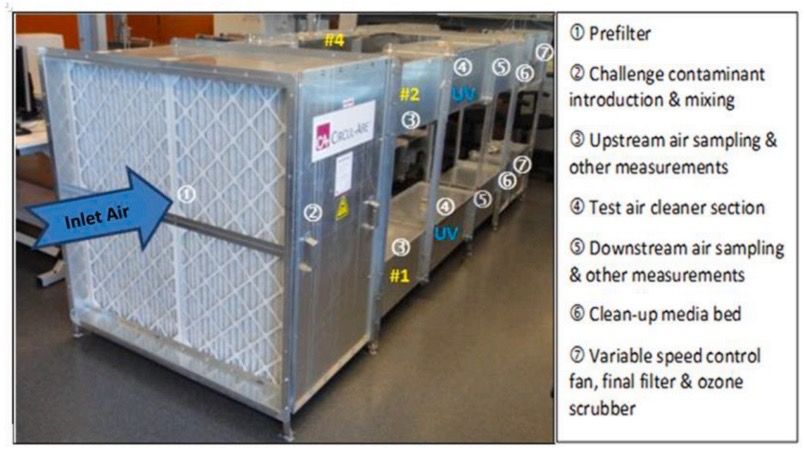
What information is available to increase L?
For additive (in-duct and portable) air cleaners
• Generally tested following a “pull down” method (similar to portable air cleaners)
• Albeit often via non-standardized test methods
• Potential for byproduct formation is seldom reported

 In-duct
 unit:
 Example additive electronic air cleaner Common test
 setup: in-duct
 additive air
 - cleaner in front
 + - of fan
 Portable - - +
 ++ + + -
 +
 unit:
 -
 - -
 +

 Boeing test report: Use of Bipolar ionization

Manufacturer-provided data may not be directly in the form of CADR

 35
What Information Is Available to Increase L?
 For in-duct subtractive systems (e.g., filtration, UVGI)
 • L can be estimated from single-pass efficiency ( )1,2 and flowrate ( ?$(&?( ).

 ASHRAE 52.2 MERV1 Table from NAFA2

 "#$%"$

 =!>"#$%"$
 #( =
 2&'($# %)&*(++#,

 = volume of the space (m3)
 = particle removal efficiency (%)
 "#$%"$ = recirculation air flow rate (m3/h)

 L (or eACH) realized in space depends on:
 • Increase MERV rating, if possible (MERV 13)
 • Flow rate (and static pressure) for ↑
1ASHRAE 52.2-2017; 2NAFA: www.nafahq.org/understanding-merv-nafa-users-guide-to-ansi-ashrae-52-2/
 36
What Information Is Available to Increase L?
 For in-duct subtractive systems (e.g., filtration, UVGI)
 • Single-pass efficiency ( ) can be estimated from MERV and viral particle distribution.1
 Typical MERV efficiency curves: Estimating viral particle removal efficiency:
 100%
 90%
 80%
 Removal efficiency (%)

 70%
 60%
 50%
 40%
 30% MERV 6
 20% MERV 8
 MERV 10
 10%
 MERV 14
 0%
 0.1 1 10
 Par3cle diameter (µm)

For a range of typical commercial building supply airflow rates (0.3 to 1 CFM/ft2):
• MERV 13 (~80% viral removal efficiency) offers ~0.25-0.8 CFM/ft2 in CADR
• For a 1000 ft2 space with 10 ft high ceilings: ~250-800 CFM CADR & ~1.4-4.8 eACH
 =!>"#$%"$
 =
 2&'($# %)&*(++#,
1Azimi et al. 2013 Building and Environment 70, 150-160
 37
What Information Is Available to Increase L?
 For in-duct subtractive systems (e.g., filtration, UVGI)
 • L can also be estimated from an in-situ (in the space installed) pull down test.1,2

 MacIntosh et al. 2008 Stephens and Siegel 2012

1MacIntosh et al. 2008, J Air Waste Man Assoc 58(11):1474–1482; 2Stephens and Siegel 2012, Aerosol Sci Technol 46(5):504–513
 38
What Information Is Available to Increase L?
• Knowing CADR (or L) of air cleaner allows design
 of intervention for target effectiveness.
 o Target effectiveness may not be realized.
 o Important to have design based on sound principles.
• What about air cleaners that don’t report CADR?
 Typical example:
 99% removal of PM2.5/SARS-CoV-2 in 1 hour

 How can we translate this to evaluate whether the air
 cleaner will be effective in the target space?
 39
Navigating Language of Test Reports
1. Removal measurements, with air cleaner on (test) and off (control)
 • Concentrations
 • % removal
 • log reduction
 • Net log reduction
2. Time of each measurement of removal
3. Volume of test chamber
4. Ensure consistency of conditions between test and control
 • Environmental conditions (e.g., temperature, humidity, light)
 • Challenge concentration
5. Operating conditions during test
 • What device settings?
 • For additive: added constituent concentrations and locations
 measured

 40
Navigating Language of Test Reports
• Language used in test reports:
 o Concentration: absolute measurement
 D.E0/0
 !,#) 7"A$ )&A$ for example: 1×10C AF

 o % reduction: relative measurement
 !,&'&)#: − !,:#)$? )&A$
 % =
 !,&'&)#:
 o log reduction: relative measurement on log scale
 B,,+(*#" *%.#
 log reduction = −log
 B,,%)%*(+

 o Net log reduction: relative measure, log scale, control accounted
 B,,+(*#" *%.# B,,+(*#" *%.#
 Net log reduction = −log − −log
 B,,%)%*(+ B,,%)%*(+
 )$7) ("')?":

 41
Collecting Test Data: Example 1 Aerosolized Escherichia coli inactivation test in a 500 ft3 chamber 1. Collect performance data: concentration, time, chamber volume Hypothetical air cleaner test results: Test report data Concentration Time (CFU/m3) (min) Control Test 0 5000 5000 15 4200 2700 30 3300 1200 At 1 h, ~99% reduction in E. 45 2700 400 coli ( = 0.99) 60 2000 100 42
Analyzing Test Data: Example 1
 Aerosolized E. coli inactivation test in a 500 ft3 chamber

2. Fit concentration data to a first-order exponential decay model:
 Test report data Loss rate
 calculations
 Concentration
 Time (CFU/m3) ln( ',) / ',)*+)
 Time
 (min) Control Test (min) Control Test
 0 5000 5000 0 0 0
 15 4200 2700 15 -0.174 -0.616
 30 3300 1200 30 -0.416 -1.427
 45 2700 400 45 -0.616 -2.526
 60 2000 100 60 -0.916 -3.912
 S
 C(t) = C0 e−Lt +
 L
 (1− e−Lt )
 !,)
 = −
 !,)G"

 43
Interpreting Test Data: Example 1
 Aerosolized E. coli inactivation test in a 500 ft3 chamber

3. Plot transformed data 4. Determine CADR from loss rates:
 and estimate loss rates

 = )$7) #( "' − #( "99

 = 500 < × 0.0145 − 0.0593

 <
 = 22.4 ≈

 44
Scaling Test Data: Example 1
 Aerosolized E. coli inactivation test in a 500 ft3 chamber
5. Scale the results to the targeted installation space
• Use the volume of the space the device will be installed:

 Assume we are designing
 this air cleaner for use in a
 conference room:
 15 ft x 25 ft x 10 ft = 3750 ft3

 g 60
 22.4 ×
 = = 1 ℎ = . h
 cde06 f2c3e556. 3750 g
 • Typical target is > 5 h-1
 • Air cleaner is undersized for the space
 45
Key Issue: Test Chamber Volumes
 Resulting CADR scales with test chamber volume:
 = )$7) #( "' − #( "99

Small chamber Medium chamber Large chamber Field testing
 (< 1 m3) (2-10 m3) (10-50 m3) (>50 m3)
 [< 35 ft3] [70-350 ft3] [350-1750 ft3] [> 1750 ft3]
 A wide range of chamber test volumes are used in practice
 • Especially in non-standardized test approaches
 46
CADR Scales With Volume of Test Chamber
 Consider the following test result: What is the CADR if the tested
 • 99.99% removal in 30 minutes in a chamber with volume…
 CADR
 10
 net log [net %
 10 ft3 ? 3 cfm
CADR per test chamber volume

 removal removal]
 1 [90%]
 1
 2 [99%] 100 ft3 ? 30 cfm
 (cfm/ft3)

 3 [99.9%]

 0.1 4 [99.99%]
 5 [99.999%]
 6 [99.9999%]
 1000 ft3 ? 300 cfm
 0.01
 0 15 30 45 60 75 90
 Time in chamber (min)

 A wide range of CADRs can all claim 99.99% removal in
 30 minutes, depending on test chamber volume.
 47
Typical CADR in a 500 ft3 Chamber
 What % removal is achieved in a 500 ft3 test chamber
 with a typical 250 CFM CADR air cleaner?
 1
 !,) ./01
 0.8 = 2 )
 ,
Concentration

 !,)G"
 Normalized

 0.6
 99.99997% removal @ 30 minutes
 0.4 • More than 6-log removal
 0.2

 0
 0 10 20 30
 Time (minutes)

 48
Tools to Support These Calculations

“As with all emerging technologies, consumers are encouraged to exercise caution
and to do their homework.” CDC, Ventilation in Buildings, June 2, 2021

 We developed ACE IT to help you do your homework

 www.pdx.edu/healthy-buildings/ace-it
 49
Example with ACE IT

 Example with ACE IT
 SARS-CoV-2 inactivation test
 conducted in a 1000 ft3 chamber
 Test report data
 Log reduction
 Time
 (min) Control Test
 0 0 0
 10 0.4 2.2
 20 0.9 4.6
 30 1.4 6.1
 To be installed in a 3750 ft3 space
 • e.g., 375 ft2 w/ 10 ft ceilings

 50
Other Considerations

 51
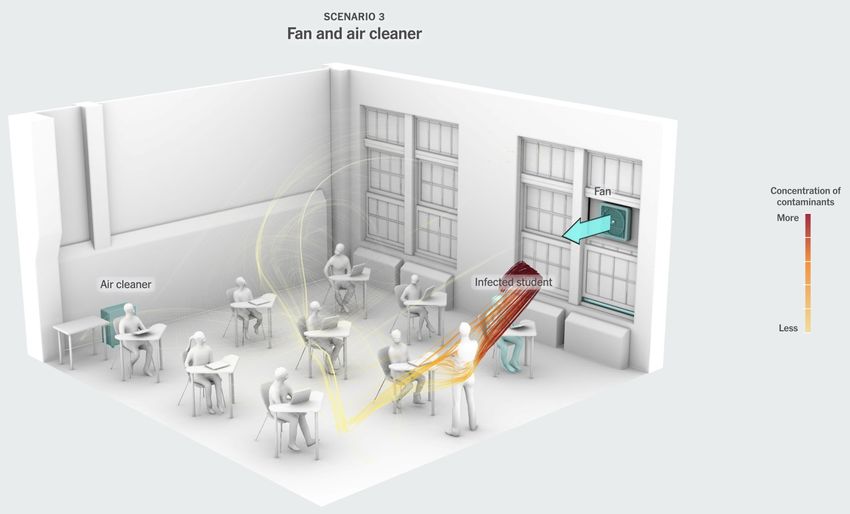
Air Cleaner Placement and Performance

www.nytimes.com/interactive/2021/02/26/science/reopen-schools-safety-ventilation.html 52
Noise Affects Use of Portable Air Cleaners
 • Portable air cleaners are often used
 less frequently over time.
 o Some studies have noted/speculated
 that may be because of noise.
 Sulser et al. 2009 Int Arch All Immunol;
 Batterman et al. 2012 Indoor Air

 • EPA maintains that interference and
 annoyance occurs at indoor noise
 levels above 45 dBA.*

 • Many portable air cleaners exceed
 this threshold.
 o But quantified noise is not used as a
 standardized performance factor in the
 United States and is not routinely
 available on product packaging. www.dot.ca.gov/dist2/projects/sixer/loud.pdf

*Source: archive.epa.gov/epa/aboutepa/epa-identifies-noise-levels-affecting-health-and-welfare.html 53
Noise Affects Use of Portable Air Cleaners
 • Portable air cleaners are often loudest at their most effective
 setting (e.g., their highest flow setting).1
 Air cleaner #1: Max speed

 Air cleaner #2: Max speed

 Air cleaner #1: Min speed

 Air cleaner #2: Min speed

1Peck et al. 2016 Building and Environ 98:21–29 54
Ozone Emissions From Electronic Air Cleaners
• Some electronic air cleaners emit ozone (O3) during operation.1
 • Ensure products meet UL 2998 standard (
Potential for Byproduct Formation
 +
 - -
 - - +
 ++
 Example of byproduct measurements2
 + + -
 + - -
 -
 +

 250 Other compounds
 Additive air cleaner
 Other alcohols
 Acids
 200

 Volatile organic compound level (μg/m3)
 Aldehydes
 m-,p-Xylene

 Challenge Mix: Toluene
 Methyl methacrylate
 VOCi 150
 Heptane
 VOCj Tetrahydrofuran
 Ethyl Acetate
 100
 Products formed: Methyl ethyl ketone
 VOCm Vinyl acetate
 VOCn 50
 Acetone*

 Others?1 Isopropanol*
 Trichlorofluoromethane
 Ethanol*
 0
 Dichlorodifluoromethane
 Upstream Downstream

1
Liu et al. 2020, Indoor Air 31:220-228; 2Zeng et al. 2021, Building and Environment 195:107750 56
Potential for Byproduct Formation
• Tests of 12 electronic (additive air cleaners)1
• Three general mechanisms:
 1. Photocatalytic oxidation (PCO)
 2. Non-thermal plasma (NTP)
 3. Ozonation

• Results show acetone removal
 efficiency to PCO systems scales
 linearly with byproduct
 generation rate1

• CADRs across tested air cleaners
 for methyl ethyl ketone (MEK)
 ranged 0–68 m3/h

1Lee et al. 2021, Building and Environment 196(107782) 57
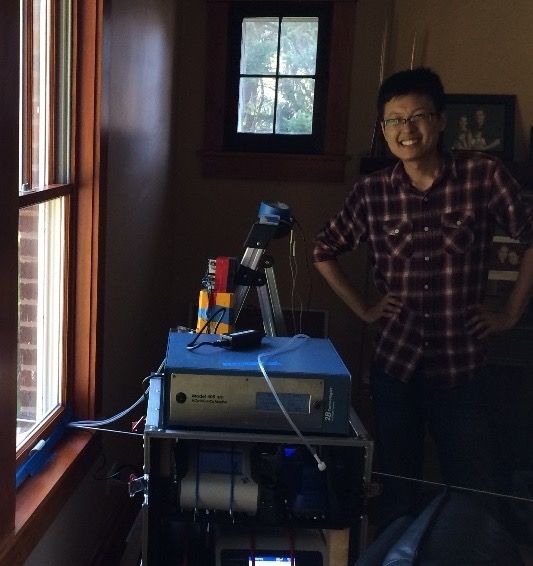
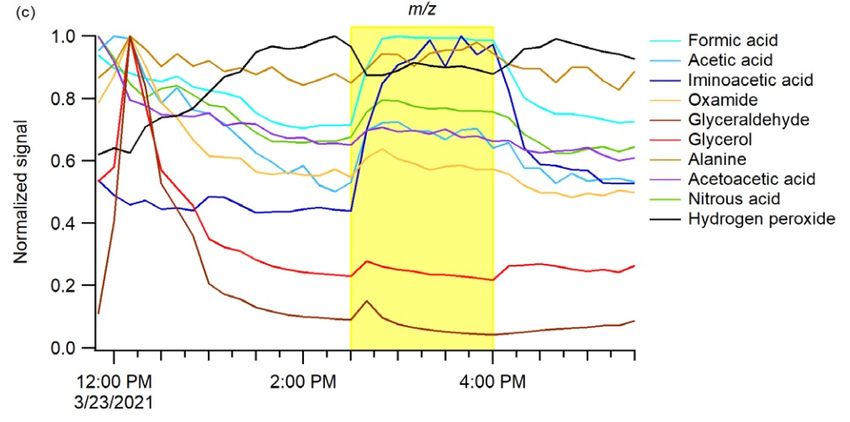
Potential Byproduct Formation

 Yellow shading: device is on

Study (pre-print) of oxidant generating air
cleaner operating in an office1:
• Enhanced low molecular weight OVOCs
 o Top, shown in yellow
• Increases in particle number + volume
 o Bottom, shown in yellow

1
Joo et al., medrxiv, doi.org/10.1101/2021.06.01.21258186 58
Closing Thoughts and Recommendations

 59
What to Ask of Laboratory Test Reports?
• Seek the following details from laboratory reports provided on
 air cleaning technology efficacy:
 o Were any standard test methods used? And were they appropriate?
 o Volume of test chamber/environment
 o Were air samples or surface samples collected?
 o What were the constituent types and concentrations used?
 o For additive technologies, how much of which additives were present?
 o Were byproduct tests performed (and under realistic) conditions?
 o What were the control and test loss rates?
 o What were the mixing conditions and airflow rates?
 o Did the test accurately reflect in-situ operation?
 ─ Air cleaner settings, e.g., fan flowrate
 ─ Added constituent concentration and locations of measurements
 o What instruments were used?
 o What is the equivalent CADR resulting from the test?
 60
What to Ask of Field Test Reports?
 • Seek the following details from field-test reports provided on air
 cleaning technology efficacy:
 o Were any field test method standards or guides used? 1,2,3
 o Were indoor and outdoor measurements conducted simultaneously?
 o Were there appropriate controls?
 o Were there differences in test conditions with air cleaner on and off?
 ─ How was this verified? Air change rates controlled/constant? Occupancy patterns?
 o Were appropriate (i.e., sufficiently sensitive) instruments used?
 o Were there sufficient data and appropriate statistical significance tests?
 o Were upstream/downstream measurements made?
 o Were in-situ CADR measurements made?
 o Were mechanisms that contribute to loss rates teased out?
 ─ e.g., separating air cleaning, deposition, and inactivation?
 o For additive technologies, how much of which additives were present?
 o Were byproduct tests performed (and under realistic) conditions?

1
AIHA, The IAQ Investigator’s Guide; 2NIOSH Guidance for indoor air quality investigations; 3Chan and Singer 2014, LBNL-6607E 61
Air Cleaning: Charting a Path Forward
Ongoing Research Needs:
• Fundamental studies that elucidate underlying mechanisms of action
 of air cleaning technologies
 o Manufacturers can support by endeavoring to as clearly as possible
 explain mechanism
 o Manufacturers should explain mechanism to various stakeholders
 ─ Distributors, purchasers, installers/operators and “end-users”
• Studies in well-controlled environments
 o Chamber studies with test conditions, challenges clearly explained
• Studies in less-well controlled environments
 o Field studies are needed to test understand, evaluate real-world
 efficacy and impacts

 62
Suggestions for Improving Test Standards
• Standards are lacking for many aspects of air cleaners.

 Effectiveness Byproduct formation
 Particle ? ?
 Chemical ? ?
 Microbiological ? -

 Effectiveness:
 • Standards and methods exist, but incomplete
 Byproduct formation:
 • Generally non-existent

 63
Acknowledgements
• Our research groups @ Portland State and Illinois Tech

 web www.built-envi.com
 email brent@iit.edu twitter @built_envi www.pdx.edu/healthy-buildings/indoor-air-quality-
 and-healthy-buildings

• Our collaborators, past and present

• U.S. EPA
 o Laura Kolb and Vito Ilacqua

 64
Navigating the Landscape of Air
Cleaning Technologies for COVID-19
 Brent Stephens, Ph.D.
 Professor and Department Chair
 Civil, Architectural, and Environmental Engineering
 Illinois Institute of Technology
 Chicago, IL

 Elliott Gall, PhD
 Associate Professor
 Mechanical and Materials Engineering
 Portland State University
 Portland, OR
You can also read