Telefónica Deutschland Investor Presentation - November 2015 - Creating the Leading Digital Telco

Page created by Jeanne Nguyen
 
CONTINUE READING
Telefónica Deutschland Investor Presentation - November 2015 - Creating the Leading Digital Telco
Creating
                                                   the
                                                   Leading
                                                   Digital
                                                   Telco

Telefónica Deutschland Investor Presentation
                                                   November 2015

                           Public – Nicht vertraulich
Telefónica Deutschland Investor Presentation - November 2015 - Creating the Leading Digital Telco
Disclaimer

   This document contains statements that constitute forward-looking statements and expectations about Telefónica Deutschland Holding AG (in the
   following “the Company” or “Telefónica Deutschland”) that reflect the current views and assumptions of Telefónica Deutschland's management with
   respect to future events, including financial projections and estimates and their underlying assumptions, statements regarding plans, objectives and
   expectations which may refer, among others, to the intent, belief or current prospects of the customer base, estimates regarding, among others, future
   growth in the different business lines and the global business, market share, financial results and other aspects of the activity and situation relating to
   the Company. Forward-looking statements are based on current plans, estimates and projections. The forward-looking statements in this document can
   be identified, in some instances, by the use of words such as "expects", "anticipates", "intends", "believes", and similar language or the negative thereof
   or by forward-looking nature of discussions of strategy, plans or intentions. Such forward-looking statements, by their nature, are not guarantees of
   future performance and are subject to risks and uncertainties, most of which are difficult to predict and generally beyond Telefónica Deutschland's
   control, and other important factors that could cause actual developments or results to materially differ from those expressed in or implied by the
   Company's forward-looking statements. These risks and uncertainties include those discussed or identified in fuller disclosure documents filed by
   Telefónica Deutschland with the relevant Securities Markets Regulators, and in particular, with the German Federal Financial Supervisory Authority
   (Bundesanstalt für Finanzdienstleistungsaufsicht – BaFin). The Company offers no assurance that its expectations or targets will be achieved.
   Analysts and investors, and any other person or entity that may need to take decisions, or prepare or release opinions about the shares / securities
   issued by the Company, are cautioned not to place undue reliance on those forward-looking statements, which speak only as of the date of this
   document. Past performance cannot be relied upon as a guide to future performance.
   Except as required by applicable law, Telefónica Deutschland undertakes no obligation to revise these forward-looking statements to reflect events and
   circumstances after the date of this presentation, including, without limitation, changes in Telefónica Deutschland’s business or strategy or to reflect
   the occurrence of unanticipated events.
   The financial information and opinions contained in this document are unaudited and are subject to change without notice.
   This document contains summarised information or information that has not been audited. In this sense, this information is subject to, and must be
   read in conjunction with, all other publicly available information, including if it is necessary, any fuller disclosure document published by Telefónica
   Deutschland.
   None of the Company, its subsidiaries or affiliates or by any of its officers, directors, employees, advisors, representatives or agents shall be liable
   whatsoever for any loss however arising, directly or indirectly, from any use of this document its content or otherwise arising in connection with this
   document.
   This document or any of the information contained herein do not constitute, form part of or shall be construed as an offer or invitation to purchase,
   subscribe, sale or exchange, nor a request for an offer of purchase, subscription, sale or exchange of shares / securities of the Company, or any advice
   or recommendation with respect to such shares / securities. This document or a part of it shall not form the basis of or relied upon in connection with
   any contract or commitment whatsoever.
   These written materials are especially not an offer of securities for sale or a solicitation of an offer to purchase securities in the United States, Canada,
   Australia, South Africa and Japan. Securities may not be offered or sold in the United States absent registration under the US Securities Act of 1933, as
   amended, or an exemption there from. No money, securities or other consideration from any person inside the United States is being solicited and, if
   sent in response to the information contained in these written materials, will not be accepted.

                                                                                  2                   Public – Nicht vertraulich
Telefónica Deutschland Investor Presentation - November 2015 - Creating the Leading Digital Telco
Telefonica Deutschland is setting the pace to become the
Leading Digital Telco

                        1
                            Well positioned to lead the most attractive
                            European telco market

                        2
                            Strong network & distribution assets to
                            provide the best digital customer experience

                        3
                            Enhanced profitability and cash flow
                            generation from a clear integration plan

                        4
                            Strong value proposition for Telefónica
                            Deutschland shareholders

                                3         Public – Nicht vertraulich
Telefónica Deutschland Investor Presentation - November 2015 - Creating the Leading Digital Telco
The Leading Digital Telco: Our priorities and success factors                                                             1

                  Keep the                             Integrate                                 Transform
                  Momentum                             quickly                                   the company

                                              Superior customer
        Offer best high speed                                                           Achieve operational
                                             experience throughout
          access experience                                                                  excellence
                                               their digital journey

                                                                                     Synergies

                                                                                                                Improve
                                                                                                          Optimise
                                                                                     Operating
                                                                                      model          Simplify

    Golden grid for 2G/3G + LTE roll-out   Peace of mind, multi-channel &          Synergies & lean operating model
      + access to best VDSL platform                digital first

                                                        4               Public – Nicht vertraulich
Telefónica Deutschland Investor Presentation - November 2015 - Creating the Leading Digital Telco
Telefonica Deutschland is well positioned to lead the most                                                                                                             1
attractive telco market in Europe

             Rational and balanced                                                   Infrastructure-based                                Steady adoption
               market structure1                                                          competition                                   of a digital lifestyle
                                                                           LTE device penetration in % vs. avg.                  Mobile customers using smartphones
                                                                           3G/4G data usage in MB in 2015 FC2                    for video streaming in %3

      (combined)                                                                                                                                 +24pp.
                                                                                                +40%
              30%
                                                37%
                                                                                                                                      2011/12             Q2 2015

                                                                                                                                 3G/4G avg. data usage in Germany2
                                                                      LTE device
                                                                      penetration         24%            34%
                                                                                                                                                 +30%
                          33%
                                                                                          GER           Other
                                                                                                     WE countries
                                                                                                                                   2012      2013    2014    2015 FC

      Non-disruptive pricing for tiered                                    Further opportunities ahead from                     Trend to 1 Gb/month; free VoD4
       mobile data portfolios                                                steady LTE adoption                                   as main usage driver
      Stable ~30% households with                                          Mobile (3x) and fixed (2x)                           Digital customers & households
       converged fixed & mobile                                              platforms for high speed access                       demand for quality

 1   Market share of MSR based on reported financials by MNOs for 1 HY 2015 & TEF D pro forma
 2   Source: Analysys Mason Report; countries: UK, Netherlands, Sweden & Germany
 3   Source: Internal representative market study                                                5                  Public – Nicht vertraulich
 4   VoD: Video on Demand
Telefónica Deutschland Investor Presentation - November 2015 - Creating the Leading Digital Telco
Successful multi-brand & mobile data-centric strategy in a                                                     1
highly segmented mobile market

              A clear multi-brand set up          Focused commercial approach, leveraging
          leveraging densest mobile network                  upsell potential
                                                                                                   Premium
                                                                             Tip          XL        50 Mbps

                                                                                 L      50 Mbps     10 GB
                                                                 M                       5GB        €79.99
                                                                            50   Mbps
                                                    S           21.1         3 GB       €49.99
           Premium                                 21.1
                                                                Mbps
                                                                            €39.99
            Brands                                 Mbps         1GB
                                                  200 MB                    + 1 SIM     + 2 SIMs    + 2 SIMs
                                                               €29.99       + EU        + EU        + EU
                                                                            roaming     roaming     roaming
                                                  €19.99

     Secondary
      Brands

Partner
Brands

                                              6            Public – Nicht vertraulich
Telefónica Deutschland Investor Presentation - November 2015 - Creating the Leading Digital Telco
Monetisation of mobile data: Growth potential remains intact                                                                                                  1

      Music & video streaming continues to grow                                              Continued progression of data automatic
 Traffic (TB/day)                                                                         O2 Blue All-in portfolio (dynamics within opted-in base)

                                                                          33k
                                  +11%                                Hours/day

                                                                                                                     Automatic data allocation events
                                                                            60k                                                  (% of customers)
      Music                                                               Hours/day

      Video
                                                                                                                      54%           66%            47%

                    Q2 ‘15                      Q3 ‘15                                         CB opted-in       1 snack          2 snacks       3 snacks

        National roaming and LTE driving usage                                             Ongoing improvement of tariff adoption mix
 Average data usage for O2 consumer LTE customers1 (MB)                                   Share of Gross Adds in O2 Consumer postpaid
 LTE
 customers
                  5.1m                  6.1m                       7.0m                          >1 GB
Telefónica Deutschland Investor Presentation - November 2015 - Creating the Leading Digital Telco
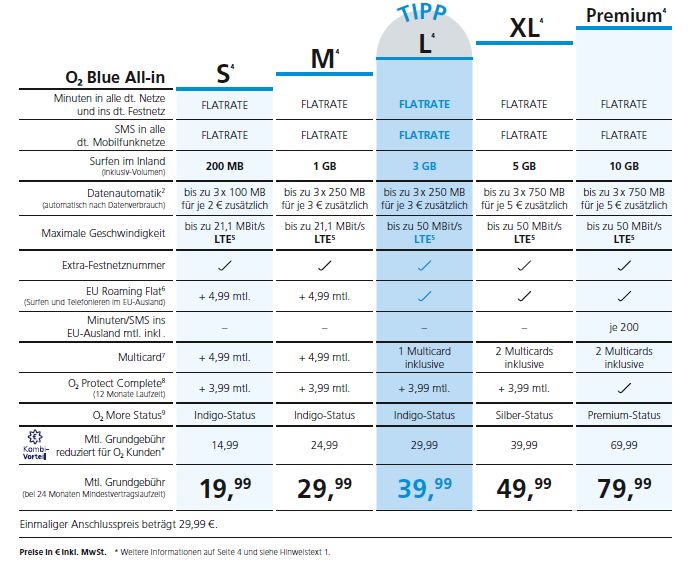
Enhanced network perception from 3G national roaming                                                                2
and LTE expansion

      Best network experience in 3G and 4G …                       … with positive reviews from specialised media

                                                                    User-driven network test (June 2015)
                                                                    3G national roaming key for improved ratings
                                                                    O2 customers showing strongest satisfaction

  Best-in-class 3G network with national roaming
    90% 3G outdoor coverage
    Up to 42 Mbps download speed (HSPA+)
    Driving 5% to 10% increased data usage in newly covered
     3G areas

  Accelerated value-driven LTE network rollout
    Good progression to reach 2015 coverage target of 75%
    Voice-over-LTE since April 2015

                                                               8           Public – Nicht vertraulich
Telefónica Deutschland Investor Presentation - November 2015 - Creating the Leading Digital Telco
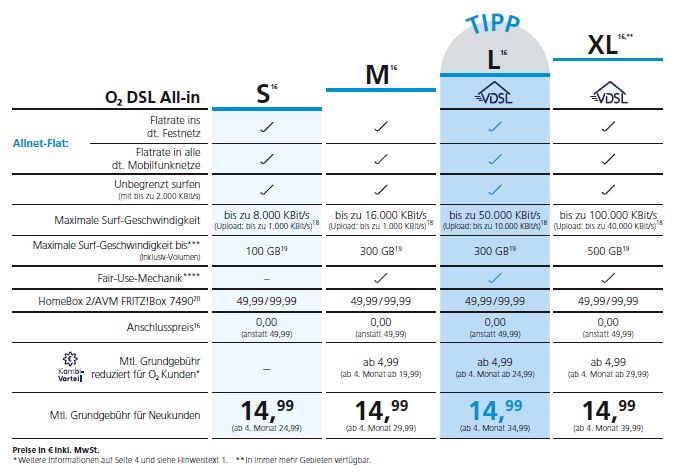
The right fixed infrastructure model to complement our                                                                                                             2
mobile network for the best high speed access experience

       Access to best available fixed NGA1 network –                                                            With a very competitive bundled offer
                  scalable & future-proof                                                                                 “Kombi – Vorteil”

     NGA coverage targets                              Maximum speed                                       O2 DSL all-in
     (% of covered households, YE)                     (Up- & Download, Mbps.)                             (Download speed, Mbps.)

                                                             Download         Upload
                                                                                                                                               XL
                             80%                                                 250
                                                                                           Super
                                                                                          Vectoring                                            100
                                                                                                                                               Mbps
                                        +35pp                                    100                                                   L
           45%                                                                                                                                €39.99
                                                                                                                                      50
                                                                                                                           M         Mbps
                                                           50
                                                                                                                S
                                                                                                                          16
                                                                                          40                             Mbps
                                                                                                                8                    €34.99
                             VDSL
           VDSL                                                                                                Mbps     €29.99
                           Vectoring
                                                                   10                                         €24.99

           2014            2018                               VDSL           VDSL Vectoring
                          ambition

  Immediate & nationwide access to DT’s NGA rollout                                                       Flexible aggregation of fixed & mobile lines with
                                                                                                            progressive discounts based on value (up to EUR 30)
  Regulated access/pricing terms
                                                                                                           Active cross-selling of fixed propositions to former
  Coordinated NGA planning and decommission of own
                                                                                                            E-Plus customer base
   DSL-ULL

 1   NGA: Next Generation Access, including VDSL, Vectoring and future FTTX deployments

                                                                                                      9                Public – Nicht vertraulich
Best sales & service experience through extensive multi-                                                                     2
channel retail and digital approach

     Multi-channel to maximise efficiency                 “Digital first” for every customer interaction

                                                            Web/mobile portals                          Apps
                        Own
                      branded                                                                 Mein O2 App   Data check app
                       shops

         Online &
         telesales
                                    Premium                     Chats/Forums                      Social media
                                    partners                   Base
                                                                           O2 Forum
                                                            Service chat

Direct                                         Indirect
          Social
          media                                              Largest physical distribution reach in the
                                   Other & e-
                                    retailers                 market

                        Large                                Our priority is to reach operational excellence
                     indirect/SP                              in customer service
                                                             Shop footprint reduction (own branded &
                                                              partner shops) by 1/3rd
                                                             Increasing relevance of own online channels
                                                             O2 portfolio distributed in BASE branded shops

                                                     10          Public – Nicht vertraulich
Expected synergies to exceed €5bn (NPV1)                                                                                                                                 3
Run-rate of Operating Cash Flow synergies of ca. €800m in year 5

                            Leverage and scale effects of broad distribution
     Distribution            network and customer service organisations                                       In €bn                                           % of
                                                                                                                                                             operating
           &                Optimisation of retail footprint resulting in                                                                                   synergies
      customer               reduction of rent and overhead                                                   Distribution &
       service                                                                                                Customer Service    1.1
                            Focus on digital customer touch points for sales
                             and service initiatives
                                                                                                              Network             1.7
                            Improved quality & capacity in 4G with reduced
                             CapEx requirement                                                                SG&A                         0.8
                            Consolidation of 2G/3G access networks,
                             backbone and backhaul
       Network                                                                                                OpEx                               3.6           77%
                            Reduction of ~14,000 sites to reach “golden grid”
                            Leverage scalable cooperation with Deutsche
                             Telekom regarding fixed line services                                            CapEx                               1.9          42%
                            Overall improved network perception
                                                                                                              Integration Costs                        0.9    (19%)
                            Elimination of duplicities in organisation
         SG&A               Transformation towards lean and digital                                          NPV of oper.
                                                                                                              Synergies                                4.6
                            Focused advertising & marketing spend
                                                                                                              Revenue &
                            Additional cross- and upsell opportunities                                       Other
                             in consumer and SME
      Revenue
                            Cross selling opportunity for fixed BB                                           NPV of revenue &
      and other
                                                                                                              Oper. synergies
                            Upside potential from strong wholesale
                             component

Notes:
1 Calculated as the sum of the present values of forecasted future cash flows including the so-called

  “terminal value” (NPV of expected future cash flows beyond the explicit forecast horizon) after tax.   11   Public – Nicht vertraulich
2 Run-rate of opCF synergies is pre-tax
Updating synergy outlook 2015: EUR 280m of OpCF savings
                                                                                                                                              3
due to capture of early synergies; total case unchanged

    Integration Initiatives 2015
                                                                                                Previous outlook:
        Leaver programme                                                                           Run-rate of
      800 FTEs in 2015 (50% of                                                                    ~EUR 250m                        EUR 800m
     total target of 1,600 FTEs)

                                                                                        ~50%      EUR 280m
             Shop footprint
          400 shops by year-end
                                                                             ~50%

                  Network
     Transfer of 7,700 sites via
           deal with DTE                                                  Total         CapEx      Total 2015                       Year 5
                                                                       OpEx & Rev.                  Synergies
                  Facilities                                            Synergies
          In-city consolidation
           (15% of total sqm)

                                                                • 2015 synergies at ~35% of EUR 800m run rate in year 5 of integration
        Reduction of external                                   • OpEx savings driven by bringing forward initiatives such as shop
                staff
                                                                  restructuring and optimisation of external staff
                                                                • CapEx synergies primarily driven by a single LTE-network rollout
            Simplification /
                                                                • Total synergy case unchanged
        Eliminate duplications

1OpEx  savings are referred to 2014 combined financials excluding restructuring costs
2 CapEx synergies net of restructuring activities and exclude investment in spectrum
3 2014 combined KPIs: 9.1K FTEs. 1.8K shops, >39K mobile sites                            12          Public – Nicht vertraulich
Integration roadmap central to execution of our strategic                                        3
business priorities

           2015: Success                 2016: Transition              2017/8: Final Straight
  Early capture of synergies             Laying the ground               Bringing home savings

                          Leaver programme

                                       Shop footprint optimisation
                      
  800 leavers
  (50% of target)

                                                Facility consolidation
                      
  400 shops
  (2/3 of target)

                      
  7,700 sites to DT
  (14,000 target)                 Brand/customer migration

  Facilities: 15%
  reduction                                       Network integration
  External staff
  optimisation             Customer service reorganisation & digitalisation
  Simplification/
  Elimination of
  duplications
                      
                                                    Simplification

                                                     13          Public – Nicht vertraulich
Updated outlook for 2015                                                                                                                                                                                      4

                               Baseline 2014*                         9M 2015*                       Old Outlook 2015**                         New Outlook 2015**
                                      (EUR m)                    (y-o-y pct. growth)                   (y-o-y pct. growth)                          (y-o-y pct. growth)

          MSR                        5,528                              +0.4%                              Broadly stable                             Broadly stable

         OIBDA                        1,461                            +16.1%                                   >10%                                       +15-20%

         CapEx                                                                                             High single-digit                          Low double-digit
                                      1,161                              -2.8%                               pct. decline                               pct. decline
           Div              EUR 0.24/share                                 ---                                     ---                              EUR 0.24/share

           OIBDA driven by bringing forward integration activities into                                                                                    ~35%
            2015 and optimisation of commercial costs                                                                                                  of total target
           Higher CapEx reduction due to synergy effects in H2 which                                                                               synergy run-rate to
            outweigh network consolidation and LTE investment                                                                                       be already achieved
           Continuity reflected in stable dividend proposal: EUR 0.24 per                                                                                 in 2015
            share                                                                                                                                         (~€280m)

  * Baseline figures for 2014 are approximate and the result of the aggregation and then consolidation of Telefónica Deutschland and E-Plus Group financials according to Telefónica Deutschland Group
     accounting policies. Figures are further adjusted by exceptional effects, such as capital gains or restructuring costs based on estimates made by Telefónica management and resulting in combined
     figures we believe are more meaningful as a comparable basis. For details refer to additional materials published on our website https://www.telefonica.de/investor-relations-en.html
  ** Expected regulatory effects (e.g. MTR cuts) are included in the outlook. Restructuring costs from the integration of E-Plus Group are excluded from OIBDA, and CapEx excludes investments in spectrum.

                                                                                                      14                       Public – Nicht vertraulich
Comfortable liquidity and conservative financing policy                                                                                                                                                                      4

                                         Smooth, extended maturity profile and further diversified financing mix

       (EUR m)                 600
                                                                      IC Loan
                                                                      Bonds                                                                            Financing instrument                         Interest payment
                                                     500
                                                                      SSD/NSV                                                                          mix (%)                                      mix (%)

                 250     250                                                                                                                           Private placement
                                                                                                                                                           EUR 300m                 RCFs
                                             112.5                                                                                 92                                             EUR 710m
                                                                     21         38.5                                 33                                         11%
                                                                                                3
                                                                                                                                                                                                    fixed
                                                                                                                                                    Inter-                  27%
          2015   2016   2017   2018   2019   2020    2021    2022    2023 2024 2025     2026   2027   2028   2029   2030   2031   2032                       19%                                     28%
                                                                                                                                                  company
                                                                                                                                                     loan                                               variable
                                                                                         Instrument                                               EUR 500m            42%                                 72%
    Issue date Currency               Volume                Tenor         Coupon                                           Listing
                                                                                            rating
                                                                                                                                                                               Bonds
                                                                                         BBB, stable          Regulated market of the                                        EUR 1.1bn
    22.11.2013          EUR      600,000,000               5 years        1.875%
                                                                                          outlook            Luxemburg Stock Exchange
                                                                                         BBB, stable          Regulated market of the
    10.02.2014          EUR      500,000,000               7 years        2.375%
                                                                                          outlook            Luxemburg Stock Exchange

                 Comfortable liquidity position                                                                     Leverage2 ratio at 0.9x after one-off payments in Q3’15
                                                                                       959                                                                         +1.396                                           0.9x
                                                                                                                                                                                    +301     -225
                                                                                                                                                                                                            +51    +1.415
                                                                                                                                                             +1.503         +6

                                                     760

                                                                                                                          +18
                   199
                                                                                                                                     -304   +92      -28

                                                                                                                      Actual Finance o2 My Lease             Cash       Bonds       Pro-   Telfisa     Other3      Actual
          Cash and cash                        Undrawn                        Total liquidity                       31.12.2014 Leases Handy Receiv.                                missory                        30.09.15
           equivalents                          RCFs1                                                                                                                              Notes
1   Revolving credit facilities; EUR 50m RCF volume maturing in 2015, EUR 260m in 2017 and EUR 450m in 2018
2   As measured by Net Financial Debt/OIBDA (Last 12 months)
3   Mainly consists of movement of O2 My Handy receivables and Handset model receivables
                                                                                                            15                                       Public – Nicht vertraulich
We aim to maintain an attractive shareholder                                                                                    4
remuneration policy

                                                         Shareholder remuneration policy – main guidelines1

            Maintain high payout in relation to FCF

            Consider expected future synergy generation in
            dividend proposals

            Keep leverage ratio at or below 1.0x over the
            medium term

            Dividend proposal of EUR 0.24 for financial year
            2015 to be approved by AGM 2016

 Notes:
 1 Refer to the Telefónica Deutschland website for full dividend policy (www.telefonica.de)   16   Public – Nicht vertraulich
Main Takeaways

 1
                                               Market leader (48m accesses)
     Creation of the Leading Digital           Enhanced value-for-money competitive position
     Telco in the German market                Significant data monetisation opportunity
                                               Simplification & digitalisation at the core

 2
                                               Right infrastructure model for best high speed experience
     Superior digital customer                 Multi-brand strategy to enhance data monetisation
     experience on strong foundations          Multi-channel retail and “digital first” approach
                                               Facilitating customer’s digital journey - flexible approach

 3
                                             Gradual capture of synergies: EUR 800m OpCF run-rate in
     Enhanced profitability and cash          year 5
     flow generation from integration        Scale benefits from a mobile data-centric approach
     synergies and focused strategy          Simplified and lean operational model
                                             Focused investments on single LTE network rollout

 4
                                               Conservative financing policy
     Strong value creation for Telefónica      Commitment to maintain a high FCF dividend pay-out ratio
     Deutschland shareholders                  Consider future upside from synergies in dividend proposals
                                               High financial flexibility with leverage ratio at or below 1.0x

                                                 18             Public – Nicht vertraulich
Back-up

          Public – Nicht vertraulich
Strong spectrum portfolio post auction enables full realisation of
our best network experience vision

     Coverage – level playing field               TEF D retains spectrum leadership for capacity

                                                          2x75
                                                                                                2x70

                                                          2x20           2x60

                                                                                                2x30
                                                                                                       1x50

                                  2x35                    2x25           2x35
                                                                                1x34,2                  20
          2x30          2x30
                                  2x10                                                          2x20
          2x10          2x10               1x40
                                                                                   24,2
                                  2x10
                                                                         2x15                           25
          2x10          2x10               1x20           2x30
                                                                                                2x20
                                  2x15                                              5
          2x10          2x10               1x20                          2x10
                                                                                    5                   5

         700MHz        800MHz   900MHz   1,500MHz       1,800MHz          2,100MHz               2,600MHz

        TDD spectrum

                                                   19              Public – Nicht vertraulich
O2 Blue All-in portfolio

                           20   Public – Nicht vertraulich
O2 DSL All-in portfolio

                          21   Public – Nicht vertraulich
Partner business continued its strong performance while
customer base benefits from focus on premium positioning

                 Partner business driving gross adds                                    Ongoing improvement of customer base mix
      PO gross adds (abs) / Churn (in %)              O2 consumer PO churn             O2 consumer postpaid base (in thousand)
                                                      GA partner brands1
                                                      GA retail brands                                               2.9%
                                    -1.3%                   -1.3%                            Other
                      -1.4%
                                                                                             Data only
                                                                                             Voice only

                       37%          45%                     45%
                                                                                             Blue tariffs   ~65%             ~70%

                     Q1 ’15        Q2 ’15                  Q3 ’15                                           Q3 ’14           Q3’15

                Strong fixed BB proposition bears fruit
      Net adds (in thousand)                      DSL wholesale      DSL retail          Partner share of gross adds strong at 45%
                                           VDSL share
                                                             ~100%
                                           of gross adds                                 O2 Blue share of O2 postpaid base reaches
                                                                                          70%

                             -16            -13                     -13                  Retail DSL net add decline slows further to
                                   -26
                                                                                          –12.6k in Q3
                   -28

                                                           -42

                      Q1 ’15        Q2 ’15                  Q3 ’15

1   Wholesale & partner business                                                  22            Public – Nicht vertraulich
MSR development tempered by growing share of partners and
dynamics in value segment

                       Revenue structure (in EUR m)                                           Growing partner business
           Other        Hardware
                                                                                MSR from partner business1 (in EUR m)
           Fixed        MSR              +0.9%
                                                                                Share of
                               5,774               5,828                        postpaid       ~14%             ~15%          ~16%
                                                                                revenue
                                   864              778           -10.0%
                                   768              887                                                                 +7%
                                                                 +15.5%
                                                                                                       +7%
                                                                  +0.4%
                              4.137                4.155

                           YTD Sep ’14           YTD Sep ’15                                  Q1 ’15           Q2 ’15         Q3 ’15

                           Fixed revenue y-o-y (in %)
       Growth (y-o-y)
                              -10.9%             -9.5%         -9.5%
                                                                                 Mix-shift phenomenon: Share of partner
                                                                -3.6
                                                                                  business rising driven by market dynamics
                                                 -4.8
         DSL retail            -6.9
                                                                                 Decline in DSL retail slowing on the back
                                                                -5.8
                                                                                  of VDSL gross adds
                                                 -4.8
         Other fixed           -4.0

                              Q1’15          Q2’15             Q3 ’15

1   Wholesale & partner business                                           23              Public – Nicht vertraulich
OIBDA reflecting benefits of early capture of synergies and
optimisation of commercial costs

                                                          Structure of OIBDA for Jan-Sep 2015 (in EUR m)

                  +0.9%                                                                                          +12.9%1                                  +16.1%1
                  y-o-y                                                                                           y-o-y                                    y-o-y

                 5,828                  119                                                                      21.2%1                                   22.0%1
                                                                                                                 margin                                   margin
                                                          -1,965

                                                                                -500
                                                                                                   -2,248
                                                                                                                  1,234                                     1,285
                                                                                                                                  66               -15

                Revenue          Other income            Supplies           Personnel             Other            OIBDA    Restructuring     Sale of    OIBDA before
                                                                            expenses             expenses                       costs        yourfone    extraordinary
                                                                                                                                                            effects

                Synergies a significant driver of growth
                                                                                                                  Synergies drive ca. 45% of y-o-y OIBDA2
          OIBDA growth (y-o-y in EURm)1                                                                            growth in Q3
                                                                               104
                                                                                                                  Add. Opex savings: Commercial cost
                                                                               ~45%
                                                         54
                                                                                                                   optimisation improves profitability
          Synergies
          Commercial                                    >40%
                                   21                                                                             Restructuring costs mainly network-
          & other costs
                                                                                                                   related
                                Q1 ’15                 Q2 ‘15                Q3 ’15
                                                                              yoy
1 Y-o-y   comparisons based on 2014 combined figures
2 Excluding  exceptional effects - For details please refer to additional public material for Q3-2015
                                                                                                        24            Public – Nicht vertraulich
Financial leverage returned to target while keeping financial
flexibility
                                             Evolution of Free Cash Flow (FCF)1 YTD September 2015 (in EUR m)

                         1,234
                                                                                         Working capital movements:
                                                                                                    EUR -201m
                                                 704

                                                                        252                                                                                                            350
                                                                                                                    150                    23                     21
                                                                                               76

                          OIBDA               CapEx ex.          CapEx Reversal         Restructuring          MBA upfront          Other working               Other                  FCF1
                                              Spectrum           & Prepayments                                  payment                capital
                                                                                                                                     movements

              1 Free   cash flow pre dividend, spectrum payment and pre acquisition of E-Plus is defined as the sum of cash flow from operating activities and cash flow from investing activities.

       Evolution of Net Debt2 (y-o-y in EUR m) – Leverage ratio2 returns to 0.9x after payments in Q2’15

        Leverage
         ratio2
                              0.0x                                                                                                                                                  0.9x

                                                                                                                                                        56

                                                                                                                         977
                                                                                                                                                                                   1.415

                               18                                                          714
                                                             350
                       Net financial debt                    FCF1                       Dividend                Spectrum payment                     Other3                  Net financial debt
                       as of 01.01.2015                                                                                                                                      as of 30.09.2015

  2   For definition of net debt & leverage ratio please refer to additional materials of Q3 15 results
  3   Mainly consists of movement of O2 My Handy receivables and handset model receivables                   25                        Public – Nicht vertraulich
O2D - Factsheet

       Share price development until 30.9.15                                                                    Telefónica Deutschland at a glance
                                                                                  YTD
 6.0

                                                                                +23.7%
 5.5
                                                                                                         WKN                           A1J5RX

 5.0
                                                                                                         ISIN                          DE000A1J5RX9

                                                                                 +3.9%
 4.5                                                                                                     Ticker                        O2D
                                                                                 -1.5%

 4.0                                                                                                     Bloomberg                     O2D GY
 01.01.2015             01.04.2015           01.07.2015             01.10.2015
                                                                                                         Reuters                       O2DN.DE
                  O2D             DAX              Telco Index

                                                                                                         Market segment                Prime Standard

                                                                                                         Industry                      Telecommunications
        Shareholder structure as of 30.09.151
                                                                                                         Shares outstanding            2,974,554,993 shares
                             16.8%
                                                                                                         Share capital                 EUR 2,974.6m

                                                                                                         Market cap (as of 30.9.)      EUR 16,244.0 m
                     20.5%
                                                   62.7%                                                 Share price (as of 30.9.)     EUR 5.46

     Telefónica Germany Holdings Ltd*             Koninklijke KPN N.V.           Freefloat

 1 According to shareholders register as of 30 September 2015                                       26          Public – Nicht vertraulich
 * Telefónica Germany Holdings Limited is an indirect wholly owned subsidiary of Telefónica, S.A.
Quarterly detail of relevant combined financial and operating
data for Telefonica Deutschland

    Financials                                                               2014                                                                   2015
    (Euros in millions)                         Q1             Q2            Q3             Q4              FY                 Q1            Q2             Q3           YTD Sep
    Revenues                                      1,847          1,925         2,002           2,019          7,793              1,901         1,949          1,979           5,828

    Mobile service revenues                       1,333          1,380         1,424           1,391          5,528              1,354         1,382          1,419           4,155

    OIBDA post Group fees                            357            399          350             354          1,461                 378           453            454          1,285

    CapEx                                            215            224          286             438          1,161                 221           242            241             704

    Accesses (EoP)                                                           2014                                                                   2014
    (in k)                                      Q1             Q2            Q3             Q4              FY                 Q1            Q2             Q3             Sep
    Total Accesses                               46,897        47,303         47,803        47,662           47,662            47,658         48,041        48,645           48,645

     o/w mobile                                  41,168        41,623         42,201        42,125           42,125            42,179         42,617        43,289           43,289
       Prepa y                                   22,680        22,940         23,316        23,351           23,351            23,264         23,501        24,004           24,004
       Pos tpa y                                 18,489        18,683         18,885        18,774           18,774            18,915         19,116        19,285           19,285

-    Combined figures for 2014 and 2013 are approximate and the result of the aggregation and then consolidation of Telefónica Deutschland and E-Plus Group financials
     according to Telefónica Deutschland Group accounting policies.
-    The combined figures are further adjusted by exceptional effects if any, such as capital gains or restructuring costs based on estimates made by Telefónica Deutschland
     management and resulting in combined figures we believe are more meaningful as a comparable basis
-    The combined financials are not necessarily indicative of results that would have occurred if the business had been a separate standalone entity during the year presented or
     of future results of the business. The presentation of the combined consolidated financial information is based on certain assumptions and is intended for illustrative purposes
     only. The combined information describes a hypothetical situation and thus, due to its nature, the presentation does not reflect the actual results of operations. The assumed
     acquisition date had been the beginning of the annual period.

                                                                                          27                   Public – Nicht vertraulich
You can also read