Neil, T. R., Shen, Z., Robert, D., Drinkwater, B. W., & Holderied, M. W. (2020). Thoracic scales of moths as a stealth coating against bat ...
←
→
Page content transcription
If your browser does not render page correctly, please read the page content below
Neil, T. R., Shen, Z., Robert, D., Drinkwater, B. W., & Holderied, M.
W. (2020). Thoracic scales of moths as a stealth coating against bat
biosonar. Journal of the Royal Society Interface, 17(163), [0692].
https://doi.org/10.1098/rsif.2019.0692

Peer reviewed version

Link to published version (if available):
10.1098/rsif.2019.0692

Link to publication record in Explore Bristol Research
PDF-document

This is the author accepted manuscript (AAM). The final published version (version of record) is available online
via Royal College of General Practitioners at https://royalsocietypublishing.org/doi/10.1098/rsif.2019.0692 .
Please refer to any applicable terms of use of the publisher.

University of Bristol - Explore Bristol Research
General rights

This document is made available in accordance with publisher policies. Please cite only the
published version using the reference above. Full terms of use are available:
http://www.bristol.ac.uk/pure/user-guides/explore-bristol-research/ebr-terms/
Thoracic scales of moths as a stealth coating against bat biosonar

 Thomas R. Neil1, Zhiyuan Shen1, Daniel Robert1, Bruce W. Drinkwater2, Marc W.

 Holderied1*

 1
 School of Biological Sciences, University of Bristol.

 2
 Department of Mechanical Engineering, University of Bristol.

 *Correspondence to: Marc.Holderied@bristol.ac.uk.

 Abstract:

Many moths are endowed with ultrasound-sensitive ears that serve the detection and evasion

of echolocating bats (1). Moths lacking such ears could still gain protection from bat biosonar

by using stealth acoustic camouflage, absorbing sound waves rather than reflecting them back

as echoes (2, 3). The thorax of a moth is bulky and hence acoustically highly reflective. This

renders it an obvious target for any bat. Much of the thorax of moths is covered in hair-like

scales (4), the layout of which is remarkably similar in structure and arrangement to natural

fibrous materials commonly used in sound insulation. Despite this structural similarity, the

effect of thorax scales on moth echoes has never been characterised. Here, we test whether and

how moth thorax scales function as an acoustic absorber. From tomographic echo images, we

find that the thin layer of thoracic scales of diurnal butterflies affects the strength of ultrasound

echoes from the thorax very little, whilst the thorax scales of earless moths absorbs an average

of 67±9% of impinging ultrasonic sound energy. We show that the thorax scales of moths

provide acoustic camouflage by acting as broadband (20-160 kHz) stealth coating. Modelling

results suggest the scales are acting as a porous sound absorber, however the thorax scales of

moths achieve a considerably higher absorption than technical fibrous porous absorbers with

the same structural parameters. Such scales, despite being thin and lightweight, constitute a

broadband, multidirectional and efficient ultrasound absorber that reduces the moths’

detectability to hunting bats and gives them a survival advantage.

1. Introduction

The acoustic arms race between bats and moths is a prime example of predator-prey sensory

co-evolution. Moths responded to the prevalence of echolocating bats by evolving a host of

active and passive defences, including the multiple convergent evolution of ultrasound

sensitive hearing (1). Eared moths detect the echolocation calls of bats via tympanic organs

and take defensive action. Earless moths, however, must rely on passive defences to reduce bat

predation (5).

Acoustic camouflage is a type of passive defence that has only recently been explored. As bats

are auditory rather than visual hunters, any mechanism that reduces the detectability of moth

echoes returning to the bat would confer a survival advantage. The body and wings of an insect

reflect an echo that contains overlapping sound reflections from all its body surfaces (6). Yet,

only the sound reflected back towards the bat matters, while all sound energy that is scattered

away, transmitted or absorbed by the wings and body is irrelevant.

Lepidopteran wings are covered in layers of paddle-shaped scales, which have been shown to

provide thermoregulation (7), an anti-stick coating (8), and visual camouflage (9). The potential

of scales on moth wings to act as ultrasound absorbers has been speculated upon (2, 3), and at

a narrow subset of bat echolocation frequencies (40-60 kHz) the wings of nocturnal moths

reportedly absorb slightly more ultrasound (1-2 dB) than wings of diurnal butterflies (10, 11).

An absorptive mechanism of individual scales as tuned resonators has recently been proposed

(12).
Unlike their thin cuticular wings, an insect’s thorax contains its nutritious protein-rich

locomotor apparatus encased in thick and hence acoustically highly reflective cuticle. This

renders the thorax an obvious high-value target for any bat. Its shape determines the echoes it

produces, and because the thorax is roughly spherical it sends consistently strong echoes in

many directions, creating an omnidirectional target for bat attacks. Unlike most other insects,

much of the thorax of moths and butterflies is covered in hair-like (piliform) scales (4) that

differ substantially from the paddle shaped scales typical for their wings (13). The dense layer

of elongated piliform scales on the thorax of moths resembles hairs, and is remarkably similar

in structure and arrangement to natural fibrous materials commonly used in sound insulation,

such as hemp and kenaf (14). Despite this structural similarity, the effect of thorax scales on

moth echoes has never been characterised. Here, we test whether this layer of scales can

provide acoustic camouflage against bat echolocation.

Through multiple reflections, concave surfaces can create strong retro-reflection to the source

(e.g. floral echo beacons (15-17)), particularly if flat surfaces meet at right angles (corner

reflectors). The joints between thorax and wings might act as such corner reflectors, but, unlike

the rest of the thorax, they cannot carry scales as this would hamper the complex joint

movements during flight. A cuticular structure called the tegula (derived from latin tegere: to

cover), which folds over the forewing joints of many insects, is particularly well developed

amongst Lepidoptera (18, 19). Their tegulae ventrally face the wing joint and carry piliform

scales on their dorsal surface. This layer of scales neatly closes the gap between the scales on

the thorax and the elongated scales at the base of the wing (20).
Here we explore the thoracic scale morphology of two earless moth species (Antherina suraka,

Callosamia promethea) and two butterfly species (Graphium agamemnon, Papilio troilus), and

determine the scales’ effect on the strength and detectability of echoes returning to an

echolocating bat. Bat echolocation calls are diverse both temporally and spectrally, with

dominant calling frequencies ranging from 11 kHz (Euderma maculatum) (21) to 212 kHz

(Cloeotis percivali) (22), whilst the search echolocation calls of most insectivorous bats have

a dominant frequency between 20 and 60 kHz (23). We show that the thorax scales of moths

provide acoustic camouflage by acting as broadband (20-160 kHz) stealth coating that reduces

the moths’ overall detectability to hunting bats and gives them a significant survival advantage.

2. Methods
 2.1 Lepidoptera sourcing

Moth and butterfly specimens were obtained from wwb.co.uk as pupae from April-May 2017.

Tropical species were housed in a temperature-controlled cabinet (Economic Deluxe, Snijders

Scientific, Tilburg, Holland), where they were subject to a 12 hour night/ day cycle in which

temperature varied between 25°C and 30°C whilst humidity was a constant 70%. Temperate

species were housed in a laboratory at room temperature and sprayed daily with water.

Following eclosion, specimens were euthanized and pinned in a natural position with the wings

orientated horizontally to the dorsal plane and allowed to dry at room temperature for two

weeks. Two members of the Saturniidae (Antherina suraka Boisduval and Callosamia

promethea Drury) and two members of Papilionidae (Graphium agamemnon Linnaeus and

Papilio troilus Linnaeus) were used, with five specimens representing each species. A. suraka

is a nocturnal moth and has been shown to be attracted to light (24). The males of C. promethea

fly during the afternoon, whilst the females are nocturnal (25). Both Papilionidae are diurnal

nectar feeders (26, 27). All specimens used were female.
2.2 Scale morphology

Microscopic (Leica EV4W, Leica Microsystems, Bensheim, Germany) and SEM images

(Zeiss Evo15 with Lab6 emitter, Zeiss, Germany) of sections through scales and of thorax

surfaces after partial scale removal were used to characterise and compare the piliform scales

of the species. For SEM images, sections of thorax and tegula were mounted on adhesive

carbon tabs (EM Resolutions Ltd, UK) and coated with 5 nm of gold (Quorum Q150R ES,

Quorum Technologies Ltd, UK). Sections were imaged in both high vacuum mode using an

SE1 detector and variable pressure mode using a VPSE G3 detector. An EHT of 15-20 kV with

50-100 pA probe and a magnification range from ×250 to ×5k were used. The morphology of

the piliform scales on the thorax and tegula was characterised in these four parameters: Piliform

scale length (measured from base to tip of individuals scales), insertion point density (number

of sockets per surface area), scale depth (measured as total scale thickness perpendicular to the

thorax surface) and scale angle (insertion angle of the scale base into the thorax surface). Five

measurements were taken from the five individuals from each species. For insertion point

density SEM images were split into a square grid of five 0.5x0.5 mm sections. Scale layer depth

measurements were taken at five equidistant points along the top of the thorax in cross sectional

SEM images. All analysis was performed using ImageJ (ImageJ, NIH, USA).

 2.3 Scale layer porosity

A microscale 3D model of the thorax of one Antherina suraka (fig. 4A) was created by

synchrotron X-ray imaging at the l13-2 Manchester Imaging Branchline at Diamond Light

Source. We used pink light, 1.25x detector, and an exposure time of 30 ms, resulting in a voxel

size of 2.6 µm. Scale layer porosity was calculated as fraction of filled voxels for a dorsolateral

scale volume of 2.9 x 0.9 x 1.5 mm (fig. 4C) starting from the tips of the longest hairs. Hair
porosity: Confocal microscopy (CFM, Leica TCS SP5, Mannheim, Germany; excitation

wavelength=488 nm; emission band=495-720 nm; pinhole=60 nm; optical section

thickness=0.46 µm; z step=84 nm) was used to measure 3D nanostructure of a single thorax

hair of A. suraka (Fig. 4C inset). Auto-fluorescence of the scale material was strong enough to

obtain clear confocal images without further labelling. The ×100 lens realized 3D voxels of 44

× 44 × 84 nm. Porosity and volume fraction were measured using AVIZO light (v9.4; Thermo

Fisher Scientific, Waltham, MA).

 2.4 Absorption modelling

We followed Cox & D’Angelo (28) for absorption modelling, and use their equation numbering

below. Flow resistivity σ of moth scales perpendicular to fibre orientation was calculated for

parallel layered fibres using

 10.56 µ (1− )1.531
 σ = 1012 2 table 6.4 in (27)
 ( /2) 3

with measured absorber porosity P and fibre diameter df, and air viscosity µ = 1.85 Nsm-2.

For absorber thickness d, incidence angle , speed of sound c = 343 ms-1, and a density of air

ρ = 1.204 kgm-3, the impedance at absorber surface is

 1 = − cot( )

6.52

With characteristic impedance

 = (1 + 0.0571 −0.754 − 0.087 −0.732 ) 6.9

and = 6.11

Complex wave number kN and x-component of wave number kx are
 2
 = (1 = 0.0978 −0.700 − 0.189 −0.595 ) 6.10
2 2
 = √ 2 − ( sin ) 6.47 & 6.48

The pressure reflection coefficient then is
 1
 cos −1

 = 1
 cos +1

2.21

Finally, the absorption coefficient calculates as

 = 1 − | |2

2.24

This porous absorption model is developed for audible frequencies, and valid for term X values

between 0.01 and 1, and for absorber flow resistivity up to 50000 rayls m-1. The model is further

limited to specific frequency ranges of 400 Hz to 41 kHz for the empirically calculated 47000

rayls m-1 and 200 Hz to 20 kHz for 24000 rayls m-1.

 2.5 Acoustic tomography

The custom-made acoustic tomography setup consisted of a sensor head comprised of a ¼”

ultrasound microphone (type 40BF, GRAS Sound & Vibration A/S, Holte, Denmark), pre-

amplifier (type 26AB), dual-channel microphone power supply (type 5935-L, both Brüel &

Kjær, Nærum, Denmark) and a custom-made ferro-electret foil loudspeaker (33x14 mm, Emfit

Ltd., Vaajakoski, Finland) driven by a PZD350 M/S high-voltage amplifier (TREK Inc.,

Lockport, NY). The microphone and speaker were pointed in the same direction. The distance

between the centres of the loudspeaker and microphone was 15 mm, simulating the position of

a bat’s mouth and ear. The sensor head was mounted on an adjustable lever arm moved by a

vertically mounted LT360 turntable (LinearX Systems Inc., Battle Ground, WA). A second

such turntable was mounted horizontally, which allowed for the mounted specimen to be

rotated with respect to the sensor head (fig. S1A). Microphone, loudspeaker and turntables
were connected to a NI-DAQ BNC-2110 card operated through LabVIEW v.16.0 (both

National Instruments, Austin, TX) with custom-programmes.

Insects were mounted at the centre of the tomography setup 31 cm above the horizontal

turntable by placing them on a platform (75x70x25 mm) made of ultrasound absorbing foam

(Basotect W, BASF, Ludwigshafen, Germany). A cross line laser (FatMax 77-153, Stanley,

UK) was used to align the centre of each specimen’s body with the microphone to ensure

continuity in specimen placement.

Acoustic measurements were taken in a 2.9x2.7x2.3 m semi-anechoic single wall audiometric

room (IAC Acoustics, North Aurora, Illinois). Specimens were ensonified with linear

frequency modulated sweeps from 250–15 kHz of 10 ms duration, covering the range of

frequencies used by bats. Sweeps were sampled at 500 kHz with 16-bit resolution. Playback

and recordings were sample-synchronous at the same sample rate and resolution.

Echoes for acoustic tomography were measured from a distance of 32 cm from the target from

720 azimuthal positions (0.5° steps, 360°) in which the specimen rotated but the sensor head

remained fixed. The 720 echoes were initially measured with the sensor head at an elevation

of 10° to the horizontal, and this was subsequently repeated six times at 10° increments to an

elevational angle of 70°. Additional individual echoes were taken from elevation 90° and from

azimuth 0°, 90°, 180° and 270° at elevation 80° to complete the upper hemisphere. These were

added exclusively for the comparison of body vs wing directionality. Pulse forming through

deconvolution with the echo recorded perpendicularly from a 50x70 cm metal plate was used

to calculate impulse responses and target strengths of each echo measurement.
Impulse responses were turned into acoustic tomographies by inverse radon transforms using

custom-written MATLAB scripts (v9, MathWorks, Natick, MA modified after (29)).

Envelopes were calculated using the absolute value of the Hilbert transform of the impulse

response in order to convert intensity values to a dB scale.

Each specimen was measured in three different experimental treatments: (i) intact specimen,

(ii) the specimen with the tegula removed, (iii) the specimen with all thorax scales removed

(fig. S1 B-D). The tegulae were removed using microsurgery tweezers (B5SA, Bondline

Electronics Ltd, Swindon, UK) whilst thorax scales were removed with a paintbrush.

 2.6 Acoustic characterisation based on tomographies

Acoustic tomographies have the advantage that an area of interest can be selected and the

corresponding echo return analysed independently from the rest. Here, the thorax

(encompassing the prothorax, mesothorax and metathorax) was defined as area of interest, and

subsequent acoustic calculations were based on those parts of the tomographic images

originating from the thorax area only. For comparison, the left forewing was treated as

additional area of interest. The respective area was selected manually in MATLAB using the

polygon tool. The parts of the total moth echo originating from this selected area in the

tomographic image were extracted using radon transforms, and target strength was calculated

for just the selected area (thorax or wing). The detection distances comparing the three

treatments were derived using the sonar equation (30):

 D = H – 2K + M – e

Where D is the auditory threshold of the bat (20 dB SPL (sound pressure level) including the

noise term), H the sound source level (125 dB peak-equivalent SPL at 10 cm), K the one-way
transmission loss, M the measured target strength of the specimen and e noise. The equation is

in dB form.

Transmission loss K was calculated as:

 K = 20log10 r + ʎ r

Where r is the distance (m) between sender and specimen and ʎ (dB m-1) is the atmospheric

attenuation, which is a function of frequency and environmental variables, calculated following

Bazley (31) for temperature 20°C and 70% relative humidity. Detection distance directionality

of wing and thorax was compared as a function of surface area as measured in solid angle.

Target strength M for a reference distance of 0.1 m was calculated as:

 M = 10log10 (Ir/Ii)

where Ir and Ii (W m-2) are the returned (measured from 0.32 m and converted to the reference

distance of 0.1 m by adding 10.1 dB) and incident sound intensity respectively. Spectral target

strength is target strength as a function of frequency, which was extracted based on a 2048

point fast fourier transform (FFT).

The absorption coefficient α of the thorax scales was calculated using:

 α = 1 – Ir / Ii

 2.7 Statistical analysis

Repeated measures t-tests (two-tail) were used to compare differences in target strengths

amongst treatments as a function of frequency; statistical significance was accepted at p
commercial statistical analysis package (R studio Version 0.99.473, RStudio, Inc. Boston,

MA).

3. Results

 3.1 The effect of thorax scales on echoes in moths and butterflies

Tomographic images were used to quantitively compare thorax target strength across the three

treatments. A repeated measures ANOVA was used to compare the intraspecific and

interspecific differences in thorax target strength between intact, tegula removed and bald

specimens. Compared to the intact specimens, there was a significant effect of both tegula

removal and thorax scale removal on target strength of the thorax across the four species tested

(F(11,72) = 48.54, p
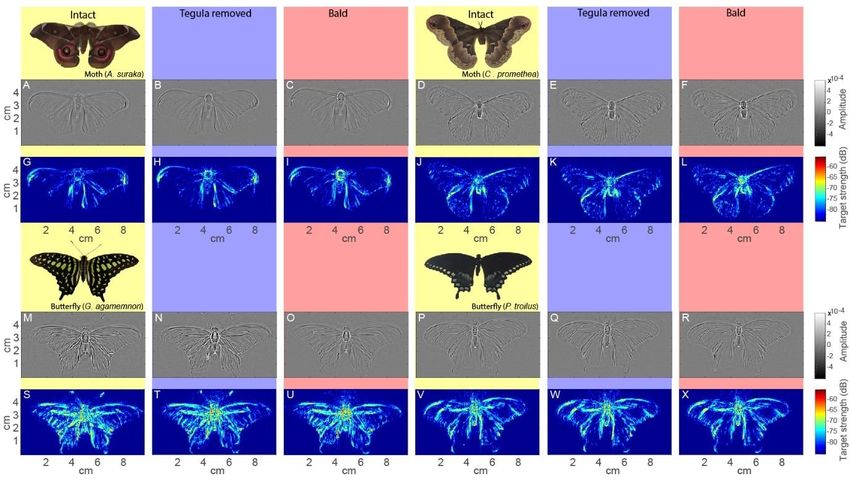
strength at all frequencies in both moth species, A. suraka (d = 0.91) and C. promethea (d =

0.82) (fig. 2A,B).

The absolute effect of moth scales on target strength is broadband, affecting all frequencies

from 20-160 kHz similarly (fig. 2A,B). By contrast, in butterflies even full scale removal only

changes target strength significantly at limited frequencies: 27-60 kHz (23% of frequency

range, d = 0.8) in G. agamemnon and 35-45 kHz (7%, d = 0.88) in P. troilus, with the reduction

in target strength at these frequencies only being a fraction of that seen in moths (fig. 2C,D).

At some frequencies butterfly scales even increase target strength. Expressed as absorption

coefficient α, scale removal equates to 0.69 (0.32 to 0.85) in A. suraka, and 0.66 (0.12 to 0.76)

in C. promethea. Whilst in butterflies it is 0.21 (-0.59 to 0.56) in G. agamemnon and 0.04 (-

0.75 to 0.40) in P. troilus.

 3.2 Directional effect of scales

Significant differences in target strength between intact and bald specimens were found in both

moth species at all seven (10°-70°) elevation angles from 30-50 kHz (fig. S3). The scales effect

on the directionality of target strength is further explored through the analysis of echoes taken

from 2520 directions (half hemisphere), with target strength integrated across all 7 elevation

angles (10°-70°) and frequencies (20-160 kHz) in this instance (fig. 2E-H). In all four species,

target strength is greater at lateral than at anterior or posterior angles of sound incidence.

Tegulae create an intermediate and thorax scales a strong reduction in target strength in

particular at lateral angles, but only in moths (fig. 2E,F) and not in butterflies (fig. 2G,H).

Integrated across all frequencies (20-160 kHz) the right 180° of thorax scales reduce target

strength in A. suraka by a mean of 3.94 (2.5-5.7) dB and 2.42 (1.1 – 4.2) dB in C. promethea

(fig. 2E,F).
3.3 Effect on detection distance of thorax

We calculated the expected adaptive value of thorax scales as stealth coating against bat

biosonar by comparing the distances over which a bat would be able to detect each species’

thorax with and without scales. Integrating detection distances for 5040 echo directions we

calculated the change in total detection integrated from 20–100 kHz (fig. S4). Removal of

thorax scales increased the detection distance of the thorax by 9–24% in A. suraka and 6–12%

in C. promethea, representing a moderate but significant change in detection distance.

 3.4 Detection distance of thorax vs wings

From a detectability perspective, there would be little evolutionary pressure for the thorax to

produce lower target strengths than the rest of the animal, because bats would detect a moth by

the body part producing the strongest echo. Comparing the echo detection range (20-100 kHz)

of forewing and thorax of the moth A. suraka (N=5) (fig. 3, S4) reveals that the intact thorax is

louder than the wing for just 38.1±11.2% of directions (measured as solid angle) with an

average difference in detection range of –0.12 m (range -2.31 to 1.34 m). Scale removal

however makes the thorax echo louder than the wing for significantly more directions

(83.9±8.9%; paired sample t-test, t(4) = 8.12 p
in P. troilus the intact thorax was only louder for 0.03% (±0.01%) of directions and the bald

thorax only 0.28% (±0.45%, t(4) = 0.94 p = 0.40). In short, a bald thorax would dominate the

overall echo strength in a moth and hence increase detectability while its scales suppress its

detectability close to or below that of the wing.

 3.5 Moth scales as a porous sound absorber

Porous sound absorbers become effective from a minimum thickness of roughly 10% of the

wavelength of the lowest frequency they need to absorb (28). At the lowest relevant frequency

of 20 kHz both moth species achieve this with 11.6% and 13.6% of the wavelength for tegula

scales and 8% and 8.5% for thorax scales. In contrast, both butterflies’ scales are too thin

reaching just 4.8% and 4.2% on the tegula and 2.2% and 4.1% on the thorax respectively

(compare supplementary table 1). Moth thorax scales have just the thickness that renders

porous absorption of bat calls possible, while butterfly scales are too thin.

Using the standard semi-empirical model for filamentous porous sound absorbers (28), we

explored whether moth scales could create the measured absorption spectra. Spectral

absorption depends on the absorber’s thickness and flow resistivity, which in turn depends on

the volume fraction of fibres in the absorber, and the orientation, diameter, and material

porosity of the fibres constituting it. 3D microCT analysis of a 2.9x0.9x1.5 mm section of A.

suraka thorax scales reveals an average piliform scale volume fraction of 4.9%. Individual

moth hairs (measured for A. suraka) are not solid but largely hollow tubes with 350-1000 nm

diameter perforations (fig. 4C inset). Their measured overall material porosity is 0.45, which

multiplied with the volume fraction results in a total scale absorber porosity P of 0.978.

Detailed inspection reveals that scales are least densely packed on the thorax surface, and

volume fraction increases over 0.5 mm until it plateaus at 7-8% equalling to an average porosity
P at the base of 0.967 (fig. 4B). These two values for P equate to a porous flow resistivity σ of

24000 and 47000 rayls m-1 respectively (28). The model then allowed us to compare measured

and calculated absorption coefficients for frequencies of 20, 25, 30, 35, 40, and 45 kHz and we

did this for sound incidence elevations of 20⁰, 40⁰, 60⁰, and 80⁰ for an absorber thickness of

1.7 mm at 24000 rayls m-1 (‘set 1’) and 1.2 mm at 47000 rayls m-1 (‘set 2’). For A. suraka,

measured absorption coefficients α for this frequency range were between 0.32 and 0.83 and

modelled between 0.23 and 0.57 with a mean ±SD difference of 0.17±0.33 for ‘set 1’ and of

0.15±0.19 for ‘set 2’.

4. Discussion

The considerable broadband reduction in acoustic backscatter (echo strength) by moth scales

is most likely achieved through increased absorption and perhaps some increased random

scatter (diffusion). Increased sound transmission is unlikely because the thick cuticle (and

tissue inside) on the thorax should act as solid reflector of ultrasound. The overall arrangement,

distribution and microstructure of piliform moth scales (fig. S5) bears resemblance to fibrous

materials commonly used as porous absorbers, where stacks of parallel filament bundles are

arranged such that air is trapped between them (14). Such a connected network of pockets of

air allows sound waves to enter, where the air molecules within vibrate, causing energy losses

due to thermal and viscous effects along the walls and tunnels of the material (33) (34).

Remarkably, the thorax scales of moths achieve a considerably higher absorption than technical

fibrous porous absorbers with the same structural parameters. The best fit for 47000 rayls m-1

was achieved for a thickness of 2.68 mm (‘set 3’) achieving a mean α difference of -0.01±0.12.

This is more than twice the actual absorber thickness at that σ, suggesting the detailed moth

scale structure achieves additional absorption not yet realised in technical fibrous absorbers.
The reasonable overall agreement suggests that moth scales can be approximated as fibrous

porous absorber, but we observe one relevant deviation: For incidence angles of 20⁰ (close to

normal) and low ultrasonic frequencies (20-25 kHz), the measured α is always substantially

higher than expected for a fibrous porous absorber (difference to measurement for model ‘set

1’: 0.50-0.54; ‘set 2’: 0.54-0.57; ‘set 3’: 0.33-0.38). This shows that the absorption of moth

scales for near normal incidence and high wavelength/thickness ratios is substantially better

than expected for a conventional fibrous porous absorber - a remarkable and desirable absorber

feature that is not fully understood to date.

A butterfly, such as P. troilus, with its thinner scale layer will achieve lower absorption

coefficients even if assuming the same scale structure as moths. With its thinner and less dense

piliform scales (supplementary table 1) it would achieve a total absorber porosity of 0.998,

with a resulting flow resistivity of just 2000 rayls m-1 with very low expected α. For this low

flow resistivity however, the semi-empirical model we used (27) is no longer valid at ultrasonic

frequencies, ruling out a respective comparison.

Because thorax scales can be treated as a fibrous porous absorber, it is not entirely surprising

that the differences in scale thickness and density correlate with the higher sound absorption in

moths compared to butterflies. This even applies to the comparison between the two moth

species: Not only are the piliform scales of the thorax and tegula of A. suraka longer and denser

than those of C. promethea, they also lie flatter to the thorax. This creates a uniform layer of

parallel piliform scale bundles, which would be expected to perform better than piliform scales

positioned in a more upright position (14), as seen in C. promethea.
The thick layer of thorax scales of moths may of course not have evolved exclusively as an

absorber of bat ultrasound and a role in thermoregulation has been proposed. Moth wing

loading correlates with thoracic temperatures (35), and it has been suggested that deaf moths

may have higher thoracic temperatures to facilitate quicker, more evasive flight (36). However,

the earless Saturniids we studied are amongst the lowest in terms of wing loading and relatively

poor fliers (35). It is also noteworthy that the temperate moth species C. promethea in our study

has less scale mass than the tropical A. suraka, while one would expect better thermal insulation

by a thicker scale layer in the temperate species. Given the many degrees of freedom of scale

microstructure, there is indeed no reason why thorax scales of moths could not serve as an

effective ultrasound absorber and independently evolve thermal insulator functionality.

With measured ultrasound absorption coefficients of 0.32-0.85 there is some potential for even

stronger absorption through a thicker layer of scales. The total mass of thorax scales (1.7±0.1

mg in A. suraka; 0.4±0.06 mg in C. promethea; n=5) is only a small proportion (
the wing and intact and bald thoraxes further support this (fig. 3), with the scales bringing the

detection distance of the thorax to equal or below that of the wing in moths. This suggests that

the echo strength of the wing is the main constraint on overall detectability, and that thoracic

scale absorption has evolved to reduce thorax echoes to just below that of the wing.

Moths and bats are considered a classic example of a predator prey evolutionary arms race. As

such it is interesting to consider what steps a bat might have taken to potentially overcome the

survival advantages bought by acoustic camouflage. The thorax scales of moths have been

shown to be broadband sound absorbers, covering most of the echolocation frequencies

typically used by bats (38). In each of these moth’s respective habitats they will likely

encounter species of bats that hunt using a variety of echolocation strategies, spanning a range

of frequencies and duty cycles (38-40). Our measurements suggest that bats receive the

strongest echoes from a flying moth when the sound hits a wing at normal incidence. Bats

which hunt using short frequency modulated calls may not often ensonify a moth at this

particularly favourable wing angle, leading to a reduction in the maximum detection distance

to that prey item (41, 42). However, many bats hunt using high duty cycle constant frequency

calls. As these calls span many wing beats of a moth, it allows the bat to pick up on ‘glints’

produced by the oscillations of a moth’s wing during flight, enabling them to better detect and

lock onto targets (43). This adaptation has been shown to be advantageous to bats that hunt in

cluttered environments, but perhaps it could be considered that these call types also evolved as

means for bats to overcome the acoustic camouflage brought about by a moth’s thorax scales.

Our finding that the wing and thorax echo amplitudes are similar is different to previous

findings (44). One reason for this discrepancy might be that the previously tested species all

had ears and hence could actively avoid bat ultrasound (45), while our species are earless, and
hence depend more on passive acoustic camouflage, where it would be adaptive to reduce the

wing echo strength compared to eared moths. As a related side note, butterfly wings apparently

produce consistently louder echoes than moth wings (fig. 1M-X), suggesting that the scales on

moth wings might indeed also have evolved to be acoustically stealthy compared to butterflies.

The work produced here provides a snapshot into acoustic camouflage amongst lepidoptera.

Future work could include a greater subset of species, investigating the effect of both thorax

and wing scales on echo strength and directionality, as well as introducing phylogenetic

comparisons to explore the extent and magnitude of acoustic camouflage across the order.

In summary, the scales on the thorax and tegulae of moths absorb ultrasound effectively and

reduce the detection distance of the thorax considerably across the range of relevant ultrasonic

frequencies. In A. suraka, thorax scales offer a median 5.6 dB echo reduction across 20–160

kHz translating to an absorption coefficient of 0.72, impressive absorptive performance in a

thin biological porous absorber. The results presented in this study provide evidence that the

thorax scales of moths act as a highly effective porous absorber of ultrasound that affords

acoustic stealth camouflage by reducing the moths’ detectability to bat biosonar.

Author contributions. T.R.N. and M.W.H. designed the experiments and the analyses.

T.R.N. performed the experiments. T.R.N. and M.W.H. analysed the data, and discussed with

Z.S., B.W.D. and D.R. the results and interpretations. T.R.N. and M.W.H. wrote the manuscript

with input from Z.S., B.W.D. and D.R.

Acknowledgments. We thank Diamond Light Source for access to beamline I13 (proposal

MT17616) that contributed to the results presented here, and to Dr Shashi Marathe and Kaz

Wanelik for their assistance whilst using the facility.
Data and materials availability. All data is available in the main text or the

supplementary materials.

Funding. This study was supported by research grants from the Biotechnology and Biological

Sciences Research Council (BBSRC, BB/N009991/1), the Engineering and Physical Sciences

Research Council (EPSRC, EP/T002654/1) and the Leverhulme Trust (RF-2017-717).

Supplementary Materials. Figures S1-S5, Table S1.

References

1. Ter Hofstede HM, Ratcliffe JM. Evolutionary escalation: the bat–moth arms race.
Journal of Experimental Biology. 2016;219(11):1589-602.
2. Roeder KD. Echoes of ultrasonic pulses from flying moths. The biological bulletin.
1963;124(2):200-10.
3. Moss CF, Zagaeski M. Acoustic information available to bats using frequency‐
modulated sounds for the perception of insect prey. The Journal of the Acoustical Society of
America. 1994;95(5):2745-56.
4. Hegel JR, Casey TM. Thermoregulation and control of head temperature in the sphinx
moth, Manduca sexta. Journal of Experimental Biology. 1982;101(1):1-15.
5. O’Reilly LJ, Agassiz DJL, Neil TR, Holderied MW. Deaf moths employ acoustic
Müllerian mimicry against bats using wingbeat-powered tymbals. Scientific Reports.
2019;9(1):1444.
6. Wilhjelm JE, Pedersen PC, Jacobsen SM. The influence of roughness, angle, range, and
transducer type on the echo signal from planar interfaces. ieee transactions on ultrasonics,
ferroelectrics, and frequency control. 2001;48(2):511-21.
7. Kingsolver JGJE. Thermoregulation and flight in Colias butterflies: elevational patterns
and mechanistic limitations. 1983;64(3):534-45.
8. Eisner T, Alsop R, Ettershank G. Adhesiveness of spider silk. Science.
1964;146(3647):1058-61.
9. Brakefield PM, Liebert TGJPotRSoLSBBS. Evolutionary dynamics of declining
melanism in the peppered moth in The Netherlands. 2000;267(1456):1953-7.
10. Zeng J, Xiang N, Jiang L, Jones G, Zheng Y, Liu B, et al. Moth wing scales slightly
increase the absorbance of bat echolocation calls. PloS one. 2011;6(11):e27190.
11. Ntelezos A, Guarato F, Windmill JFC. The anti-bat strategy of ultrasound absorption:
the wings of nocturnal moths (Bombycoidea: Saturniidae) absorb more ultrasound than the
wings of diurnal moths (Chalcosiinae: Zygaenoidea: Zygaenidae). Biology Open.
2017;6(1):109-17.
12. Shen Z, Neil TR, Robert D, Drinkwater BW, Holderied MW. Biomechanics of a moth
scale at ultrasonic frequencies. Proceedings of the National Academy of Sciences.
2018;115(48):12200-5.
13. Ghiradella H. Light and color on the wing: structural colors in butterflies and moths.
Applied Optics. 1991;30(24):3492-500.
14. Arenas JP, Crocker MJ. Recent trends in porous sound-absorbing materials. Sound &
vibration. 2010;44(7):12-8.
15. Simon R, Holderied MW, Koch CU, von Helversen O. Floral acoustics: conspicuous
echoes of a dish-shaped leaf attract bat pollinators. Science. 2011;333(6042):631-3.
16. von Helversen D, Holderied MW, von Helversen O. Echoes of bat-pollinated bell-
shaped flowers: conspicuous for nectar-feeding bats? Journal of experimental biology.
2003;206(6):1025-34.
17. von Helversen D, von Helversen O. Acoustic guide in bat-pollinated flower. Nature.
1999;398:759.
18. Sharplin J. Wing base structure in Lepidoptera: III. Taxonomic characters. The
Canadian Entomologist. 1964;96(7):943-9.
19. Crampton G. A phylogenetic study of the mesothoracic terga and wing bases in
Hymenoptera, Neuroptera, Mecoptera, Diptera, Trichoptera and Lepidoptera. Psyche: A
Journal of Entomology. 1919;26(3):58-64.
20. Root GA. A study of the thoracic sclerites of Lepidoptera. 1915.
21. Fullard J, Dawson J. The echolocation calls of the spotted bat Euderma maculatum are
relatively inaudible to moths. Journal of Experimental Biology. 1997;200(1):129-37.
22. Fenton MB, Bell GP. Recognition of species of insectivorous bats by their echolocation
calls. Journal of Mammalogy. 1981;62(2):233-43.
23. Fenton M, Portfors C, Rautenbach I, Waterman J. Compromises: sound frequencies
used in echolocation by aerial-feeding bats. Canadian Journal of Zoology. 1998;76(6):1174-
82.
24. Barsics F, Razafimanantsoa TM, Minet J, Haubruge E, Verheggen F. Nocturnal moth
inventory in Malagasy tapia woods, with focus on silk-producing species. Les vers à soie
malgaches Enjeux écologiques et socio-économiques. 2013:77-89.
25. Gago R, Allison JD, McElfresh JS, Haynes KF, McKenney J, Guerrero A, et al. A
tetraene aldehyde as the major sex pheromone component of the Promethea moth (Callosamia
promethea (Drury)). Journal of chemical ecology. 2013;39(10):1263-72.
26. Lederhouse RC, Codella SG, Cowell PJ. Diurnal predation on roosting butterflies
during inclement weather: a substantial source of mortality in the black swallowtail, Papilio
polyxenes (Lepidoptera: Papilionidae). Journal of the New York Entomological Society.
1987:310-9.
27. Ramana SV, Atluri J, Reddi CS. Autecology of the tailed jay butterfly Graphium
agamemnon (Lepidoptera: Rhopalocera: Papilionidae). Journal of Environmental Biology.
2003;24(3):295-304.
28. Cox T, d’Antonio P. Acoustic absorbers and diffusers: theory, design and application.
Third Edition ed: Crc Press; 2017.
29. Balleri A, Griffiths HD, Woodbridge K, Baker CJ, Holderied MW, editors. Bat-inspired
ultrasound tomography in air. 2010 IEEE Radar conference; 2010: IEEE.
30. Møhl B. Target detection by echolocating bats. Animal sonar: Springer; 1988. p. 435-
50.
31. Bazley E. Sound absorption in air at frequencies up to 100 kHz. National physical lab
Teddington; 1976.
32. Cohen J. Statistical power analysis for the behavioral sciences. Hillsdale, NJ: Lwrence
Erlbaum Associates. Inc; 1988.
33. Magrini U, Ricciardi P. Surface sound acoustical absorption and application of panels
composed of granular porous materials. Proceedings of Inter-Noise 2000. 2000:27-30.
34. Berardi U, Iannace G. Acoustic characterization of natural fibers for sound absorption
applications. Building and Environment. 2015;94:840-52.
35. Bartholomew GA, Heinrich B. A field study of flight temperatures in moths in relation
to body weight and wing loading. Journal of Experimental Biology. 1973;58(1):123-35.
36. Rydell J, Lancaster WC. Flight and thermoregulation in moths were shaped by
predation from bats. Oikos. 2000;88(1):13-8.
37. Dudley R. The biomechanics of insect flight: form, function, evolution: Princeton
University Press; 2002.
38. Surlykke A. Interaction between echolocating bats and their prey. Animal sonar:
Springer; 1988. p. 551-66.
39. Barclay RM. Echolocation strategies of aerial insectivorous bats and their influence on
prey selection. Animal Sonar: Springer; 1988. p. 595-9.
40. Cassel-Beraud A, Richard CJBdlSdpeedsf. The aerobic intestinal flora of the
microchiropteran bat Chaerephon pumila in Madagascar. 1988;81(5):806-10.
41. Holderied MW, Korine C, Fenton MB, Parsons S, Robson S, Jones G. Echolocation
call intensity in the aerial hawking bat Eptesicus bottae (Vespertilionidae) studied using stereo
videogrammetry. Journal of Experimental Biology. 2005;208(7):1321-7.
42. Holderied MW, von Helversen O. Echolocation range and wingbeat period match in
aerial-hawking bats. Proceedings of the Royal Society of London B: Biological Sciences.
2003;270(1530):2293-9.
43. Fenton MB, Faure PA, Ratcliffe JM. Evolution of high duty cycle echolocation in bats.
Journal of Experimental Biology. 2012;215(17):2935-44.
44. Kober R, Schnitzler HU. Information in sonar echoes of fluttering insects available for
echolocating bats. The Journal of the Acoustical Society of America. 1990;87(2):882-96.
45. Neil TR, Holderied MWJB-IR, Nature SLf. The biosonar arms race between bats and
insects. 2017:109.
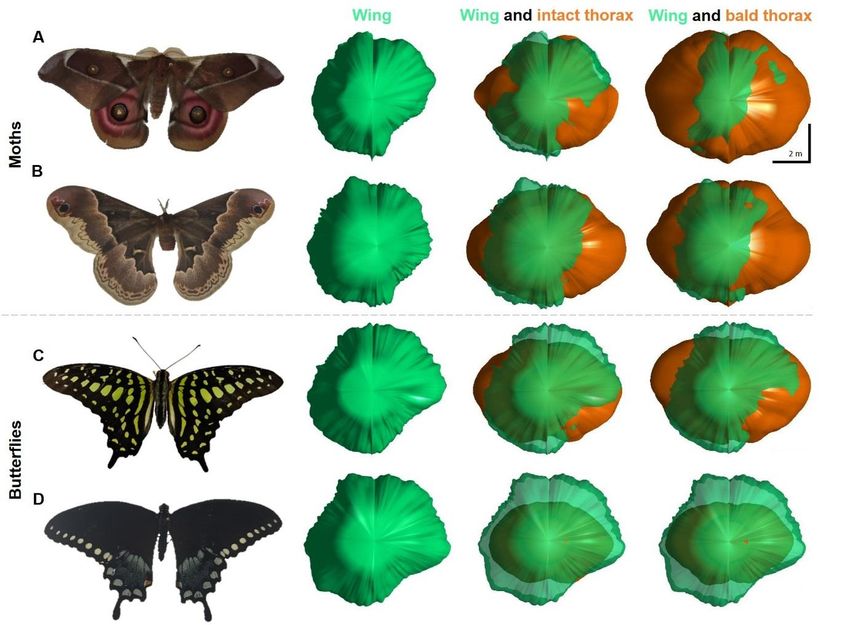
Figures and tables

Figure 1. Acoustic tomographic images based on the full frequency range (20-160 kHz) for the moths A. suraka,

C. promethea and the butterflies G. agamemnon, P. troilus across the three experimental conditions based on 720

echoes with a 360° view each. Grey scale images (A-F, M-R) are on a linear echo amplitude scale (arbitrary units).

False-colour images (G-L, S-X) show the same data converted to target strength in dB at 10 cm. Background

colour indicates experimental condition: yellow = ‘Intact’; blue = ‘Tegula removed’; red = ‘Bald’. The

loudspeaker and microphone assembly were pointing at the centre of the insects from 20° elevation.
Figure 2. Mean relative target strength of the thorax as a function of frequency (A, B, C, D) and sound incident

angle (E, F, G, H) for the four species: A. suraka (A, E), C. promethea (B, F), G. agamemnon (C, G) and P.

troilus (D, H). Target strengths were normalised across all seven elevation angles measured by setting the

maximum target strength in the bald treatment to 0dB, the resultant plots are changes in target strength

integrated across seven elevation angles (10°-70°). Yellow lines are intact specimens, blue have the tegulae

removed and red are bald. Shaded area indicates the standard deviation of the sample means (n=7 elevation

angles; 5040 echoes across each). Colour bars indicate regions of significant difference between treatments.

Shaded area indicates the standard deviation of the sample means.
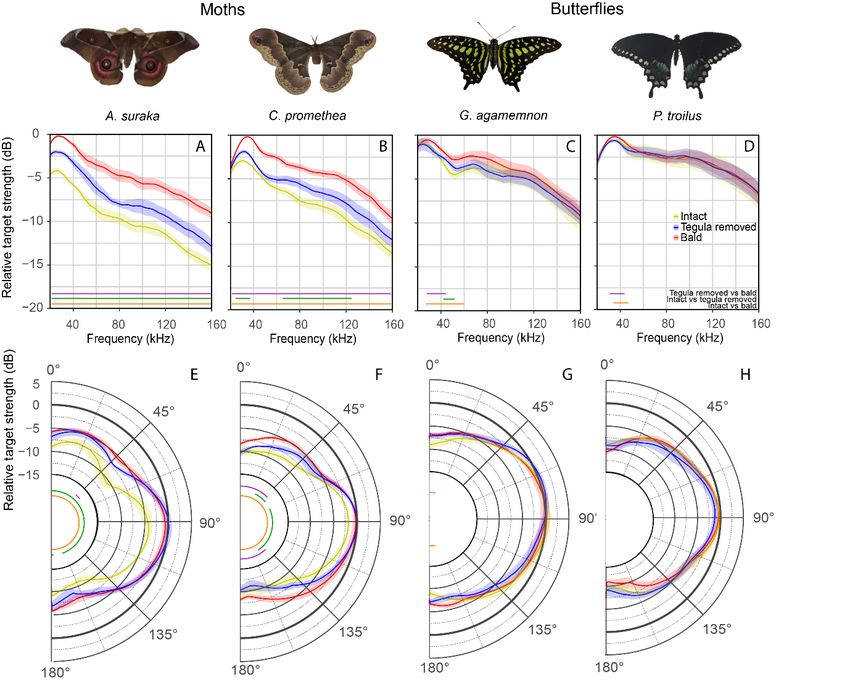
Figure 3. 3D visualisations of the right forewing, intact thorax and bald thorax detection range over the upper

hemisphere (0-360 degree azimuth in 0.5 degree steps, 10-90 degree elevation in 10 degree steps) for A. suraka

(A), C. promethea (B), G. agamemnon (C) and P. troilus (D). The top in each plot indicates the frontal direction

of the animal and the centre of each plot the direction of normal (90 degree elevation) sound incidence.
Figure 4. (A) False-colour microCT 3D model of the thorax of Antherina suraka bisected along the axial plane.

Voxel size 2.6 x 2.6 x 2.6 µm, model size 5.8 x 5.8 x 4 mm. (B) Total porosity as a function of fur depth analysed

from a 2.9 x 0.9 x 1.4 mm sub-volume of (A) taken above the right tegula, (C) side view of that sub-volume.

Depth axis is aligned with (B). inset: 3D model of a section of one individual hair. Scale bar 5 µm.
You can also read