New Zealand Petroleum Conference 2018 - Investment Forum - Kupe March 2018
←
→
Page content transcription
If your browser does not render page correctly, please read the page content below
New Zealand Petroleum Conference
2018
Investment Forum - Kupe
March 2018

Paul Ruediger – Finance & Commercial Manger, Generation & Wholesale

GENESIS ENERGY LIMITED
Agenda

         Kupe fundamentals

         Genesis portfolio fit

                                 2
Development history
— discovered in 1986, explored through to FID in 2006, with first gas produced 2009
The Kupe interest
— current day Joint Venture arrangements                                                                                2018
                                                                                                                 NZOG
                                                                                                                  4%
  • Genesis has a 46% interest in the Kupe oil and gas JV having
    acquired the NZOG 15% with effect from 1 January 2017:

         • Other partners are Beach Energy 50% (operator) and NZ                                                               Beach Energy
           Oil and Gas 4%                                                                          Genesis
                                                                                                    46%
                                                                                                                                   50%

         • Genesis receives 46% of the gas offtake (and purchases
           the balance from the other JV partners – first right to all
           gas). It also receives a 46% share of the light crude oil
           and LPG output                                                                   2009
                                                                                   Mitsui
         • Gas excess to requirements is sold onto the wholesale            NZOG
                                                                                    4%

                                                                             15%
           market or bilateral deals are negotiated with a number
           of counterparties including some of New Zealand's
           major businesses.
                                                                                                             Origin Energy
                                                                                                                  50%
  • The Kupe investment provides Genesis with diversified earnings
    largely unaffected by the New Zealand electricity market
                                                                         Genesis
                                                                          31%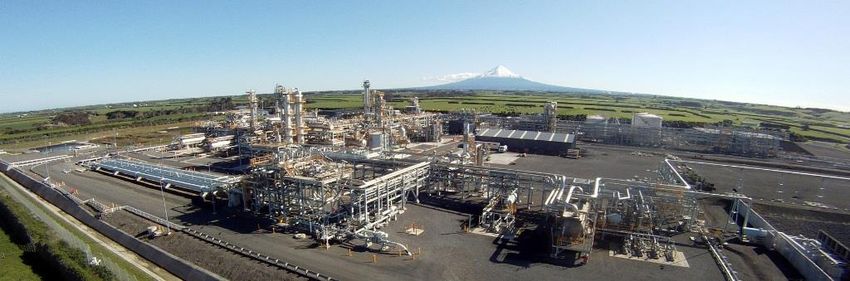
Kupe offshore production
— one of three offshore producing gas fields in Taranaki

• The Kupe oil and gas field is located 3 km beneath the
  seabed, 30 km off the coast of South Taranaki

• The wellhead platform sits over the field in 35m of water

• Platform connected to the onshore production station by a
  30 km pipeline and a 160mm diameter umbilical utility cable

• The platform sits over three production wells and has two
  main parts:
       • 51m tall jacket sitting on seafloor
       • 37m high topsides above the jacket

• The platform can accommodate up to 6 wells (3 unused well
  slots) and is unmanned as processing is done onshore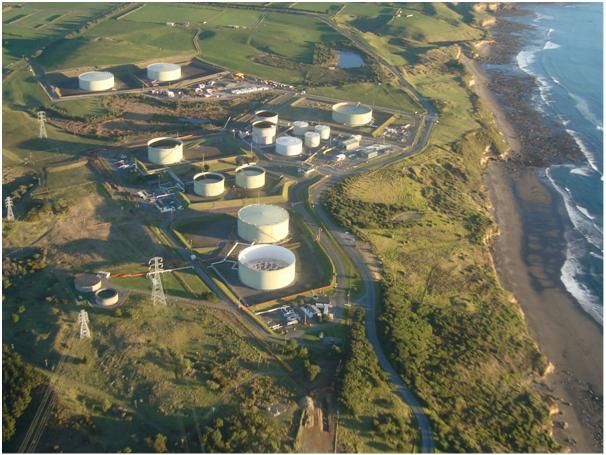
Kupe onshore production
— plant availability consistently above 97% target

 • Condensate and LPG separated out
                                                                                                                     Sales gas     Sales gas
 • Treatment to remove contaminants                                                                                compression     metering

 • Residual gas is compressed and exported through a 11.7 km sales
                                                                                                        Gas             Gas
   gas pipeline to the national grid                                                 CO2 removal
                                                                                                     dehydration   fractionation

 • Covering over 7.6 hectares of land, the production station includes:
       • more than 56 km of piping                                        Wellhead
                                                                                     Slugcatcher
                                                                                                                        LPG           LPG
                                                                          platform                                 Fractionation    Storage
       • 120 km of electrical cable
       • 8 x LPG storage bullets – 300 tonne capacity each
       • 2 x 9,500 bbl condensate storage tanks
       • administration and control buildings                                        Condensate
                                                                                     stabilisation
                                                                                                     Condensate
                                                                                                       storage
                                                                                                                                     Omata
                                                                                                                                   Tank Farm
       • five truck loading bays for LPG and light crude
       • three flare systems for releasing gasses to depressurise plant
       • a laboratory and wetlands                                                    Produced
                                                                                        water
Kupe tank farm and export facilities
— approx. 1.3 mbbl oil produced and exported each year

  • The tank farm and export pipeline is located 70 km from the
    Kupe Production Station alongside Port Taranaki

  • Light crude is trucked from the production station and stored
    at the tank farm until ready to be pumped to Port Taranaki and
    loaded into oil tankers

  • Tank farm includes:

        • 2 x 85,000 bbl light crude oil storage tanks and
          associated hot water system and mixers

        • 2 truck unloading bays

        • 3.6 km export pipeline to the Port of Taranaki tanker
          terminal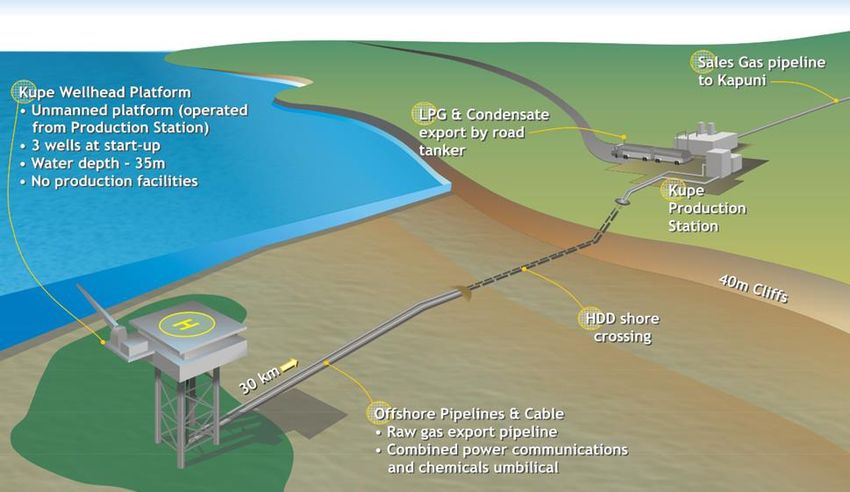
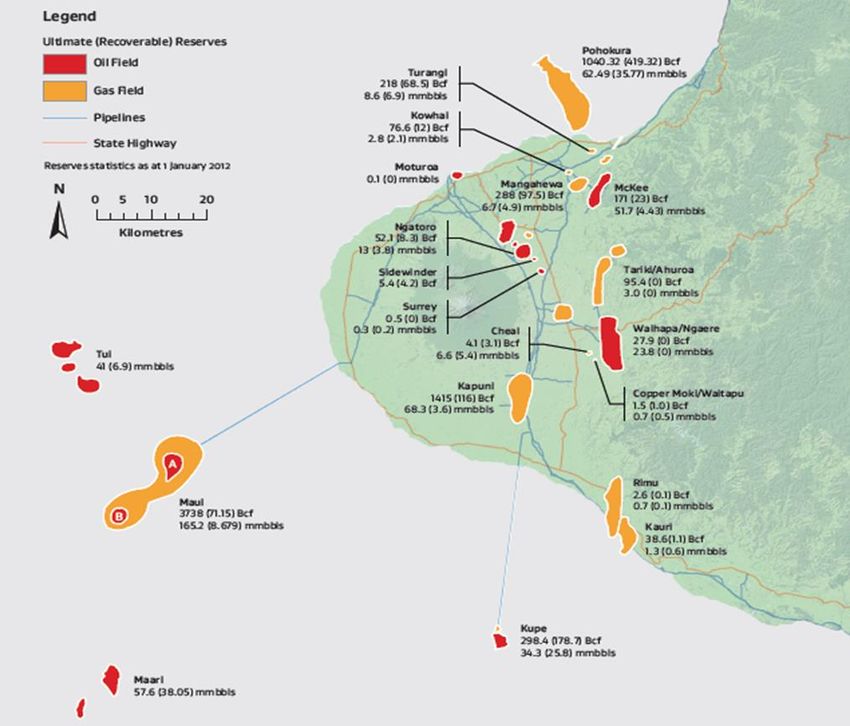
Taranaki oil and gas fields
— geographical context

Genesis portfolio fit
— only integrated energy management company in New Zealand

KEY INFORMATION

Revenue: NZ$2.0 billion

EBITDAF Guidance (FY18): NZ$350-360 million                  ,
Dividend Yield: 6.7%

Share Price: NZ$2.40

Market Capitalisation: NZ$2.4 billion

Average Daily Turnover: 750,000 shares

Credit Rating: BBB+ (Standard & Poors)

Genesis Energy is a large, fully integrated energy
management company. It is New Zealand’s
largest energy retailer, generates electricity from
a diverse portfolio of thermal and renewable
assets located throughout the country, and has
an interest in the Kupe oil and gas field offshore
of Taranaki.

                                                                 9
10
FY17   10
            10
Business strategy
— five key strategic initiatives underpin our transformation
REIMAGINING ENERGY
to put control in our customers’ hands
Optimise Innovate Invest
To improve short term return For medium term growth For long-term value creation
Core
Strategic
Deliver operational Increase value share Targeted growth in
Initiatives Grow LPG category Build energy
excellence and value of residential business category
optimisation category services
Insights and Analysis
Foundation investments in technology & digital
Enabling
Embed data-driven decisions
Initiatives
Ways of working
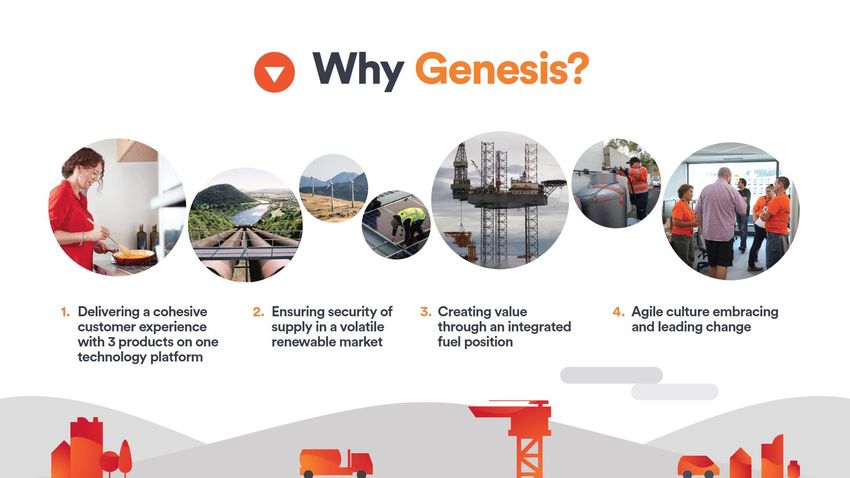
11Financial strategy: FY21 target
— target to deliver $400 - $430 million by FY21
$15m -$20m
$12m -$17m
$13m -$17m
$6m -$10m $2m -$3m
$5m -$8m $400m -
$9m -$14m
$5m -$8m $430m
$385m -
$410m
$333m
FY17 EBITDAF Operational Residential Business Grow LPG Energy Kupe Core growth 4 Original Nova Energy Revised FY21
excellence value share category category services FY21 EBITDAF retail LPG EBITDAF
growth target business 3 target
NOTES
1. Several initiatives are interdependent. As an example, energy services capability will contribute towards residential value share
2. All ranges are net of operational investment required to achieve target outcomes
3. Represents acquired EBITDAF in the acquisition of the Nova Energy retail LPG business not in original FY21 target. $4-6 million of synergies from the acquisition will be reflected in the
“grow LPG category”
4. Core growth represents partial benefit from the rolling off of the take or pay gas contracts and natural growth in wholesale prices over time
12Investor Strategy
— continued growth in dividends with a 8.6% gross yield1 and outperformance of TSR relative to peers
• FY17 16.6c of dividends declared up 1.2% representing a cash yield of 6.7%. Dividend policy to grow in real terms
over time with 3.8% growth delivered in past three years against inflation of 2.5%
• TSR target of top quartile, translating to ~14%, with a focus on dividend yield plus growth
• TSR has exceeded market by 7.2% and peer index by 4.1% in past 12 months
DIVIDEND & PAYOUT HISTORY 2017 TOTAL SHAREHOLDER RETURN
200 100%
84%
Total Dividends Paid ($millions)
180 80% 81% 81% 90% 2017 closing share price: $2.52
73% 29.2%
160 80%
% of Free Cash Flow
25.1%
140 70%
22.0%
120 60%
100 50%
80 160 164 166 40%
60 130 30%
114
40 20%
20 10%
0 0%
FY2013 FY2014 FY2015 FY2016 FY2017
Jan Feb Mar Apr May Jun Jul Aug Sep Oct Nov Dec
Total dividends paid Total Dividend Paid as % of FCF
Genesis Peer Index NZX50
1. Gross yield based on closing share price as at 29 December 2017.
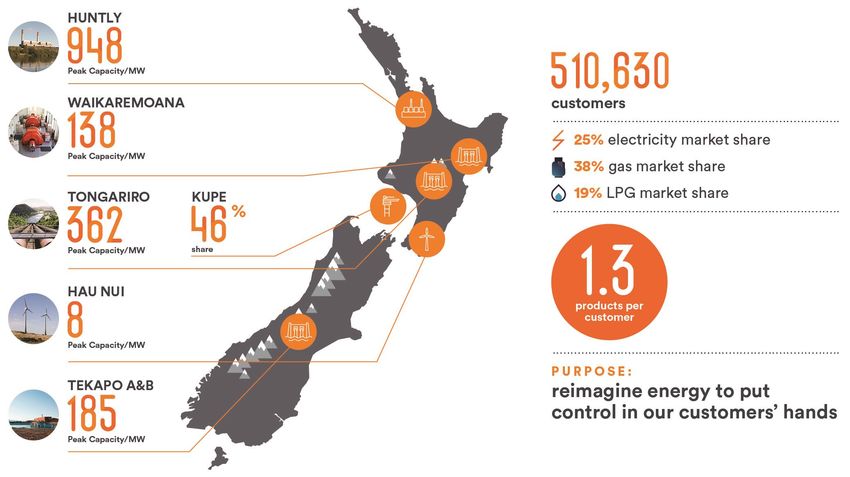
13Kupe contribution & outlook
— a diverse portfolio delivering consistent earnings over time
• HY18 EBITDAF $200 million, up 28%, FY18 guidance of $350 - $360 million
• NPAT down 24% to $28 million, due to fair value movements, underlying earnings up 14% to $43 million
Kupe HY18 financial performance
• Impact of 15% additional stake and strong production EBITDAF BY SEGMENT
levels to support thermal plant
$ MILLIONS
400 55
EBITDAF up $24 million (75%) to $56 million 50
350
94 80 84
Gas sales 6.1PJ up 61% 300 107 45
Oil sales 241kbbl up 64% 40
250
LPG sales 22.7kt up 96% 35
200 201 194 176 56
169 30
150
Kupe Outlook 106
25
100
• Brent crude up 20% in 2017 with consensus outlook for 20
50 103 110
2018 in the range of US$59 to $62/bbl 83 87
58
15
• LPG supply/demand balance tightening with a possible 0 10
FY14 FY15 FY16 FY17 HY18
move to net import early 2020’s
• Phase II Development – approx. $90m FY20-22 Customer Generation & Wholesale Kupe Corporate
14Genesis Energy
— our purpose is to reimagine energy, to put control in our customers’ hands
• Company strategy
• Deliver operational excellence and value optimization K
• Increase value share of residential category
• Grow business 2 business & LPG categories K
• Build energy services
• Financial strategy
• Deliver EBITDAF of $400 - $430 million by FY21 K
• Investor strategy
• Deliver yield plus growth, target top quartile TSR (~14%) K
K identifies Kupe contribution
15You can also read