OAG FREQUENCY & CAPACITY STATISTICS - APRIL 2021 - MAKE SMARTER MOVES

Page created by Sally Brown
 
CONTINUE READING
OAG FREQUENCY & CAPACITY STATISTICS - APRIL 2021 - MAKE SMARTER MOVES
APRIL 2021

OAG FREQUENCY &
CAPACITY STATISTICS
                      MAKE SMARTER MOVES
SEATS BY REGION
                                                 Seats in           Change v                  Change v                                                Seat Capacity April 2021 v April 2019
Region                                           Apr-21             Apr-19         % Change   Mar-21           % Change
 Africa : Central/Western Africa                         1,773,219          -27.1%                     6.6%
 Africa : Eastern Africa                                  1,817,105       -39.0%                     -6.0%
 Africa : North Africa                                  1,985,836          -57.8%                    13.7%
 Africa : Southern Africa                                 1,721,141        -48.9%                    17.2%
 Asia : Central Asia                                      943,556         -39.4%                       8.7%
 Asia : North East Asia                               87,943,659           -13.9%                      2.1%
 Asia : South Asia                                    16,202,472            -17.5%                   -0.5%
 Asia : South East Asia                               20,879,055           -50.8%                      5.3%
 Europe : Eastern/Central Europe                        9,226,207         -48.0%                     20.8%
 Europe : Western Europe                              24,586,451           -75.3%                    27.0%
 Latin America : Caribbean                               2,280,111         -44.7%                     -3.1%
 Latin America : Central America                        7,405,263          -26.4%                      7.2%
 Latin America : Lower South America                    5,944,100          -59.8%                   -21.0%
 Latin America : Upper South America                     4,171,428         -40.7%                      9.4%
 Middle East                                             8,708,107         -53.2%                       7.1%
 North America                                        66,604,669          -35.3%                        1.7%
 Southwest Pacific                                      7,563,370          -37.8%                    15.5%
 Global                                              269,755,749           -42.1%                      4.7%
 Source: Schedules Analyser

            Seats (m) added/removed in each region in the last month                                            KEY POINTS
            vs previous month
                                                                                                                       NOTE: For the remainder of this year we will compare data for the current month to the same month in
                                                                                                                        2019, before the pandemic began, as well as to the previous month in 2021.
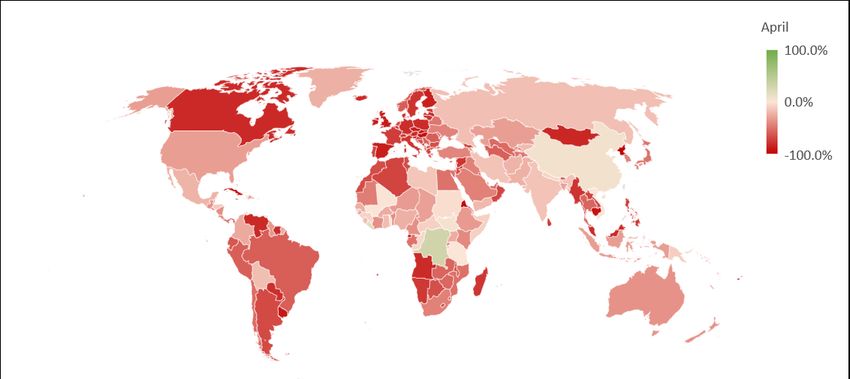
                                                                                                                       Globally, seat capacity is 42% below April 2019 levels, at 269.7m seats this month. Compared to last
                                                                                                                        month, capacity has increased by nearly 5% with growth across most regions. The notable exception
                                                                                                                        is Lower South America where capacity has fallen back by 21% , or by 1.5m seats, compared to March
                                                                                                                        2021.
                                                                                                                       By comparison to April 2019, Western Europe trails other regions, with capacity sitting at just 25% of
                                                                                                                        2019 levels. North East Asia (powered by China’s domestic market) sits at just 14% below April 2019.
                                                                                                                       Many other regions sit around the halfway mark, with North America and the Southwest Pacific
                                                                                                                        regions outperforming that at -35% and -38% below 2019 levels as these markets start to tentatively
                                                                                                                        reopen. Carriers have increased seats by 16% in the last month in the Southwest Pacific with the
                                                                                                                        news that a trans-Tasman bubble between Australia and New Zealand is finally getting off the ground.

 © OAG Aviation Worldwide Limited | April 2021                                                                      Page 1                                                                                    WWW.OAG.COM
TOP TWENTY COUNTRY PAIRS                                                                                         Seat Capacity April v March 2021
                                                   Seats in       Change v                          Change v
Country Pairs                 Country Pairs        Apr-21         Apr-19          % Change          Mar-21        % Change
 MX-US                Mexico-USA                       2,941,124           -9.0%                            -1.2%
 AE-IN                UAE -India                       1,239,864         -25.7%                             4.2%
 PR-US                Puerto Rico-USA                    916,648           15.3%                            6.4%
 RU-TR                Russian Federation-Turkey           851,327          36.5%                           81.7%
 DO-US                Dominican Rep-USA                  826,047            13.7%                          -2.8%
 DE-ES                Germany-Spain                      740,317         -74.4%                            64.1%
 DE-TR                Germany-Turkey                     538,370         -62.5%                          33.5%
 AE-PK                UAE -Pakistan                      444,973         -23.3%                            -4.5%
 GB-US                United Kingdom-USA                 372,361         -83.9%                           22.4%
 RU-UA                Russian Federation-Ukraine          371,671          15.0%                          50.7%
 EG-SA                Egypt-Saudi Arabia                 364,956         -57.0%                           25.7%
 CO-US                Colombia-USA                       338,134           -15.1%                          14.2%
 ES-FR                Spain-France                       332,078         -77.4%                           47.2%
 JM-US                Jamaica-USA                        302,288          -31.2%                         -14.1%
 DE-US                Germany-USA                        287,050         -72.9%                             5.0%
 NL-US                Netherlands-USA                    274,222         -57.6%                              8.8%
 CR-US                Costa Rica-USA                     262,378          -18.4%                          -4.0%
 JP-US                Japan-USA                           257,185        -73.8%                             5.4%
 US-VI                USA-US Virgin Islands              253,274          108.1%                           -7.3%
 FR-US                France-USA                          251,757        -70.8%                             9.4%

KEY POINTS                                                                               Source: Schedules Analyser
      The Russian Federation-Turkey is the country pair seeing the highest rate of growth this month when compared to last
       month, with carriers increasing capacity by 82%, equivalent to nearly 0.4m extra seats. This may be short lived
       however, with Russia announcing this week that air service between the two countries will be restricted from mid April to
       June 1st due to high numbers of COVID cases in Turkey.
      There is also strong capacity growth taking place between Germany and Spain, and Germany and Turkey as carriers
       anticipate these country markets re-opening for travel.
      There is also strong capacity growth for Spain-France which may be subject to change given France has gone back into
       lockdown again for a month.
      The Top 20 markets today are quite different from what they were 2 years ago with large markets such as Spain-UK,
       Canada-US and Japan-South Korea missing from todays list, and what were smaller markets previously now appearing.
      Five of the Top 20 markets have reached capacity levels beyond those recorded in April 2019, with three of these key
       US outbound leisure markets, reflecting the appetite for travel.
 © OAG Aviation Worldwide Limited | April 2021                                                        Page 2
                                                                                                                                                                 WWW.OAG.COM
TOP TWENTY AIRLINES                                                                                   Flights in April v March 2021
                                        Flights in     Change v                      Change v
Airlines                                Apr-21         Apr-19         % Change       Mar-21      % Change
 American Airlines                           140,377          -26.7%                        5.2%
 Delta Air Lines                              113,105        -30.5%                         0.7%
 United Airlines                              86,856          -41.8%                       -2.7%
 Southwest Airlines                            82,123         -30.7%                      -0.2%
 China Southern Airlines                      65,356             2.7%                       0.5%
 China Eastern Airlines                         64,811           2.1%                       2.4%
 Air China                                     42,148            4.9%                       5.8%
 IndiGo                                       36,834           -10.7%                     -4.8%
 Alaska Airlines                              30,900          -18.4%                        4.1%
 Shenzhen Airlines                            22,659             3.1%                       2.4%
 Turkish Airlines                              21,476        -42.0%                       13.2%
 Xiamen Airlines Company                      20,490             5.8%                       0.2%
 Hainan Airlines                               20,481          -11.3%                       7.4%
 China Express Airlines                        20,198         114.3%                     -15.0%
 Sichuan Airlines                              19,645            7.4%                      -1.4%
 JetBlue Airways Corporation                   19,370         -38.5%                        5.8%
 Shandong Airlines                              17,817           6.2%                     -2.0%
 Aeroflot Russian Airlines                     17,398        -40.5%                      20.0%
 LATAM Airlines Group                          16,600         -54.7%                      -11.9%
 Qantas Airways                                16,596         -24.7%                       12.8%

                                                                                   Source: Schedules Analyser
 KEY POINTS
     Aeroflot and Turkish Airlines had planned to add the most capacity, as a percentage of last months’ capacity, in
      April 2021, at 20% and 13%, respectively. However, rising COVID cases in Turkey mean that Russia has
      announced restrictions on travel to Turkey until June 1st which may impact capacity for these countries over the
      coming months.
     China Express Airlines, continues its growth trajectory with more than twice the capacity planned in April 2021
      compared to April 2019. However, month-by-month capacity adjustments are inevitable with growth like this and
      in April capacity will be 15% less than in March 2021.
     The Top 4 airlines in the world continue to be based in the US and of these American Airlines is furthest down
      the road to capacity recovery with seats in April 2021 just 27% below where they were 2 years ago, and 5% more
      seats operating than last month.
 © OAG Aviation Worldwide Limited | April 2021                                                       Page 3
                                                                                                                                                         WWW.OAG.COM
TOP TWENTY AIRPORTS                                                                                      Seat Capacity April v March 2021
                                          Seats in      Change v                        Change v
Airports                                  Apr-21        Apr-19         % Change         Mar-21              % Change
 Atlanta                                     3,909,208         -25.6%                              -0.4%
 Guangzhou                                   3,620,661            0.6%                               2.4%
 Chengdu                                      2,966,192         14.3%                               -1.9%
 Beijing                                     2,943,173        -40.3%                                 4.1%
 Dallas/Fort Worth                           2,935,948         -14.3%                              -3.3%
 Denver                                      2,794,384         -10.6%                               -1.0%
 Shenzhen                                    2,785,304            6.1%                               1.6%
 Delhi                                       2,704,951          -11.6%                               6.2%
 Chongqing                                   2,609,502          26.6%                              -3.0%
 Shanghai Pudong                             2,535,816        -33.9%                                 1.3%
 Xi'an Xianyang Apt                          2,529,249            9.3%                               6.9%
 Kunming                                     2,407,762            2.8%                             -3.6%
 Jakarta                                     2,395,318         -22.9%                              -9.0%
 Shanghai Hongqiao                           2,388,570            6.7%                               0.8%
 Beijing Daxing                              2,387,383                                              11.8%
 Tokyo Haneda                               2,346,332          -48.5%                              15.5%
 Charlotte                                   2,269,850           -7.7%                               5.6%
 Chicago O'Hare                              2,268,193         -45.2%                                5.0%
 Los Angeles                                 2,209,523         -47.3%                                3.5%
 Hangzhou                                    2,056,602            8.0%                              0.4%
KEY POINTS                                                                            Source: Schedules Analyser

 Atlanta Airport, hub to Delta Air Lines, retains its position as the world’s busiest airport and while capacity is still
   26% below where it was in April 2019, it is barely changed from last month.
 United Airlines and American Airlines hubs at Dallas Ft. Worth, Denver and Charlotte are operating much closer to
   the April 2019 capacity level, benefitting from leisure sun and ski traffic, while Chicago O’Hare and Los Angeles
   show least signs of capacity recovery.
 Of the airports listed this month in the current Top 20, Tokyo Haneda saw the largest growth vs the previous
   month. However, the airport is still playing catchup as capacity at Japan’s largest airport remains at almost half
   where it was this time in 2019.
 Both Beijing Capital Airport and Beijing Daxing Airport have seen capacity grow this month compared to March
   2021, with growth of 16% at Daxing, and pointing to recovery in the Beijing market which has been affected by
   travel restrictions more than most other parts of China.
© OAG Aviation Worldwide Limited | April 2021                                                           Page 4
                                                                                                                                                            WWW.OAG.COM
COVID19 IMPACTS
 Each week in the month capacity for the full month continues to be revised
 downwards as carriers adjust capacity.                                                                                Top 10 Biggest Domestic Markets Seats
                                                                                                                              April 2021 v 2020 & 2019
                                                            KEY POINTS
                                                                                                                           Seats (m)
                                                             Between the beginning and end of March 2021                                -        50,000,000 100,000,000
                                                              capacity was reduced by just 4%, the lowest
                                                              downward adjustment, aside from December                          China
                                                                                                                                                             20%
                                                              2020, for the past year.
                                                             This shows that airlines are needing to make                        USA
                                                                                                                                                          -27%
                                                              fewer late schedule changes and represents
                                                              greater certainty for booked passengers.                           India
                                                                                                                                              -5%
                                                                                                                             Indonesia
                                                                                                                                             -20%

                                                                    KEY POINTS                                                  Japan
                                                                                                                                             -35%

                                                                     China remains the largest domestic scheduled air     Russian Fed
                                                                                                                                             8%
                                                                      market in terms of capacity operating, followed by
                                                                      the US. Pre pandemic their positions were               Vietnam
                                                                      reversed.                                                              42%
                                                                     In April 2021 capacity in China is 20% higher than     Australia
                                                                      in April 2019, while US capacity is 27% below the                      -21%
                                                                      April 2019 level.                                        Mexico
                                                                     Of the current Top 10 domestic markets, Russia                         -16%
                                                                      and Viet Nam are exhibiting the most growth, with
                                                                                                                                Brazil
                                                                      Russia operating 8% more seats (12 million) in                         -57%
                                                                      April 2021 than in April 2019, and Vietnam
                                                                      operating 42% more (1.6 million).
                                                                                                                             Apr-19      Apr-20     Apr-21
  Source: Schedules Analyser

© OAG Aviation Worldwide Limited | April 2021                         Page 4
                                                                                                                                                       WWW.OAG.COM
FREQUENCY & CAPACITY STATISTICS DECODED
       All data is sourced from OAG Schedules and is for the current month and previous months. Change in
        capacity and frequency is then calculated in each category against the same month in 2019 and against the                                                                   BLOG SUBSCRIPTION
        previous month. Data is unadjusted for the leap year effect. Last month we shifted to ranking the Top 20’s
                                                                                                                                                                                    For all the latest news,
        (Country Pairs, Airlines and Airports) by the current month, rather than using pre-COVID rankings.                                                                           insight and analysis,
                                                                                                                                                                                    register to receive our
       There are four categories as defined below:                                                                                                                                           blog.
          1. Seats by Region is seat capacity for the current month to, from and within each global sub region.
          2. Top 20 Country Pairs are those international country pairs with most seat capacity based on the
              current month.
                                                                                                                                                                                      SUBSCRIBE NOW
          3. Top 20 Airlines are the 20 largest global airlines by flights based on the current month.
          4. Top 20 Airports are the 20 largest airports by capacity based on the current month.
          5. Each category includes a comparison in each of the above categories against the previous month, to
              highlight where frequency and capacity may be starting to recover.
          6. Data for April 2021 is based on OAG Schedules data as of 12th April 2021

  Introducing OAG Analyser – a powerful analytical platform to drive growth
  Request a free trial here

Usage and attribution
This information can be reproduced either in whole or in part, online or in print, for non-commercial purposes only but must include attribution to OAG and a link to www.oag.com

© OAG Aviation Worldwide Limited | April 2021                                                                             Page 5
                                                                                                                                                                                           WWW.OAG.COM
You can also read