DISCUSSION PAPER - Newfoundland and Labrador Weathering the Storm? Newfoundland and Labrador Federation of Labour in Partnership with the Canadian
←
→
Page content transcription
If your browser does not render page correctly, please read the page content below
DISCUSSION PAPER

Newfoundland and Labrador Federation of
 Labour in Partnership with the Canadian
      Centre for Policy Alternatives

 Newfoundland and Labrador
   Weathering the Storm?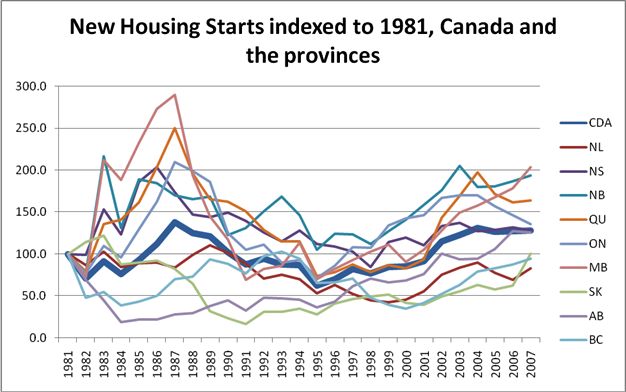
Table of Contents
Introduction........................................................................................................... 2
Putting the Economy in Context ........................................................................... 3
   The Global Economy ........................................................................................ 3
   The Canadian Economy.................................................................................... 4
   The Newfoundland and Labrador Economy...................................................... 5
Key Trends, Outcomes in the Current Economic Climate .................................... 9
   Income Inequality.............................................................................................. 9
   Household Debt .............................................................................................. 10
   Bankruptcies ................................................................................................... 11
   Affordable Housing ......................................................................................... 12
   Rural-urban Shift............................................................................................. 13
   In and Out-migration ....................................................................................... 14
Conclusion.......................................................................................................... 17
Challenges worth Discussing:............................................................................. 20
   The Challenge of Urbanization........................................................................ 20
   The Challenges of Rural and Remote Life ...................................................... 20
   The Challenge of Plenty.................................................................................. 21
Newfoundland and Labrador Federation of Labour

Introduction

The global recession that has rapidly taken root in the past year threatens to
leave no nation, province, or territory unscathed. Canada’s economy is already
being battered by job losses, shrinking GDP, rising bankruptcies, a slowing
housing market, and the return of public fiscal deficits. Thanks in large part to the
oil sector, the economy of Newfoundland and Labrador has been more resilient
to the current recession than most other Canadian provinces. But the effects of
the global recession do not stop at the border, and new pressures are quickly
coming to bear.

Though Newfoundland and Labrador enters this recession in a stronger
economic position than ever, several challenges loom large – the impact on
forestry, mining and the fishery (all rural-based industries) and the people, towns
and regions these industries have supported is a major concern and one of the
biggest economic challenges we are facing. In many cases, these are also long-
time unionized jobs, good-paying jobs that have contributed to prosperity in
regions across the province.

Even before the recession struck, many in this province continued to struggle to
pay for housing, heat, food, education – the basics in life – without going into
debt or needing social assistance. The prospect of a burgeoning oil economy
raised hopes but it also raised new questions about how the province would
share the wealth, to ensure everyone benefited from prosperity. Action in terms
of a poverty-reduction strategy and increases to the minimum wage (which was
pushed by labour) have made a difference for people. One of the best ways to
share wealth and ensure prosperity is through the provision of strong accessible
public services.

Oil may be acting as a temporary buffer between the global recession and
economic hardship in Newfoundland and Labrador but that won’t last forever.
There are several important weaknesses in the provincial economy that leave far
too many citizens vulnerable to the winds of recession. Many have yet to enjoy
the benefits of the boom; many are unprepared for a bust. This province has a
proud tradition of making sure no one gets left behind, in good economic times
and in bad. That resolve is about to be tested once more. Now more than ever,
we need to get it right.

2        Weathering the Storm
Newfoundland and Labrador Federation of Labour

Putting the Economy in Context
The Global Economy

The world economy is in tremendous turmoil and no one knows when stability will
return. Some experts predict a fairly quick recovery within the next year; others
say this is eerily similar to the Great Depression of the 1930s, with no quick exit
in sight. Nobel Prize Winner and former World Bank chief economist Joseph
Stiglitz predicts the global recession is going to be “bad, very bad” and says “we
haven’t reached bottom yet. I’m very pessimistic.”i Former U.S. Secretary of
Labour, Robert Reich, calls it a Depression. “This is still not the Great Depression
of the 1930s, but it is a Depression.”ii On March 19, 2009, the International
Monetary Fund (IMF) forecast a half to one per cent contraction of the global
economy – the sharpest drop in 60 years (since records started being kept).iii

While it may be impossible to peer into the future with accuracy, there is much to
learn from the source of the global economic meltdown. The United States is
considered the epicentre of the originating problem. Its financial sector devised
what is known as a sub-prime mortgage, which consists of a loan to people who
generally do not earn enough money or have a good enough credit rating to
secure a regular mortgage. Once those sub-prime mortgage holders became
delinquent in their mortgage payments, it created major headaches for the U.S.
financial sector because there was an added complication. Those sub-prime
mortgages – considered bad loans – were hidden within bundles of good loans
and financial corporations across the globe had bought into those hidden bad
loans. Once the weakness in the system was exposed, financial giants such as
Bear Stearns and Lehman Brothers started to fall like a stack of dominoes.
Iceland’s financial sector was deeply embedded in these bad loans, ruining that
nation’s economy overnight. Ireland – which had been the economic success
story of Europe – is in similar dire straits.

At the heart of the meltdown is a tale of caution against corporate greed,
loosely regulated financial systems and income inequality, which has risen
consistently over the past generation – in good times and in bad – planting
the seeds of instability. As world governments scramble to revive declining
economies and stabilize their financial sectors, new questions and challenges
are emerging. The very corporate leaders, who once insisted that government
rules and taxation were the biggest impediments to economic growth, are now
turning to their governments for a way out of the mess. They are accepting the
need for their governments to spend, in hopes of stabilizing and stimulating the
economy. Fiscal deficits are now widely seen as a necessary evil. In the United
States alone, the federal government faces a $1 trillion deficit and that number
keeps climbing. Citizens across the globe are turning to their governments to
stop the downward spiral as well as to protect the jobless and the vulnerable

3       Weathering the Storm
Newfoundland and Labrador Federation of Labour

from the worst of recession. Free market ideology is now in widespread
disrepute, but what will replace it remains an unknown.

The Canadian Economy

Canada hasn’t suffered the fate of the U.S., Iceland or Ireland thanks, in large
measure, to a more regulated domestic banking system that only began
extending the sub-prime mortgages in 2006, when American lenders came into
the market offering zero down, 40-year mortgages. Only about seven per cent of
Canadian mortgages fall under the sub-prime loan category – a much more
modest figure than the 22 per cent in the U.S.iv Canada’s Prime Minister is quick
to boast about the strength of Canada’s big banks – some of which have become
the big kids on the North American block as a result of the sub-prime mortgage
meltdown. But there are several key indicators showing the nation is not immune
to the effects of the global crisis. Canada is officially in recession and predictions
about the nation’s economic fate are under constant downward revision.

The decline of the Canadian economy is continuing to unfold more sharply than
any public or private sector forecaster has been able to predict. In the last three
months of 2008, Canada’s economy fell by 0.8% and the first quarter of 2009 is
estimated to have dropped by at least 1.8%v. That performance is worse than
the opening months of both the 1981-82 and 1990-91 recessions. And the
economy may soon go from bad to worse.

To show how quickly things are unraveling, just two months before the federal
government tabled its 2009 budget, the Department of Finance envisioned a
0.8% decline in real GDP for the whole of 2009. Two months before that, even
the most pessimistic bank forecast suggested modest growth for 2009. The Bank
of Canada revised its estimates of economic decline for 2009 from 1.2% to 3.0%
in the space of weeks. The recession is hitting the Canadian economy with a
force not seen in the post-war era.

It is important to note that, before the downturn, the national economy had been
growing at an unusually strong pace for a decade. From 1997 to 2007, Canada
enjoyed its most sustained and strongest rate of growth since the 1960s. Much of
this strength came from exports to other nations. However, since its peak in
2002, Canada has lost over half a million manufacturing jobs. That slow drain
was eclipsed by the creation of over a million jobs in the same period, but losses
in the manufacturing sector are resulting in a dramatically weakened Canadian
(and, specifically, Ontario) economy.

Beyond economic growth, several other indicators show the extent of the global
recession’s impact on Canada to date. Since the downturn began, Canada has
experienced the sharpest job loss since any recession in the post-war period.
Canada lost 356,600 jobs between October and March, representing 2.1% of the
job market.
4        Weathering the Storm
Newfoundland and Labrador Federation of Labour

Several changes in the economy are driving Canada’s job loss figures. In
January 2009, sales of manufactured goods fell by 6.4% -- the largest monthly
decline since 1997. Manufacturing shipments in January were at their lowest
level in almost a decade. Vehicle shipments also dropped dramatically in
January, by 46.3%. Canadian automakers are now exporting 23% fewer vehicles
compared to 1992. While January auto sales rose by 5.5% in Canada, it wasn’t
enough to recover from December’s 14.8% drop in sales. With the prospect of a
General Motors or Chrysler bankruptcy, these numbers could get bleaker as the
year wears on. Export volumes in January also experienced a sharp drop – 7%
over the previous month. Compared to a year ago, the volume and value of
Canadian exports declined by 18.2%. Prices are falling faster than demand,
particularly for commodities such as oil. The latest numbers show the value of
Canada’s oil exports is down 29.9% compared to a year ago. The value of auto
products is down 45%.vi

Canada’s stock market lost 45% of its value between May 2008 and February
2009. It appears to have bottomed out around March 9, 2009 and has risen 20%
since then but this, too, remains unpredictable. Housing prices, meanwhile, have
been in steady decline since July 2008. The average Canadian home sold for 9%
less in February 2009 than a year ago. Sales fell by 17.1% in 2008 and are
expected to drop by 16.9% in 2009. The biggest drop in sales is concentrated in
British Columbia, Alberta and Ontario. Prices are expected to fall nationally by
9% in 2009, driven by job losses in Ontario and Western Canada. In contrast,
they are expected to rise by 4.8% in Newfoundland and Labrador.vii

The Newfoundland and Labrador Economy

As the recession takes hold across the country, Newfoundland and Labrador is
emerging as one of the best positioned provinces to weather the storm.
Traditionally Newfoundland and Labrador has entered recessionary periods more
vulnerable than most other regions of the country and has taken longer than
most provinces to recover. This recession may be different due, in large
measure, to Newfoundland and Labrador’s strong opening economic position.
The province is in a new and fortunate situation: on average, households are in a
better position than they have been in both previous recessions; and the
government has a buffer zone to help it get through harder times. In addition,
Newfoundland and Labrador’s new energy-based economy should be one of the
first to rebound as global production starts to pick up again.

Newfoundland and Labrador was a leader in the pace of GDP growth in Canada
from 1997 to 2007. During that time, Canada’s economy grew by 63.4% but
Newfoundland’s grew by 146.8% -- more than doubling in the short span of a
decade. Only two other provinces come close: Alberta’s economy grew by 123%
in that time period, Saskatchewan’s economy grew by 114%. In contrast, Ontario

5       Weathering the Storm
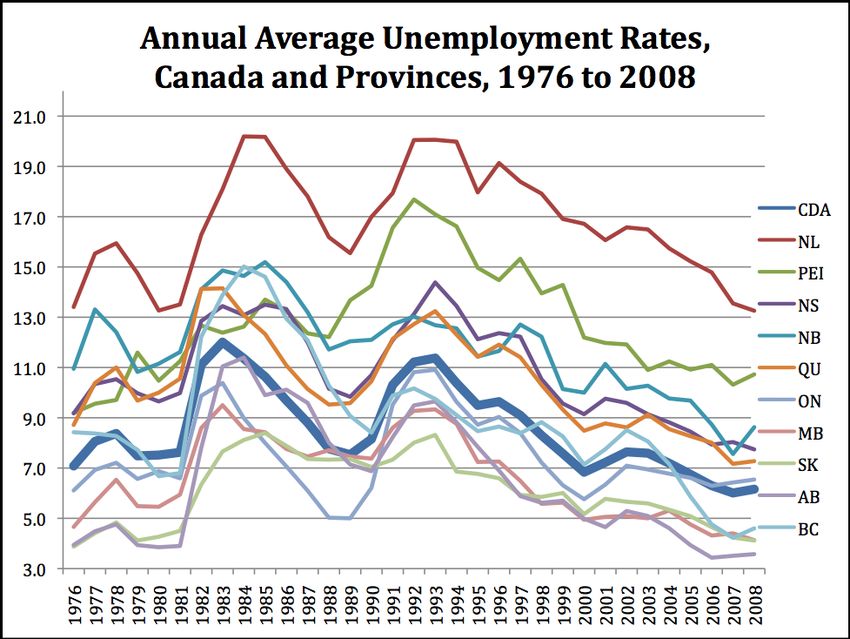
Newfoundland and Labrador Federation of Labour

– that former economic giant – experienced only a 55% growth in its economy as
its manufacturing sector entered a long and protracted decline, starting in 2002.

The province’s own budget documents say Newfoundland and Labrador steadily
improved its economic performance in the past few years. In 2005-06 the
economy grew by 9.6%. In 2006-07 it grew by 18.7%. In 2007-08 the economy
grew by 13.8%. Those numbers are on fire compared to Canada’s economy,
which grew by 4.4% in 2008. Oil is the secret weapon behind the provincial
economy, but two other oil provinces – Alberta and Saskatchewan – did not
experience the same growth spurt as Newfoundland and Labrador. This
province is in the process of building a new foundation for economic growth.

As a result of strong revenue streams from new economic activities,
Newfoundland and Labrador enters this recession with a healthier fiscal situation
than in previous recessions, but signs of a rapid downturn are within view. The
2008-09 surplus of $2.4 billion is expected to dissolve into a $749.5 million deficit
in 2009-10.

Newfoundland and Labrador has not yet felt the job loss pinch. Between October
and March, Canada lost 386,800 full-time jobs and created 30,200 part-time jobs.
In contrast, the province lost only 1,300 jobs over the same period, and between
February and March it actually added 2,000 jobs to the job market, almost all of
them full-time (1,600).

Despite a deficit, the provincial government plans on expanding spending in
health and education, as well as continuing its investments in infrastructure that
are required for the next wave of economic expansion. That could make a world
of difference to Newfoundland and Labrador’s resilience in the face of a global
downturn. Preventing job loss would strengthen the province’s recovery post-
recession.

The history of recessions in Canada shows the labour market takes much longer
to recover than does GDP growth. Some regions in Canada have taken much
longer to recover from previous recessions than others. Newfoundland and
Labrador is among them. As it stands, the province’s unemployment rate is the
highest in Canada.

6        Weathering the Storm
Newfoundland and Labrador Federation of Labour

Despite the oil boom, Newfoundland and Labrador’s economy remains highly
dependent on seasonal industries. As a result, it has a higher rate of
unemployment than anywhere else in Canada. The province’s labour market was
hard hit by the recession of 1981-82 and the collapse of cod stocks in the early-
1990s. Its unemployment rate has only recently returned to 1970s levels.

The 1981-82 recession hit Newfoundland hard because of over-capacity in the
privately owned but heavily state-subsidized expansion of the frozen fish
business. The massive restructuring of the industry that took place resulted in the
emergence of one super-company, Fishery Products International. That
company used to be owned by the federal and provincial governments and the
Bank of Nova Scotia but when it was privatized; hundreds of workers lost their
job. In fact, both the 1980 and 1990 recessions were harsh on Newfoundland
and Labrador due, in large part, to its heavy reliance on one industry: the
fisheries. Moral of the story? Don’t put all your eggs in one economic basket.
Diversification is essential in a volatile, rapidly shifting global economy.

7       Weathering the Storm
Newfoundland and Labrador Federation of Labour

Alberta stands as a case in point. The Alberta Advantage rested on its wealth of
oil. Growing global demand for oil and soaring commodity prices resulted in a
get-rich-quick dream for Alberta after the mid-1990s. Once that demand slowed
to a crawl, prices plummeted, as did Alberta’s revenues. That natural resource
superpower now faces an unprecedented $4.7 billion fiscal deficitviii, unresolved
affordable housing issues, unmanageable household debt and rising numbers of
consumer bankruptcies. This recession threatens to hit Albertans hard.

Newfoundland and Labrador may still be plagued with the highest unemployment
rates in the country, but it is better positioned than it has been in over 30 years to
weather the current economic storm. The province is coming off a record high
surplus and appears committed to spending more to stimulate the local economy
and protect citizens from the worst of recession, but how this will play out in
regions like Central NL with the loss of Abitibi, a major employer, remains
unclear. Due to its greater reliance on oil-based commodities, the province is
also likely to rebound more quickly than other regions when the global economy
comes back on track. Compared to the federal situation, Newfoundland and
Labrador is looking stronger than ever. The previous federal Liberal governments
created a $3 billion reserve, or rainy day fund, and added a ‘prudence’ factor of
$1.5 billion. Within the blink of an eye, the minority Conservative government
under Prime Minister Stephen Harper has wiped out those reserves, leaving no
cushion for hard economic times and plunging the nation into a multi-billion deficit
virtually overnight.

8        Weathering the Storm
Newfoundland and Labrador Federation of Labour

  Key Trends, Outcomes in the Current Economic Climate
  Income Inequality

  An alarming Canadian trend during the economic growth spurt of the past
  decade has been the rise of income inequality – the gap between the rich and
  the rest of us. Newfoundland and Labrador is not immune to this problem. While
  the richest 10% are doing better in Canada as well as in Newfoundland and
  Labrador, the majority are working harder for a shrinking share of the economic
  growth they helped create.

  Among those working, half of Canadians earned more than $26,850 and half
  earned less in 2005. That level of median income is considerably lower than just
  five years earlier, in 2000, when it was $28,123. Yet average incomes rose from
  $35,619 in 2000 to $36,301 in 2005. Since the richest 10% saw heavy income
  gains in those years, their pay hikes skew the average and point to an underlying
  problem of growing income inequality.

  Newfoundland and Labrador is experiencing similar trends, shown in the table
  below. Median income in Newfoundland and Labrador dropped from $19,746 in
  2000 to $18,086 in 2005. At least half of the population is earning less than they
  used to, despite strong economic growth. Average income rose from $27,103 in
  2000 to $28,002 in 2005.

EMPLOYMENT                       Median Employment                Average Employment
INCOME                           Income                           Income
                                       2000      2005                   2000      2005
Newfoundland and Labrador           $19,746   $18,086                $27,103   $28,002
St. John's                          $25,769   $24,981                $32,321   $32,801
Corner Brook                        $22,402   $20,803                $28,649   $28,628

  Like the rest of Canada, the rich in Newfoundland and Labrador got richer
  between 1976 and 2005 (the richest 30% saw income gains from the labour
  market, but especially the richest 10%). In contrast, the poorest 20% of families
  raising children under 18 fared worse, as did the middle class. Even though the
  provincial economy quadrupled over that time period, 60% of families raising
  children under 18 had lower earnings than their counterparts a generation ago.
  Their only saving grace was government support. The province managed to
  mostly offset the growth in income inequality through income supports and public
  services. As a result, the bottom 70% of families had stable or slightly improved
  after-tax incomes by 2006. The near-poor -- those in the second poorest decile --
  saw a slight erosion of their incomes. Only the top 30% enjoyed improved
  incomes compared to the generation before.

  9       Weathering the Storm
Newfoundland and Labrador Federation of Labour There is an important lesson here. As the world is noticing during this global recession, government can make a difference. In Newfoundland and Labrador, the labour market continues to reward its best-paid workers more handsomely than the majority, but public supports helped mitigate the inequality of the market, making this one of the less polarized, and more unified provinces in all of Canada. (Examples of government making a difference include actions and supports for people like the lowest tuition for post- secondary students in the country, a provincial low-income drug plan, free text books for K-12 students.) Alberta, Ontario and B.C. – three provinces experiencing the worst trends in rising income inequality and polarization, and also three of the richest economies in the country – have much to learn from the Newfoundland and Labrador experience. Labour market trends which disproportionately reward the haves for their work effort and leave the have-nots behind is a worrisome phenomenon. It is as clear and present a danger in Newfoundland and Labrador as it is in other provinces and developed nations. Household Debt Growth in income inequality explains, in part, the problem of rising household debt. The majority of Canadians, as well as Newfoundlanders/Labradorians, either had stagnant or falling incomes over the past generation while the cost of basic necessities – like housing, education and utilities -- rose. In the past decade, financial institutions loosened up access to credit, which helped mask the problem of stagnant and falling wages in the labour market while creating new dilemmas. Average Canadian household debt is “in the danger zone”, increasing six times more than average household incomes. Canadian household savings are also depleted – they’re almost as low as those in the U.S. Canada used to be a nation of savers, but average household savings have fallen below $2,000. In 1990, Canadians used to save about $7,600 a year. The personal savings rate is now at levels last seen in the late-1930s. Four provinces – B.C., Saskatchewan, Nova Scotia and PEI – were already in the negative household savings zone in 2007. Manitoba and New Brunswick were very close to the line. Only two provinces – Alberta and Newfoundland/Labrador – can be considered to have healthy rates of personal savings. Again, this province is perhaps the best positioned to weather the storm. 10 Weathering the Storm
Newfoundland and Labrador Federation of Labour

Bankruptcies

High household debt combined with stagnant or falling incomes can lead to
financial catastrophe. In Canada, there have been two emerging trends over the
past 20 years, reflecting the fact that corporate profits rose as a share of the
economy while the share of wages fell: When it comes to bankruptcy, (1)
Canadians are faring worse than ever and (2) businesses aren’t. Even before the
recession took hold, there were more consumer bankruptcies in 2008 than in
1990, the last time Canada was in recession. But the opposite is true for
business bankruptcies, which keep falling with every passing year. The latest
Canadian bankruptcy statistics report a total of 99, 282 consumer insolvency
filings in 2007. The Canadian population that year was 32,976,000. This is a rate
of three filings for every 1,000 Canadians. Alberta has the lowest rate in Canada
with 1.7 insolvencies for every 1,000. Once again, Newfoundland and Labrador
compares favourably with the rest of Canada. Consumer bankruptcies in this
province are down 13.6% from the previous year – bucking the trend unfolding
elsewhere. In Alberta, consumer bankruptcies are up by almost 55% and in
Ontario they’re up by 24%.ix

     Provinces with Double Digit Changes in the Insolvency Rate in January
                      2009 compared with January 2008.

Province                          % Increase (Decrease)

NL                                                 (13.6)

PE                                                   38.1

QC                                                     12

ON                                                   23.9

AB                                                   54.7

BC                                                   48.5

March 24th, 2009, Industry Canada

The chart below illustrates the sharp contrast between business bankruptcies –
which declined by 47% between 1990 and 2008 – while consumer bankruptcies
more than doubled by a stunning 112% even before the economy had fully
soured.

11         Weathering the Storm
Newfoundland and Labrador Federation of Labour
Business Consumer
Bankruptcies Bankruptcies
2008 6,164 90,610
1990 11,642 42,782
Increase (Decrease) (5,478) 47,828
% Increase (Decrease) (47.1%) 111.8%
March 24, 2009, Industry Canada
Affordable Housing
Household debt is driven, mostly, by housing debt. In this regard, too,
Newfoundlanders and Labradorians fare better than the rest of Canada. More
people – 78.7% -- own their homes in this province than elsewhere in Canada –
68.4%.
This is an important measure, because economic security in Newfoundland and
Labrador has long been intertwined with having control over where you live, if not
the strength of your income. As Newfoundland’s population has become more
urbanized, the home ownership ethic has migrated to the cities. Two-thirds of St.
John’s households owned their homes in 1971; today 71.5% own.
In the old days, home ownership came out of sweat and hard labour: it was a
build-it-yourself proposition. Today, home ownership is the product of financing to
buy a house someone else has built. As a result, the stakes of home ownership
are higher.
This has become more of an issue as the province continues to urbanize, partly
due to people moving to the cities and partly due to dwindling populations in rural
settings. Since Newfoundland and Labrador still has a relatively high proportion
of its population living outside its main cities (42% compared to 20% across
Canada), this is a trend to watch. Indeed, the number of new housing starts
keeps rising, raising questions about how the housing part of budgets will affect
households in Newfoundland and Labrador in the coming years.
The Following chart tracks new housing starts in Canada and all provinces since
1981. It shows Newfoundland and Labrador housing starts are below that of
many other provinces and that the province’s housing starts are still below the
level of 1981. But in recent years there has been a significant rise. This
12 Weathering the StormNewfoundland and Labrador Federation of Labour turnaround in housing starts is fascinating, considering the fact that almost 80% of Newfoundlanders and Labradorians already own their home. Rural‐urban Shift Over the past decade there has been a rapid rate of urbanization across Canada, as economic opportunities drive Canadians from rural settings into major cities. This is creating twin pressures for public policy: the needs of an aging rural population living in declining and more sparsely populated communities on the one hand; and a burgeoning population taking up residence in more expensive, densely populated urban areas. The trend is as real in Newfoundland and Labrador as it is in the rest of Canada. In 2006, 58% of Newfoundlanders and Labradorians lived in cities, compared to 80% Canadians. The Newfoundland urbanization rate may be lower than the national rate, but it is higher than any other Atlantic province and almost every territory. St. John’s is attracting the biggest share of rural migrants. Its population grew by 4.7% between 2001 and 2005. Corner Brook ranks second with a 1.8% increase in population, followed by Grand Falls-Windsor with a 1.6% increase. This reverses the trend between 1996 and 2001, when the population of all three Newfoundland-Labrador cities were on the decline. 13 Weathering the Storm
Newfoundland and Labrador Federation of Labour

The average price of a home has increased dramatically in Newfoundland and
Labrador, because of what is happening in its cities. On average, across the
province it went up by 29% in the past year – a sharp spike compared to the
national average home increase of 9.2%.

Despite high rates of existing home ownership, the issue of rising home prices is
not going to go away in Newfoundland and Labrador. The province, like all other
Canadian provinces, continues to urbanize, which brings into focus a number of
issues regarding access to services for those who remain in rural settings – in
particular for the young families with children who need access to schooling and
elderly residents who need access to health services. This is not just an issue
for markets; it is an issue for public policy.

In and Out‐migration

The people of Newfoundland and Labrador are pragmatic. When jobs are in
decline in their home province, they go where the jobs are available. As a result
of decades of job loss in the fisheries, the province has a history of population
decline that has only recently begun to reverse itself. Between 1996 and 2001,
Newfoundland and Labrador lost almost 15% of its young people (those aged 15
to 29) to other jurisdictions -- mostly to Alberta’s oil boom. The province’s
population dwindled by 31,100 people, or 6.1% of the population base, between
1996 and 2001, representing the largest net population loss in two decades and
the highest net out-migration rate of any province.

14      Weathering the Storm
Newfoundland and Labrador Federation of Labour

                   Net migrants and net migration rates by age group, provinces and
                                        territories, 1996-2001

                         Total           5-14          15-29         30-44        45-64          65 +
   Province or
    territory         Num Rate Num Rate Num Rate Num Rate Num Rate Num Rate
                      ber    (%)     ber     (%)    ber    (%)    ber    (%)   ber    (%)    ber     (%)
                          -              -              -             -            -
Newfoundland and
                      31,0     -6.1 3,36      -5.0 17,8 -14.8 7,33        -5.8 2,25    -1.6 -180      -0.3
Labrador
                        55              5            75              0            0
                                                        -
Prince Edward
                       135      0.1   95       0.5 1,11     -4.0   90      0.3 815      2.5 245        1.5
Island
                                                       0
                          -                             -
                                    1,02                                       2,24
Nova Scotia           1,27     -0.2            0.9 5,12     -3.0 -225     -0.1          1.0 800        0.7
                                        5                                         0
                         5                             5
                          -                             -             -
New Brunswick         8,42     -1.2 -395      -0.4 6,84     -4.6 1,44     -0.8 140      0.1 110        0.1
                         5                             0             0
                          -              -              -             -            -             -
Quebec                57,3     -0.9 10,3      -1.1 13,6     -1.0 17,9     -1.1 10,0    -0.5 5,35      -0.6
                        15            30             40            25            85             0
                      51,9          10,3           17,9          19,2          3,10         1,28
Ontario                         0.5            0.7           0.9           0.7          0.1            0.1
                        05            30             35            15             5             5
                          -              -              -             -            -             -
Manitoba              18,5     -1.8 1,96      -1.2 6,67     -3.0 4,61     -1.9 3,85    -1.5 1,49      -1.0
                        60              0              5             0            5             5
                          -              -              -             -            -             -
Saskatchewan          24,9     -2.7 2,42      -1.6 12,2     -5.9 5,40     -2.6 3,03    -1.4 1,86      -1.3
                        40              5            55              0            0             0
                      119,          16,4           51,9          33,7          13,6         3,68
Alberta                         4.7            4.1           9.1           5.0          2.1            1.3
                       420            00             55            90            10             5
                          -              -              -             -
                                                                                            2,91
British Columbia      23,6     -0.7 7,74      -1.6 6,05     -0.9 13,6     -1.6 960      0.1            0.6
                                                                                                5
                        30              5              0           95
                          -                                                        -
Yukon                 2,76     -9.5 -420      -8.9 -495     -8.2 -750     -9.0 1,00 -11.9     -65     -3.9
                         0                                                        0

              http://www12.statcan.ca/english/census01/Products/Analytic/companion/mob/provs.cfm#
              2

              15      Weathering the Storm
Newfoundland and Labrador Federation of Labour But Census 2006 indicates a reversal is underway. For the first time since 1991, Newfoundland and Labrador took in more people than those who left. Most came from Alberta.x By 2008, Newfoundland and Labrador was drawing more people into the province than those leaving, both from other provinces and due to international migration. Newfoundland and Labrador, as well as Saskatchewan, is benefiting the most from Alberta’s oil bust. 16 Weathering the Storm
Newfoundland and Labrador Federation of Labour

Conclusion

It’s clear Newfoundland and Labrador enters this recession in a stronger position
– economically and socially -- than previous recessions.

Buffered by an oil boom, the province is among the last to feel the pinch of
Canada’s economic downturn and well-positioned for a quick and sturdy post-
recession rebound.

But Newfoundland and Labrador’s rich history holds several important lessons
that are just as relevant today as they were in the last recession.

Economic diversification, for starters, should be an essential goal for the
province. History has shown an economy reliant upon solely one industry -- fish,
oil or hydro – makes for short-term gain but it is not the key to lasting success.
Diversification should be a core public pursuit. Yet a disconcerting trend
emerging from the global economic meltdown is a concentration of corporate
ownership in the hands of a few. This province may again be the jurisdiction to
watch, as it challenges and reframes the issue of ownership in the case of
AbitibiBowater, and forges ahead with alternatives models of ownership, such as
in the case of the fishery cooperative on the south coast of Labrador (Labrador
Fishermen's Union Shrimp Company Limited).

Newfoundland and Labrador’s proud tradition of leaving no one behind got the
province through lean economic times for the bulk of its history. That sensibility is
equally important during an oil boom as it is during recession. It makes
Newfoundland and Labrador somewhat unique within the Canadian Federation,
but several trends threaten to tear at the province’s social fabric: Urbanization,
housing costs, household debt and the impact of the recession on rural industries
and municipalities.

Urbanization is an unstoppable trend and brings with it challenging policy and
social planning implications. As the population of rural communities dwindles,
Newfoundland and Labrador will experience many of the problems other
provinces have endured for decades. Rural schools will close, leaving young
families raising children with few early learning and education options and
reinforcing the pull to move into the cities. An aging population is increasingly left
behind in towns and villages that have fewer services, rougher roads, and a

17       Weathering the Storm
Newfoundland and Labrador Federation of Labour

smaller tax base.

Meanwhile, burgeoning cities face new pressures for affordable housing and
public services. Those who leave their rural communities discover they could
afford to own their home in a small town but the cost of housing can be out of
reach for them once they live in the city. As a result, many are forced to take on
higher levels of household debt, making their financial future even less secure.
Maintaining Newfoundland and Labrador’s affordable housing market – and
building more affordable housing to meet growing demand in the cities – will be a
vital way of keeping a lid on household debt in future.

Another means of controlling household debt lies in keeping a lid on growing
income inequality. Canadian provinces with higher levels of income inequality
have experienced a troubling trend: the richest 10% not only take the majority of
new income gains, they also drive the cost of housing and other amenities in
some of Canada’s major cities. To date, Newfoundland and Labrador has done
well in minimizing income inequality – an accomplishment that is no happy
accident. The provincial government holds the strongest track record on low
levels of income inequality and it continues to play a leadership role in Canada
on poverty reduction.

Income inequality in its own right is an unsustainable phenomenon, because the
rise of the rich amid a struggling middle class and permanent underclass create
social and economic pressures that no society can withstand over the long term.
But the rise of the rich yields yet another unsustainable problem:
overconsumption of goods, which challenge our planet’s ecological sustainability.
A by-product of recessionary times worth emulating is a trend toward more frugal
consumption patterns – an embrace of the ‘less is more’ philosophy that is not
only environmentally wise, but socially more sustainable.

The rise of the rich in many other Canadian cities has driven up housing prices
with rapid speed over the past decade, plunging more households in debt than
they can truly afford. To date, Newfoundland and Labrador has resisted this trend
but may be challenged to keep it at bay in future.

A resilient economy is built on the basics: affordable housing and education (from
early child development to skill upgrading for workers); universal access to clean
water and health services (mental and physical); the ability to connect with others
(affordable transportation, broadband technology). These are the public policy

18      Weathering the Storm
Newfoundland and Labrador Federation of Labour

challenges of the past, present and future. There is still much work to do. To
date, Newfoundland and Labrador is managing to weather the current economic
storm. But will oil wealth and the current recession challenge that ability and
prevent its citizens from translating wealth into prosperity for all? That question,
and many more, is still on the table.

The critical question about the future of the province is:

How to ensure the new economy works for all citizens, not just the richest 10%,
in good times and in bad?

19      Weathering the Storm
Newfoundland and Labrador Federation of Labour

Challenges worth Discussing:
The Challenge of Urbanization

How can the province keep housing affordable as people move from rural
Newfoundland and Labrador into the cities?

If financing is key component, are there alternative models of lending that can be
promoted? Given that almost 80% of the population in Newfoundland and
Labrador already own their homes, are there ways of pooling collateral, through
credit unions for example, to reduce the need for high risk, high cost financing for
the next generation of homebuyers who traditionally have lower savings?

The Challenges of Rural and Remote Life

The single biggest challenge in rural areas is how do we create employment and
save existing jobs. Good jobs sustain communities, and with rural industries
under siege, how do we ensure that Newfoundlanders and Labradorians living in
rural communities have access to good quality sustainable jobs?

How does the province ensure rural populations have access to the health care
they need? Can technology play a bigger role, through advances like tele-health?

How can access to education at the primary and secondary level be improved in
rural and remote communities? Is technology being harnessed to provide
optimal supports to young learners and their teachers?

How could the province deal with the need for early learning and care as well as
community supports in areas with an aging population?                    Are there
intergenerational solutions to be tapped into? Are the models for service
provision more cooperative or collective than client/service provider oriented?

20      Weathering the Storm
Newfoundland and Labrador Federation of Labour

The Challenge of Plenty

How does the province parlay its oil wealth into economic diversification
opportunities, to ensure the long-term stability of Newfoundland and Labrador?

Should the province be putting aside revenues in good times to build up an
endowment that ensures citizens won’t see reductions in services in bad times?
Or should it spend everything it collects now, investing in needed infrastructure
and expansion of services? Or both?

Is one of the province’s first priorities extending its infrastructure in a way that
keeps everyone connected and permits economic development outside major
urban hubs?      Is the quick expansion of broadband technology across
Newfoundland and Labrador a foundational piece of investment in this downturn?

i
  http://www.salon.com/news/feature/2009/04/03/stiglitz/index.html?source=newsletter
ii
    http://robertreich.blogspot.com/
iii
    http://www.imf.org/external/pubs/ft/survey/so/2009/new031909a.htm (March 19, 2009)
iv
    http://business.theglobeandmail.com/servlet/story/RTGAM.20090313.wsubprime14/BNStory/Business/home
v
    Paul Viera, “Canada’s economy shrank record 7.3% in Q1: BoC”, Financial Post, April 23, 2009. The 7.3% is an annualized figure,
translating to about 1.8% for the quarter.
vi
    From March 13 2009 report from TD Bank
http://www.td.com/economics/comment/dp031309.pdf but based on Statistics Canada numbers.
vii
     http://www.crea.ca/public/news_stats/pdfs/crea_forecast_feb09.pdf
viii
     http://www.upi.com/Top_News/2009/04/08/Alberta-facing-unprecedented-deficit/UPI-10871239194853/
ix
     Industry Canada. http://www.bankruptcycanada.com/bankstats1.htm

x
     http://www.statcan.gc.ca/daily-quotidien/071219/dq071219b-eng.htm

21              Weathering the Storm
You can also read