NextDecade Corporation

     January 2022

                         Accelerating the Path to a Net-Zero Future
←
→
Page content transcription
If your browser does not render page correctly, please read the page content below

NextDecade Corporation
January 2022
Accelerating the Path to a Net-Zero Future
Disclaimer and Forward-Looking Statements

This Presentation contains certain statements that are, or may be deemed to be, “forward-looking statements” within the meaning of Section 27A of the Securities Act of 1933,
as amended, and Section 21E of the Securities Exchange Act of 1934, as amended. All statements other than statements of historical fact contained in this presentation,
including statements regarding the future results of operations and financial position of NextDecade Corporation and its subsidiaries (collectively, the “Company”), its strategy
and plans, its expectations for future operations and transactions, environmental regulatory and legislative matters and future demand and supply affecting liquefied natural gas
                                                                                                                                                                                               NASDAQ: NEXT
(“LNG”) and general energy markets, are forward-looking statements. The words “anticipate,” “contemplate,” “estimate,” “expect,” “project,” “potential,” “plan,” “initial,” “intend,”
“believe,” “may,” “might,” “will,” “would,” “could,” “should,” “can have,” “likely,” “continue,” “design” and other words and terms of similar expressions, are intended to identify
forward-looking statements.
The Company has based these forward-looking statements largely on its current expectations and projections about future events and trends that it believes may affect its
financial condition, results of operations, strategy, short-term and long-term business operations, and objectives and financial needs. Although the Company believes that the
expectations reflected in its forward-looking statements are reasonable, actual results could differ from those expressed in its forward-looking statements. The Company’s future
financial position and results of operations as well as any forward-looking statements are subject to change and inherent risks and uncertainties. You should consider the
Company’s forward-looking statements in light of a number of factors that may cause actual results to vary from its forward-looking statements regarding general business
activities or its LNG and carbon capture and storage (“CCS”) business lines including, but not limited to: progress and timing in the development of and final investment
decision (“FID”) in the construction and operation of a LNG terminal at the Port of Brownsville in southern Texas (the “Terminal”); the successful completion of the Terminal by
third-party contractors and a pipeline to supply gas to the Terminal being developed by a third-party (the “Pipeline”); the Company’s ability to develop its CCS business line
through deployment and operation of CCS processes that capture and store carbon dioxide (“CO2”) emissions at third-party facilities and at the Terminal (the “CCS project”); the
accuracy of estimated costs for the Terminal, the CCS project, and implementation of the CCS processes at third-party facilities; operational characteristics of the Terminal, the
CCS project, and the CCS processes, when completed or implemented, including amounts of liquefaction capacities or amount of CO2 captured and stored; the development
risks, operational hazards, and regulatory approvals applicable to the Company’s LNG and CCS development, construction, and operations activities; the global demand for and
price of LNG; the availability of LNG vessels worldwide; changes in legislation and regulations relating to the LNG and CCS industries, including environmental laws and
regulations that impose significant compliance costs and liabilities; scope of implementation of carbon pricing regimes aimed at reducing greenhouse gas emissions that
reasonably price emission costs; global development and maturation of emissions reduction credit/offset markets; adverse changes to existing and planned CCS tax incentive
regimes; global pandemics, including the 2019 novel coronavirus pandemic, and their impact on the Company’s business and operating results, including any disruptions in the
Company’s operations or development activities and the health and safety of the Company’s employees, and on the Company’s customers, the global economy, the demand for
LNG, and number and scale of implemented CCS projects; risks related to doing business in and having counterparties in foreign countries; technological innovation which may
lessen the Company’s anticipated competitive advantages; the Company’s ability to secure additional corporate and/or project debt and equity financing in the future at levels
required to execute its business plans; the Company’s ability to maintain the listing of its securities on a securities exchange or quotation medium; changes adversely affecting
the business in which the Company is engaged; management of growth; general economic conditions; the Company’s ability to generate cash; compliance with environmental
laws and regulations; and the result of future financing efforts and applications for customary tax incentives. We may not be able to complete the anticipated transactions
described in this presentation. FID is subject to the completion of financing and commercial arrangements that may not be completed within the time frame expected or at all.
Additional factors that you should consider are set forth in detail in the “Risk Factors” section of the Company's most recent Annual Report on Form 10-K as well as other filings
the Company has made and will make with the Securities and Exchange Commission which, after their filing, can be found on the Company’s website, www.next-decade.com.
Financial forecasts, estimates, or other forward-looking financial information included in this presentation is meant for illustrative purposes only and does not purport to show
estimates of actual future financial performance over any particular period. The information on such slides assumes the completion of certain commercial, financing, and other
transactions. Such transactions may not be completed on the terms we assume or at all. Actual commodity prices and the terms of commercial and financing arrangements may
                                                                                                                                                                                            NextDecade Corporation
vary materially from those assumed for the purposes of the illustrative financial performance information.                                                                              1000 Louisiana Street, Suite 3900
Should one or more of the foregoing risks or uncertainties materialize in a way that negatively impacts the Company, or should its underlying assumptions prove incorrect, its             Houston, Texas 77002 USA
actual results may vary materially from those anticipated in its forward-looking statements and, its business, financial condition and results of operations could be materially and
adversely affected. You should not rely upon forward-looking statements as predictions of future events. In addition, neither the Company nor any other person assumes
responsibility for the accuracy and completeness of any of these forward-looking statements. The Company cautions readers that the information contained in this presentation
is only current as of the date of this presentation and, therefore, except as required by applicable law, the Company does not undertake any obligation to publicly correct or
update any forward-looking statement.
                                                                                                                                                                                                                            1
NextDecade is a Differentiated De-Carbonization Investment Opportunity
End to End Carbon Solutions and World's Greenest LNG

                                                                                                          Rio Grande LNG
       Provides end-to-end carbon capture and storage solutions                         A 27 million metric tonne LNG export project in Brownsville, Texas

   NEXT Carbon Solutions is working with third-party customers around the               The Rio Grande LNG project is expected to offer the most competitively
world to deploy carbon capture and storage to reduce CO2 emissions at their           priced, greenest LNG available in the global market. Rio Grande LNG will be
       industrial facilities. We believe NEXT Carbon Solutions will make               the largest privately funded infrastructure project in the State of Texas and
transformative, impactful, and measurable contributions toward achieving the             NextDecade is proud to be in the Rio Grande Valley for the long term.
                         world’s goal for a net-zero future.

                         Net-Zero Future                                                        The Greenest LNG in the World
   At NextDecade, we believe that reducing CO2 emissions from industrial               By combining emissions reduction associated with our carbon capture and
facilities around the world is critical to realizing the Paris Agreement’s goal of   storage project, certified responsibly sourced gas, and our pledge to use net-
limiting global warming compared to pre-industrial levels. We believe carbon           zero electricity, we expect Rio Grande LNG to produce the lowest lifecycle
   capture and storage must be deployed extensively to achieve this goal.                greenhouse gas LNG and to be the greenest LNG project in the world.

                                                                                                                                                                       3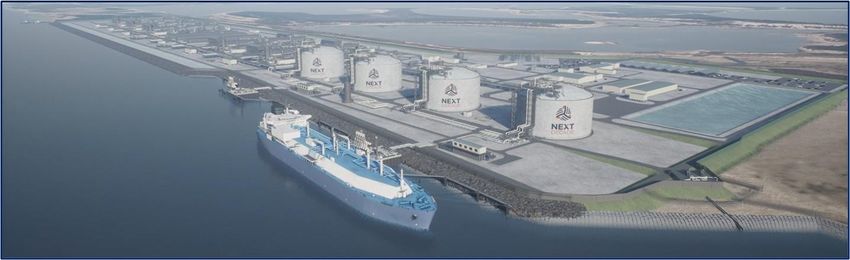
Our Vision, Mission, Values, and ESG Commitment

Vision                                                     Mission

Providing the world access to                             Delivering sustainable energy
cleaner energy                                            solutions by decarbonizing
                                                          natural gas and accelerating
                                                          the path to a net-zero future

Values                                                     ESG

   Safety         Integrity                               Conducting business in a
                                                          manner that is environmentally,
  Respect         Honesty
                                                          socially, operationally, and
Transparency      Diversity                               ethically responsible

                                                                                            4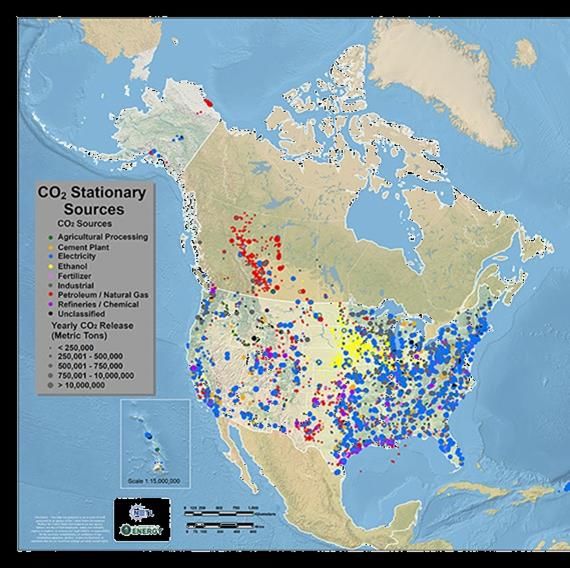
NEXT Carbon Solutions Strategy

• Provide end-to-end solutions for reducing CO2 at industrial facilities
• Utilize our engineering and project management expertise to lower the capital and operating costs of carbon
 capture and storage at industrial facilities
• Partner with industrial facilities to invest in the deployment of carbon capture and storage at the source
• Increase the value of the industrial facilities by integrating the carbon capture and storage project into the
 industrial facilities’ operations
• Share in the value created via commercial agreements and by investment

     Lower Global CO2 Emissions                       Reduce Cost of Utilizing CCS                           Accelerate Path to Net-
                                                                                                                  Zero Future
  We are committed to lowering global CO2       Our proprietary processes enable cost-effective     Implementation of CCS is a critical component of
 emissions and creating sustainable solutions   deployment of CCS in industrial facilities around    achieving global climate goals and accelerating
    utilizing carbon capture and storage                          the world                                   the path to a net-zero future

                                                                                                                                                       5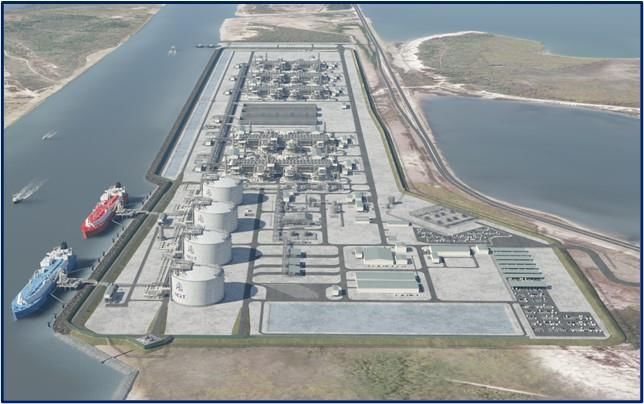
Portfolio Approach Expected to Generate Superior Returns

    Commercial Structures                                                                 Portfolio of Projects
                                                                          Blend of cash flow streams, risk and reward profiles, and

1
             PARTNERSHIP
                                                                            contract terms expected to generate superior returns

             • NCS and source facility partner in CCS investment
             • NCS builds and operates CCS assets for agreed term
             • Partners share risks and rewards derived from CCS assets                              Partnership
             • 45Qs and Carbon Credits controlled by NCS for term

2
        OWNED

        • NCS builds and operates CCS assets
        • NCS owns CCS assets and associated risks and rewards
        • 45Qs and Carbon Credits accrue to NCS for term
                                                                                                                            Fee for
                                                                                    Owned
                                                                                                                            Service

3
     FEE FOR SERVICE

     • NCS builds and operates CCS assets for agreed term
     • Fixed fee over agreed term provides total return to NCS
     • Source facility owns CCS assets and associated risks and rewards                           Revenue Sources
     • 45Qs and Carbon Credits accrue to source facility
                                                                             Government         Portfolio of    Source Facility’s
                                                                              Incentives        High-Quality        Market          Fixed Fees
                                                                           (45Q tax credits)   Carbon Credits   Competitiveness

                                                                                                                                                 6
Large Addressable Global Carbon Capture Market Opportunity

                               Third-parties agree deploying CCS is key to achieving global de-carbonization
                                                                                                  • Global Carbon Capture and Storage (CCS) Institute
                                                                                                    -   “… estimate that over 2,000 CCS facilities will be needed by 2040 to
                 50 Billion MT/Annum of Global GHG Emissions1                                           achieve capture levels required… capturing and permanently storing a
                                                            2.6 Billion MT                              total of 5.6 gigatons of CO2 per annum in 2050.”
                                                                                                  • The Intergovernmental Panel on Climate Change
                                                                             9.2 Billion MT         -   “Limiting temperature rise… may require geologic sequestration at a
                                                                                                        scale of 350 billion metric tons to one trillion metric tons of CO2
                                                                                                        cumulatively by 2050.”
                                                                                                  • Net Zero America Project
                                                                                 1.6 Billion MT
                                                                                                    -   “The scale of geologic sequestration (in the U.S.) is 1,000 facilities
                                                                                                        capturing and sequestering 1 to 1.7 billion tons of CO2 per year…”
                                                                                                  • IChemE (The Institution of Chemical Engineers)
           36.6 Billion MT
                                                                                                    -   “Carbon capture and storage is… an essential technology for achieving
                                                                                                        the Paris Agreement global warming target of less than 1.5 - 2 degrees
                                                                                                        in the most cost-effective ways and will bring value to decarbonising
            Industry          Agriculture, Forestry & Land Use                Waste      Energy         not only the power sector but also industrial processes and the heating
                                                                                                        sector, where there are few other feasible options.”
                                                                                                  • Wood Mackenzie
                                                                                                    -   “Carbon trading allows those who can reduce emissions faster or more
                                                                                                        cheaply to sell excess reductions to those who need them, at a price
                                                                                                        decided by the law of supply and demand… We estimate a globalised
                                                                                                        emissions trading market could be worth as much as $22 trillion by
                                                                                                        2050.”
1   International Energy Agency – amounts in metric tonnes (MT)                                                                                                                   7
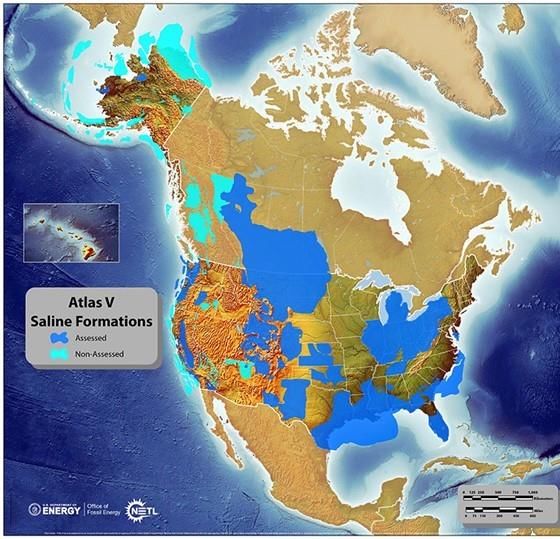
Enormous Potential for U.S. CO2 Sources and Permanent Storage

                    DOE has documented 6,358 stationary CO2                       DOE’s current documented range of CO2
                    sources with total annual emissions of                        saline storage resource is between 2,379
                    approximately 3,071 million MT                                billion to 21,633 billion MT

  DOE estimates that U.S. saline storage resources, alone, could accommodate a minimum
                              of 800 years of U.S. CO2 emissions
Source: National Energy Technology Laboratory – U.S. Department of Energy (DOE)
                                                                                                                             8
Potential U.S. Carbon Capture and Storage Partners

Carbon capture provides significant opportunity for low-cost service provider with commercial acumen

                                                                                    Number of U.S. Facilities Reporting > 1 million tonnes of CO2 Emissions per Year
                                                                        1,000
                                     Millions of Metric Tonnes of CO2                   434
                                                                                     Facilities
                                                                         750
                                            Emissions per Year

                                                                         500

                                                                                                     57
                                                                         250                      Facilities      50
                                                                                                                               36
                                                                                                               Facilities                    8
                                                                                                                            Facilities                   15
                                                                                                                                         Facilities                    5
                                                                                                                                                      Facilities
                                                                                                                                                                   Facilities
                                                                           0
                                                                                0        1
                                                                                     Gas-Fired       2
                                                                                                  Refining     Steel3 and      4
                                                                                                                            PetChem         5
                                                                                                                                           LNG          6
                                                                                                                                                      Ammonia         7
                                                                                                                                                                   Ethanol
                                                                                      Power                      Other
                                                                                    Generation                 Industrial

 • The following statistics relate to the population of U.S facilities emitting over 1 million tonnes of CO2
   emissions per year. These emitters represent NCS’ primary target partners for reducing CO2 emissions.
      - A total of approximately 1.3 billion metric tonnes of CO2 emissions per year
      - Over 600 individual facilities emit more than 1 million tonnes of CO2 per year                                                                                   Circle size denotes number of U.S, Facilities
                                                                                                                                                                         with > than 1 million tonnes of CO2
                                                                                                                                                                         emissions per year

 Source: US Environmental Protection Agency’s Greenhouse Gas Reporting Program                                                                                                                                           9
NCS Differentiated by Proprietary Designs
NCS’ Proprietary Processes Simple Post-Combustion Capture (PCC) and
Storage Process
• Increase efficiency and lower cost of
PCC and storage
• Use proven technology and equipment
to capture CO2 emissions at scale
• Reduce energy requirements
• Limit need for externally sourced
water
• Have a reduced land footprint
Multiple U.S. Patents Issued and Pending
Expect to capture 95% of CO2 emissions generated from an industrial facility’s processes
10Estimated Water and Land Use by CO2 Capture Solutions
2 million tonnes of CO2/annum Annual Water Land
Proprietary CCS
Processes Near Zero 10 Acres or Less
200˚F - 600˚F flue gas:
Traditional CCS 20 - 50 acres1
~ 0.6 - 1.8 billion gallons/yr1
Direct Air Capture and Storage ~ 2.1 billion gallons/yr2 200 - 800 acres3
Reforestation ~ 1.7 trillion gallons/yr4 ~ 230,000 acres4
NCS can reduce CO2 emissions without jeopardizing scarce water and land resources
1Based on internal computations by NextDecade – exact amounts depend on the facility type and flue gas temperature | 2 Science Direct - “The Water Footprint of Carbon Capture and Storage Technologies” | 3 World Resource Institute | 4 Water consumption computed based
on 10 gallons of water per week for every 1 inch of tree caliper (trunk diameter), mature trees having trunk diameters of 35 inches each, 48 pounds of CO2 absorbed annually by each tree, and 400 mature trees per acre 11NCS has Already Advanced Carbon Capture Designs Across Many Industries
During 2021, NCS worked with owners of multiple source facilities to develop extensive CCS
application knowledge across multiple industries through pre-FEED1 analyses
# Pre-FEED
# Pre-FEED+
Ethanol /
Power Generation Petrochemical Steel Refining Ammonia LNG
Agriculture
Complete2
3 1 1 1 1 1
In Progress3
4 1
Engaged4
5 1 1
These source facilities comprise high-quality opportunities for NCS FEEDs/FIDs in 2022
1 Pre–FEED
(preliminary front-end engineering and design) assesses source facility data to determine feasibility of deploying CCS in technical and economic terms. Pre-FEED (equivalent to FEL-2 (Front End Loading Stage 2)) work product is a detailed report specific to CCS
deployment at a source facility. | 2 Complete means the Pre-FEED work is finished and a report has been published | 3 In Progress means the Pre-FEED work has commenced | 4 Engaged refers to projects where NCS continues to assess the scope with source facilities.
12Rio Grande LNG Export Project
Marine
Location Capacity Storage RGLNG CCS Technology EPC Pipeline
Facilities
27 million Proven LSTK EPC Contract Superior
984-acre site metric tonnes Deepwater port Carbon Capture technology pipeline
leased from the per annum 4 x 180,000m3 access and Storage* reliability
Port of (mtpa) full containment Supporting Rio Bravo &
Brownsville, LNG tanks marine >90% CO2 Valley Crossing
Texas Fully permitted infrastructure reduction
for 5 Trains
* Limited amendment filed at FERC in November 2021 for CCS Project at RGLNG. FERC approval of CCS Project at RGLNG expected in 2022 13RGLNG Commercial Offerings Meet the Needs of LNG Buyers
Sustainable Gas Carbon Multiple Alternative
Contract Tenors Shipping
Supply Mitigation Gas Indexes Indexes
Responsibly Verified GHG HH Brent 10 – 20 Years Full Destination
Sourced Gas Footprint Agua Dulce Flexibility
Carbon Credits JKM No Revenue
from CCS Project Sharing
TTF
Rio Grande LNG offers the greenest LNG on the water, priced off a variety of LNG pricing indexes, and flexible
contract tenors, to meet the needs of LNG buyers
14Rio Grande LNG Carbon Capture and Storage Project
Rio Grande LNG (27 mtpa) CO2 Emissions Reduction2
• Targeting carbon-neutrality at Rio Grande LNG
• Expected to capture and store more than five (5) 6 Trains 5 Trains 5 Trains
million metric tonnes of CO2 per year
~ 21%
• Greater than 90% reduction in CO2 emissions from
initial FERC filing
• Expected cost to be $74 per metric tonne (MT) > 90%
including financing costs ($57/MT before financing)
of CO2 captured1
• Limited amendment filed at FERC in November 2021;
FERC approval expected in 2022
Original Design CCS with
FERC Filing Optimization Proprietary
(May 2016) (July 2020) Processes
(Current State)
1Includes capex, opex, financing, and CO2 transportation and storage cost, subject to final design and approval. | 2 The original FERC filing for Rio Grande LNG (May 2016) was for a 6-train project capable of producing 27 mtpa of LNG for export. In July 2020, NextDecade
announced a series of optimizations that will result in an LNG project capable of producing 27 mtpa with five LNG trains. Emissions profiles are presented on the basis of a 5-train project and are presented for comparison with the originally filed 6-train project. Subject to
applicable federal and state regulations. 15With CCS, RGLNG is Expected to Produce the World’s Greenest LNG
Independent measurement and certification
of gas supply chain emissions
• Project Canary is focused on Net-Zero Power
delivering independent, trusted,
continuous emissions monitoring
data and related technologies to
assess environmental performance
across the energy value chain
Gathering,
• NextDecade and Project Canary Responsibly Rio Bravo Rio Grande
Processing,
Sourced Gas Pipeline LNG Terminal
are developing a framework, the Transportation
first in the global LNG industry, for
independent certification of the
GHG intensity of the associated gas Rio Grande LNG is expected to produce the
supply chain and LNG sold from greenest LNG in the world by combining:
Rio Grande LNG
• Emissions reduction associated with our
CCS project
• Responsibly sourced gas
• Our pledge to use net-zero electricity
16Sources of Revenue for the World’s Greenest LNG Facility
27 mtpa of LNG at 5 Train capacity • LNG sales
- Portfolio of SPAs
- Independent measurement and certification of GHG intensity of
LNG Sales gas supply chain
• Carbon Credits
- Each carbon credit:
▪ Represents one tradeable tonne of CO2 from emissions
reduction from an independently verified project
▪ Can be bought by any person, company, or government that
wants to offset the emissions they are generating
U.S.
Carbon - Available for sale to:
Gov’t
Credits ▪ Rio Grande LNG’s customers
Incentives
▪ Global Carbon Credit markets
• U.S. Government incentives
- $50/MT1 of CO2 captured and permanently stored
- U.S. Tax Code Section 45Q provides a tax credit for CO2 captured
and permanently stored
Greater than 5 million tonnes of CO2 captured
and stored annually at full 5 Train capacity - Credits awarded to taxpayer that owns the capture equipment
1 An increase to $85/MT is currently being discussed in Congress 17Rio Grande LNG Milestones
• All major approvals in hand including the LNG
Permits terminal design, and the ability to mobilize to site
and perform full site preparation and test pilings Competitively Priced, Greenest LNG1
• Lump sum, turnkey contract with Bechtel
EPC • Expected to be one of the lowest cost U.S. Gulf
Coast greenfield LNG projects built
• Shell SPA: 2 mtpa, 20-year FOB contract
SPAs • SPA negotiations advancing with multiple
counterparties in Europe and Asia
• To commence upon execution of additional
Financing
SPAs
De-Risked and Shovel Ready
• Expected in second half of 2022 on a minimum
FID
of two trains (11 mtpa)
1 Limited amendment filed at FERC in November 2021 for CCS Project at RGLNG. FERC approval of CCS Project at RGLNG expected in 2022 18Industry Leading Executives and an Experienced Multi-Disciplinary Team
Mr. Matt Schatzman Mr. Ivan Van Der Walt Mr. Brent Wahl Ms. Vera De Brito de Gyarfas
Chairman and Chief Operating Officer Chief Financial Officer Mr. James MacTaggart
General Counsel and
Chief Executive Officer Chief Marketing Officer
Corporate Secretary
Mr. Patrick Hughes Mr. Mike Mott Mr. Ariel Handler Ms. Raquel Couri Mr. Kevin Beasley
Senior Vice President, Senior Vice President, Senior Vice President, Senior Vice President, Senior Vice President
Carbon Solutions Strategy and Finance Human Resources and Gas Supply and Commercial
Business Development Administration Operations
Please refer to www.next-decade.com/about-us/senior-leadership/ for full biographies of these Executives
19De-Carbonization Focus Positively Differentiates NextDecade
Rio Grande LNG
Promoting Full End-to-End CCS Solutions Competitively Priced, Greenest LNG
• Providing flexible commercial structures • Bechtel EPC, mature project design and proven equipment
• Focusing on partnering with the largest CO2 emitters • Flexible pricing and tenor offerings
• Generating the highest-quality carbon credits • Deploying carbon capture and storage
• Proprietary processes increase efficiency and lower the cost • Independent measurement and certification of gas supply
of CCS chain emissions
• Expecting capture rates of up to 95% of CO2 emissions • Only fully permitted LNG facility in South Texas
• Currently working with multiple facility owners to advance • Location advantage relative to Louisiana area LNG projects
carbon capture designs across many industries • Expected lowest cost U.S. Gulf Coast LNG project
• Identified high-quality opportunities for FEEDs/FIDs in 2022 • Expecting to FID in the second half of 2022
Industry leading Executives Supported by an Experienced Multi-Disciplinary Team
20Estimated Distributions to NEXT
Estimated Annual Distributions to NEXT
NextDecade Consolidated Distributions to NEXT ($ billions)1 $ 1.5 - $ 1.7
Rio Grande LNG Trains 1 – 5 with Carbon Capture and Storage ($ billions)2,3 $ 1.1 - $ 1.3
NEXT Carbon Solutions: First 10 Projects ($ billions) 4 $ 0.4
Estimated RGLNG liquefaction fee ($/MMBtu) $ 2.50
Estimated revenue from deploying CCS ($/MT) $ 100
Estimated CO2 captured per annum from first 10 projects (million metric tonnes) 15
1 Distributions to NEXT are the sum of Rio Grande LNG and NEXT Carbon Solutions potential distributions. | 2 Estimated annual distributions to NEXT from 20-year offtake agreement LNG sales at full commercial operations for each train for the first 10 years. Calculated as cash
flow from operations minus project financing costs. Assumes all project capital from third parties with range of estimated distributions to NEXT based on financing assumptions. Assumes 5.4 mtpa production for each train at Rio Grande LNG. | 3 Estimated distributions to NEXT
from captured CO2 at the Rio Grande LNG facility at full commercial operations. Calculated as cash flow from operations minus financing costs. Assumes revenue derived from monetization of 45Q tax incentives and Carbon Credits sales. Assumes all project capital from third
parties. | 4 Expected distributions to NEXT from NEXT Carbon Solutions at full commercial operations. Calculated as cash flow from operations minus financing costs. Figures do not include any contribution from the RGLNG CCS project as this contribution is included in the
RGLNG estimated distributions amount. Assumes revenue derived from the sum of 45Q tax incentives and Carbon Credits sales from deploying CCS at the first 10 projects which are expected to capture a total of approximately 15 million metric tonnes of CO2 per year.
Assumes all project capital from third parties. The calculation assumes estimated EPC costs for CCS as of January 1, 2022. The first 10 projects are expected to reach FID over the next 24 – 36 months. The timeline from FEED to FID to permitting, construction, and
commissioning, and to first CO2 capture approximates 40 months. First 10 projects represent less than 2% of the potential U.S. projects emitting >1 million metric tonnes of CO2 per year.
The estimated values set forth herein assume that the Company will achieve its financial projections in all material respects. Such financial projections reflect the Company’s best currently available estimates and reflect its good faith judgments. Events and conditions
subsequent to this date as well as other factors could have a substantial effect upon the estimated values. The Company gives no assurance that the estimated values will prove to be correct and does not undertake any duty to update them. Please refer to the slide titled
“Disclaimer and Forward-Looking Statements.”
21NextDecade has Raised More than $350 Million To-Date
October 2019 October 2019 March 20214 July 20215
$15 million $50 million $34.5 million $5.0 million
Energy & Power
Transition Partners
Private Private Private Private
Placement Placement Placement Placement
Common Equity Common Equity Preferred Equity Preferred Equity
3Q 2018 and
October 2014 June 20151 February 20172 July 2017
2Q 20193
$5 million $85 million $25 million $38 million $100 million
Harmony
Merger
Corp.
Private Private Private Private
Placement Placement Placement Reverse Merger Placement
Common Equity Common Equity Common Equity Preferred Equity
1In October 2018, Halcyon Capital Management was renamed Bardin Hill Investment Partners | 2 Funds committed in multiple tranches, with final closing in August 2017 | 3 Details available in Form 8-K filings on August 7, August 24, and September 25, 2018, and in Form 8-K filing on May 20,
2019; BlackRock investment made by funds managed by BlackRock; HGC NEXT INV LLC is a wholly owned subsidiary of Hanwha General Chemical USA Corp. | 4 Details available in Form 8-K filings on March 18 and March 29, 2021. | 5 Details available in Form 8-K filing on August 2, 2021. The
private placement was with TEP Next Decade, LLC, an affiliate of Energy & Power Transition Partners, LLC (EPTP) 22NextDecade is a clean energy company
accelerating the path to a net-zero future
www.next-decade.com
23You can also read