Nightless City: Impacts of Policymakers' Questions on Overtime Work of Government Officials
←
→
Page content transcription
If your browser does not render page correctly, please read the page content below
WINPEC Working Paper Series No.E2125
                                                 March 2022

Nightless City: Impacts of Policymakers’
         Questions on Overtime
     Work of Government Officials

   Natsuki Arai and Masashige Hamano and

 Munechika Katayama and Yuki Murakami and

              Katsunori Yamada

      Waseda INstitute of Political EConomy
              Waseda University
                 Tokyo, Japan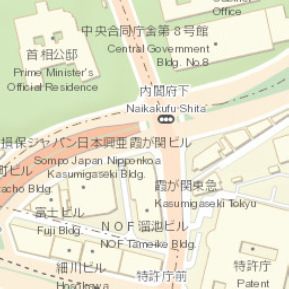
Nightless City: Impacts of Policymakers’ Questions on Overtime
                                 Work of Government Officials∗
             Natsuki Arai                        Masashige Hamano                    Munechika Katayama
     National Chengchi University                  Waseda University                     Waseda University
           narai@nccu.edu.tw                 masashige.hamano@waseda.jp                mkatayama@waseda.jp

                                Yuki Murakami                         Katsunori Yamada
                               Waseda University                        Kindai University
                        cherryblossom@akane.waseda.jp                 kyamada@kindai.ac.jp

                                                 March 22, 2022

                                                      Abstract

          We quantify the impact of questions submitted by policymakers on the overtime work of Japanese
      government officials. We use mobile phone location data to measure the nighttime population in the
      government-office district at hourly frequency. Our measure is much less vulnerable to measurement
      errors than reported overtime working hours. Exploiting the institutional constraints, we estimate re-
      sponses of the nighttime population to an exogenous increase in the number of questions submitted by
      using the method of local projection. We find that, on average, overtime work significantly increases and
      persists by midnight one week after the submission of the question. Based on our results, government
      officials, who are male in their 20s and female in their 40s, are the most heavily affected by the question.
      Furthermore, the effect on overtime work is estimated to be more pronounced when everything is paper-
      based, suggesting that improved efficiency using information technology can mitigate overtime work.

      JEL Classification: C22, H11
      Keywords: mobility data; overtime work; local projection; government officials

  ∗ We are grateful for comments and suggestions from Haruko Noguchi, Mototsugu Shintani, Katsuya Takii, and Kozo Ueda.

We would also like to thank seminar participants at Waseda University and Kansai Macroeconomics Workshop. This project
was in part supported by the Center for Positive/Empirical Analysis of Political Economy at Waseda University and JSPS
Grants-in-Aid for Scientific Research (21H04397).

                                                           1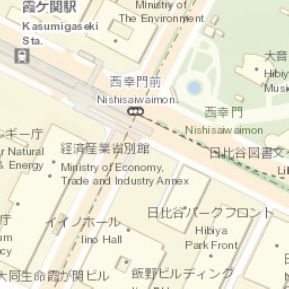
1      Introduction
Japanese government officials are notorious for their long working hours. This is especially the case for
the officials working at the central administrations in Tokyo, engaging in the planning and coordination of
policy. As reported in Kobara (2021), long working hours make the positions at the central administration
less attractive, leading to fewer job candidates and more turnovers of young government officials. Since such
brain drain will undermine the quality and efficiency of the policy proposed by the central administration,
numerous proposals for reforms have been proposed.1 However, these proposals have not been persuasive
to change the corporate culture in the central administration yet, perhaps due to the lack of quantitative
evidence.
     Obtaining quantitative evidence on the government officials’ overtime work in Japan is inherently difficult
for two reasons. First, government officials’ task in Japan is complex, ranging from doing research for a policy
proposal to coordinating it with policymakers. Therefore, it is difficult for us to know which task causes
them to work overtime. Second, the reported overtime working hours are significantly underreported due to
the limit in the annual budget and do not reflect the actual working hours.2 This may be because the Labor
Standard Acts and other related laws are not applicable to the government officials in Japan, which makes
the monitoring of working hours and conditions difficult.
     To overcome these obstacles, this paper focuses on a specific task, responding to a memorandum on ques-
tions (MOQ, hereafter), and quantifies its impact on the overtime work of government officials.3 MOQs are
written questions submitted by the policymakers at the national Diet to the Cabinet and have several unique
features, which we exploit for identification. The law requires the Cabinet to respond to the MOQ within
a week, which will impose a significant burden on the government officials. In addition, the policymakers
can submit MOQ any time regarding any subject during the sessions of the Diet, which makes it difficult to
anticipate MOQs in advance.
     To quantify the impact of the MOQ on overtime work, we measure the hourly population in Kasumigaseki,
a district in Tokyo where nearly all central administrations are located, using the location data of mobile
phones. There are several advantages to using this location data. First, the location data reflect the physical
presence of the government officials, which provides us with a reliable measure of the actual overtime working
hours. Second, we can measure the hourly changes of the population in the area since the data collect hourly
location for 24 hours. Last, the obtained population data are associated with individual characteristics, such
as gender and age groups. Therefore, we can measure the mobility of Japanese government officials fairly
accurately.
     The estimation is based on the method of local projection proposed by Jordá (2005).4 The key identifi-
cation assumption is that MOQs can be regarded as an exogenous shock to the work of government officials
since the policymakers have discretion over the timing and contents of the questions. We also assume that
no other systematic shock occurs when the MOQ is submitted to the Cabinet, which enables us to identify
its impact using the high-frequency data. Exploiting the statutory deadline of the MOQ, we focus on the
hourly changes of the population at Kasumigaseki within one week.
     We find that, on average, an increase in the number of MOQs significantly increases the overtime work
    1 Forexample, see Ministry of Finance (2010) and Ministry of Health, Labor, and Welfare (2019).
    2 Accordingto National Personnel Authority, the average reported overtime working hours in the central administration was
29 hours per month in 2019. However, for example, Kyodo (2021) reported that the actual average overtime working hours at
the COVID-19 task force was 124 hours per month in 2021.
   3 MOQs are sometimes referred to as written questions.
   4 For more recent discussion, see Olea, Luis, and Plagborg-Møller (2021) and Plagborg-Møller and Wolf (2021).

                                                             2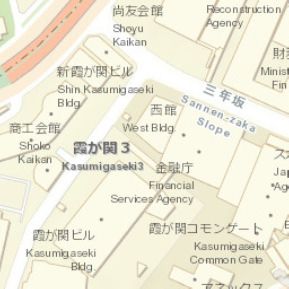
of government officials one week after the submission of MOQs. The estimated results suggest that the
MOQs persistently increase the nighttime population in Kasumigaseki on average until 23:00. The results
also suggest that the effects of MOQs are heterogeneous across different demographic groups. The estimated
gender-age-specific responses suggest that male government officials in their 20s and female government
officials in their 40s are heavily affected by the MOQ shock. In addition, MOQ is estimated to have a
quantitatively more pronounced effect before 2019, which coincides with the digitization of the submission
of MOQs. This result may suggest improved efficiency with digitization.
     This paper makes several contributions to the literature. First, this paper is one of the first attempts to
quantify the impact of the MOQ on overtime work. Although there are some discussions about the MOQ on
press media, there are few academic studies that analyzed the MOQ.5 Second, this paper contributes to the
expanding literature using location data for economic analysis. A large body of literature has focused on the
impact of human mobility on the spread of the COVID-19, analyzing the effects of public health measures,
such as social distancing policy and lockdowns, and its relationship with risk perceptions and political
attitude.6 Recently, more papers have expanded the usage of mobile location data to tackle economic
questions, and this paper is one of them.7 Third, this paper quantifies the cost of transparency in terms of
overtime work of government officials. Although the MOQ plays an important role in increasing transparency
of the Japanese government, which ensures fair democracy, it incurs significant costs of overtime work. As
Pencavel (2015) and Sato, Kuroda, and Owan (2020) suggest, longer working hours reduce labor productivity
and are associated with a higher probability of errors and deterioration of workers’ mental and physical health.
Some policymakers, especially from the minority parties, deliberately submit a long list of MOQs to exhaust
Japanese government officials. However, given the significant cost of MOQs, policymakers should refrain
from such abusive usage of MOQs.
     The rest of the paper is organized as follows. Section 2 explains institutional background relevant to
our study. Section 3 details our dataset. Section 4 explains our empirical model and Section 5 presents the
results. Finally, Section 6 concludes.

2       Institutional Background
This section provides some institutional background about the MOQ system in the Japanese Diet relevant
for our study.

2.1         Spirit of MOQ
Every Diet member has a right to ask questions to the Cabinet, and there are two forms of them. One is to
ask oral questions over the course of live discussions at the Diet, which are the type of questions that attract
media attention for their visual appearances.8 The other form of questions is through submitting written
    5 The   only exception is Tanaka (2008), which illustrates the detailed procedures of the MOQ and its policy implications.
    6 See  Alexander and Karger (2021), Barrios and Hochberg (2020), Chen and Pope (2020), Couture, Dingel, Green, Handbury,
and Williams (2021), for the analysis in the US, Mizuno, Ohnishi, and Watanabe (2021) and Watanabe and Yabu (2021a,b)
for the analysis in Japan, and Fang, Wang, and Yang (2020) for the analysis in China.
    7 For example, Athey, Ferguson, Gentzkow, and Schmidt (2020) construct a measure of segregation using the Global Posi-

tioning System (GPS) signals, which captures individuals’ exposures to different groups of people. Miyauchi, Nakajima, and
Redding (2021) measure the trips for commuting and consumption using the location data to show that the access to con-
sumption significantly affects the variation in residents and land prices. Matsumura, Oh, Sugo, and Takahashi (2021) use GPS
mobility data to measure economic activity in real-time, which significantly outperforms the prediction based on conventional
datasets.
    8 It is said that from government officials’ viewpoint preparation for this type of question is much demanding and its schedule

is quite tight. This is one of the main reasons for causing excessive overtime work for Japanese government officials. It would

                                                                3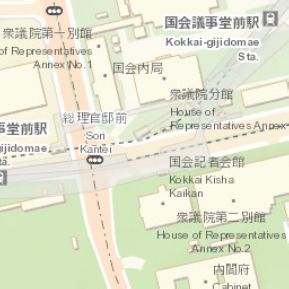
Sun.           Mon.           Tue.             Wed.          Thu.            Fri.           Sat.

      Week 1                         MOQs submitted by Wed.
                Transfer to
               the Cabinet      Receiving                    On the agenda                   Cabinet
      Week 2                     MOQs
                    1-week                                        by Noon                    meeting
               requirement
      Week 3                    Deadline

                                           (a) MOQs Submitted by Wednesday

                    Sun.           Mon.           Tue.             Wed.          Thu.            Fri.           Sat.
                                                                                 MOQs submitted
      Week 1                                Transfer to the Cabinet
                                                                                 on Thu. and Fri.
                                                              Receiving                    On the agenda
      Week 2                                                   MOQs                          by Noon

                                               Cabinet
      Week 3                                                   Deadline        1-week requirement
                                               meeting
                                     (b) MOQs Submitted on Thursday and Friday

                           Figure 1: Timeline from Submission of the MOQ to Response

documents (the MOQ) during the period of the Diet being open. This is our focus.
    The system of the MOQ is important to ensure fair democracy in the spirit of the establishment. It is so
because the MOQ provides all the Diet members with equal opportunities to inquire about the Cabinet’s view
on political issues and address important ongoing issues in the society. Unlike the system of oral questions,
where time allocation depends on the share of legislative seats, the Diet members are allowed to submit as
many MOQs as they want. Because of this flexibility, the Diet members from opposing political parties take
advantage of this system. Despite its noble purpose to preserve minority opinions, the MOQ system can be
abused by the members of opposition parties.
   It is government officials that prepare replies to the MOQ on behalf of the Cabinet. As we will see in the
next subsection, the time constraint for responding to the MOQ is tight, leading to overtime work.

2.2     Timeline of MOQ
This subsection explains how the submitted MOQs are handled, which are relevant to determining the
deadline, and a potential sense of urgency for government officials. There have been a couple of changes in
the procedures. We will explain the present timeline.
    Figure 1 illustrates the overall timeline of processing the MOQ. A Diet member submits MOQ to the
House. The MOQ can be submitted on any business day, not like the case of oral questions where the time
schedule is predetermined. This feature of MOQ submission is important for our identification strategy,
and we will check the exgoneity of submission timing below. On the official note, the received MOQ are
transferred to the Cabinet next week (either on Monday or Wednesday on Week 2 depending on the day of
be interesting if we could get records for this type of question to quantify government officials’ exposure to oral questions.
However, as far as we are aware, such records are not publicly available.

                                                              4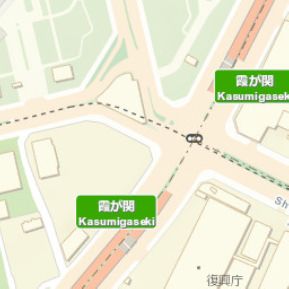
300

            250

            200

            150

            100

             50

              0
                     Sun          Mon          Tue          Wed           Thu          Fri          Sat

                                Figure 2: Daily Patterns of the MOQ Submission

Note: Vertical axis are the number of the MOQ submitted on each day of the week in 2019 and 2020. During the weekends, no
questions are submitted.

the MOQ submission), and the Cabinet has to respond within one week since the official transfer (Monday
or Wednesday on Week 3).
   It is important to note that those questions submitted become available to the government officials
immediately before the official transfer to the Cabinet, which takes place in Week 2. Upon submission of
the MOQ, it will be decided within one hour which Ministry will be responsible for the MOQ. This is when
the contents of the MOQ will become available to the government officials, and they initiate preparations
behind the scenes.
   When government officials prepare for replies, after going through internal review processes, their drafts
have to be approved at the Cabinet meetings. They take place on Tuesdays and Fridays during the period
of Diet (those on Week 2 and 3 in Figure 1). Since the agenda is determined two business days prior to the
Cabinet meetings (namely, on Wednesday or Friday), the government officials have to put their replies on the
agenda by noon on Wednesday or Friday. Responses to two batches of MOQs must be ready by the end of
Tuesday or Thursday on Week 2. All in all, after the submission of each MOQ, government officials roughly
have a week (including weekends) to prepare for the replies. Preparing for the response is an additional
labor service that comes on top of their regular tasks.
   Figure 2 shows the number of the MOQ submitted on each day of the week in 2019 and 2020. Probably
reflecting the timeline explained above, there is a certain specific pattern in the timing of submission during
the week: due to the deadlines, Wednesdays and Fridays attract greater numbers of the MOQ submitted.
This bunching pattern could potentially have impacts on overtime working hours for government officials.

2.3     Adoption of Information Technology
Prior to August 2019, the system of the MOQ had been completely paper-based. There were strict format
requirements for those public documents such as font size, the number of characters in a single column (it
is vertically written from top to bottom and from right to left in Japanese official documents), the number

                                                           5
of columns, margins, and so on. In order to meet these formatting requirements on a hardcopy, government
officials had to spend additional time preparing their replies. They also had to go through an internal review
process, where they prepared more than one hundred copies of documents in circulating their drafts.
Such an outdated practice finally came to an end on August 1, 2019. The House of Representatives
adopted the digitalized MOQ from the 199th extraordinary Diet. The House of Councillors also started
digitizing MOQ as of the 200th extraordinary Diet, which started on October 4, 2019.
2.4 Salience of MOQ for Government Officials
You may wonder if government officials could save time by spending less attention and effort in preparing
their replies. In this case, the MOQ would not cause serious overtime work to government officials. However,
if the submitter of the MOQ is not satisfied with the response, he or she can submit another MOQ on the
same topic up to three times.9 Hence, the best interests of government officials would be that they prepare
their best replies in their first try, and hence, could be a source of overtime work hours.
Finally, as we will argue later, the timing of MOQ submission is random and unpredictable. As they are
unexpected irregular works during the period of Diet, they could dampen motivations and productivity of
regular works by government officials.
3 Data
3.1 MOQ Data
We will focus on the MOQs submitted to the House of Representatives to avoid a potential measurement
error problem of our explanatory variable.10 Detailed information on MOQs is available through the website
of the House of Representatives, including the name of the submitter, date of submission, time of transfer
from the House to the Cabinet, date of response, together with open-ended contents of the questions and
the replies.
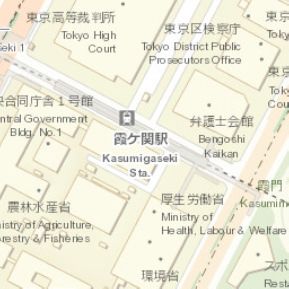
Figure 3 shows the daily number of the MOQs submitted in 2019 and 2020. The shaded areas in the
Figure correspond to the periods when the Diet is held. Policymakers can submit MOQs when the Diet is
held. As it can be seen in the Figure, there are relatively large spikes in the number of MOQs submitted at
the beginning of Diet periods. The spikes reflect accumulated questions during the non-Diet period being
submitted at once. We also see “last-minute” submissions of MOQs at the end of Diet periods: these
would stem from the fact that some voters regard the MOQ submission as an important contribution of
policymakers. To sum up, there are generally two spikes in the submission of the MOQ for each Diet period.
640
35
30
25
20
15
10
5
0
Jan 2019 Apr 2019 Jul 2019 Oct 2019 Jan 2020 Apr 2020 Jul 2020 Oct 2020 Jan 2021
Figure 3: The Number of the Memorandum of Questions Submitted to the House of Representatives
Note: The dark blue line represents the number of the MOQ submitted to the House of Representatives. Shaded areas correspond
to when the Diet is held. The 198th Diet starts on January 28, 2019, and ends on June 26, 2019. The 199th extraordinary
Diet starts from August 1, 2019, and ends on August 5, 2019. The 200th extraordinary Diet starts from October 4, 2019, to
December 9, 2019. The 201st ordinary Diet starts on January 20, 2020, and ends on June 17, 2020. The 202nd extraordinary
Diet starts on September 16, 2020, and ends on September 18, 2020. The 203rd extraordinary Diet starts on October 26, 2020,
and ends on December 5, 2020.
3.2 Mobility Data
Our mobile location data cover four 500-square-meter areas in Kasumigaseki, which are shown in Figure 4,11
from January 1, 2019, to December 31, 2020. It is based on the location information on users of NTT
Docomo Inc., the largest mobile phone carrier in Japan. The information in this data set is based on 80
million mobile phones. Unlike other data sets based on GPS information, the location information is based
on mobile phones’ communication with base stations, which provides technological merits for our analyses:
when mobile phones are turned on, they keep accessing nearby base-stations even when they are not used.
This means that we can obtain more accurate tracking of users than the GPS-based system, which requires
that the GSP needs to be enabled and applications that use the GPS must be used.
Figure 5 illustrates overall population dynamics in the Kasumigaseki area. Each line in the Figure
indicates an hourly population of a particular day in thousands. Our observation at a particular time is the
number of people who are staying in the area for 60 minutes. If a person stays in the area for 15 minutes,
she is counted as a quarter of a person. The number for a particular time slot corresponds to the number
of people in the subsequent 60 minutes.12 Note that we define that a typical day starts from 5:00 in the
9 We can identify those re-submitted follow-up questions from the title of the MOQ.
10 When the House of Councillors employed the digitalized MOQ system, two changes happened simultaneously. The current
procedures of the MOQ described in Section 2.2 were already employed in the House of Representatives from the 197th
extraordinary Diet starting from October 24, 2018. This is outside of our sample period. It was not the case for the House
of Councillors. The House of Councillors switched to the current procedure and introduced the digitalized MOQ from the
199th extraordinary Diet. Prior to the current system, a time constraint for preparing for a response was tighter under the old
procedures.
11 The Half Grid Square codes defined by JISX0410 for Area 1 to Area 4 are 5339-4519-2, 5339-4610-1, 5339-4509-4, and
5339-4600-3, respectively.
12 For example, if we observe 100 people in a particular area at, say, 8:00, it could mean that 100 people stay there for one
hour, or 600 people remain in the area for 10 minutes each. We cannot identify the difference between these two.
735°40'45"N
Area 1 Area 2
35°40'40"N
35°40'35"N
Latitude
35°40'30"N
Area 3 Area 4
35°40'25"N
35°40'20"N
35°40'15"N
100 m
200 ft Esri Japan, HERE, Garmin, GeoTechnologies, Inc., NGA, USGS
139°44'40"E 139°44'50"E 139°45'E 139°45'10"E 139°45'20"E
Longitude
Figure 4: Kasumigaseki Area
Note: Area 1 includes a part of the Ministry of Foreign Affairs and Ministry of Land, Infrastructure, Transport and Tourism.
Area 2 contains Metropolitan Police Department, Ministry of Justice, Ministry of Internal Affairs and Communications, Ministry
of Land, Infrastructure, Transport and Tourism, Fire and Disaster Management Agency, Public Security Intelligence Agency,
and Japan Fair Trade Commission. Area 3 includes a part of the Ministry of Foreign Affairs, Ministry of Economy, Trade and
Industry, Ministry of Agriculture, Forestry and Fisheries, Ministry of Health, Labour and Welfare, Ministry of the Environment,
and National Personnel Authority. Area 4 comprises the Ministry of Foreign Affairs, Ministry of Finance, National Tax Agency,
Cabinet Legislation Bureau, Cabinet Office, Ministry of Education, Culture, Sports, Science and Technology, Board of Audit,
Financial Services Agency, and Patent Office.
2019
100
50
0
6 8 10 12 14 16 18 20 22 24 26 28
Hour
2020
100
50
0
6 8 10 12 14 16 18 20 22 24 26 28
Hour
Figure 5: Mobility Patterns in the Kasumigaseki Area (thousands)
8morning when the first train arrives at Kasumigaseki station, and it ends at 28:00, which is 4:00 in the next
morning. The beginning and end of the day correspond to when we observe the minimum population in the
Kasumigaseki area. Since we are interested in the overtime work of government officials, our data are on
people of age groups from the 20s to the 60s. In our data set, we can observe information about gender in
addition to age category.
As it can be seen in the Figure, there are seasonal patterns in the population dynamics. People come to
their offices by 10:00. There are more divergent patterns in leaving their offices. Even after midnight, we
observe the nonnegligible size of the population.
It is noteworthy that due to the COVID-19 pandemic, the mobility pattern in 2020 is different from that
in 2019. We see larger variations in the area population dynamics for the data of 2020, possibly due to
newly-introduced remote work practices in the midst of the COVID-19 pandemic.
4 Model
We are interested in what would be the impact of submitting an extra MOQ on overtime work of government
officials in the near future. In other words, for h = 0, 1, · · · , our objective is to compute
∂pHH,t+h
, (1)
∂qt
where pHH,t represents the log hourly population at HH o’clock on date t and qt corresponds to the number
of MOQ submitted at date t.
Using the local projection method proposed by Jordá (2005), we can estimate (1) from the following
single regression
pHH,t+h = α + θHH,h qt + ϕ′HH,h xt + eHH,t+h , (2)
where α is a constant, xt represents a vector of control variables, ϕ′HH,h corresponds to the associated vector
of coefficients, and eHH,t+h is an error term. The control variables include past log population and a set of
dummy variables. The past log population consists of the early-time population of the same data and the
lagged population on earlier dates. It is given by
p
X p X
X d
βi,0 pHH−i,t + βi,j pHH−i,t−j . (3)
i=1 i=0 j=1
| {z } | {z }
early-time population lagged population
A set of dummy variables contains (i) the Diet period dummy, (ii) Year-2020 dummy, (iii) Day-of-week
dummies, and (iv) National holiday dummies (including observed ones).
A critical presumption is that the number of MOQs and the timing of the submission are exogenous
so that changes in qt are “shocks” to government officials. Our justification of this validity is based on
Tanaka (2008), who documents the detailed procedures for preparing the response to the MOQs. Tanaka
(2008) argues that it is impossible for government officials to anticipate the submission of the MOQs. He
also emphasizes the abruptness of the MOQs because policymakers can ask questions about anything and
anytime (during the Diet period) whenever they think it is necessary and force to receive replies within a
week. Of course, there are some predictable MOQs by skimming through the list of MOQs. For example,
when the Diet starts, we almost always observe a set of questions submitted by particular policymakers
9on certain matters. When there are some scandals for Ministries and government agencies, we can easily
predict that the related MOQ will be submitted. Given the nature that a single Diet member can submit
the MOQs anytime, we cannot anticipate exactly when they are submitted. We provide some robustness
checks to address this issue.
Even when the submission of the MOQ were fully anticipated, the impact on the overtime population
would be accurately measured. The anticipation affects our results greatly when there is room for government
officials to smooth their workloads. However, it is a well-known fact that the working environment for
government officials is extremely tight and that overtime work is quite common. It does not make sense to
prepare for something that has not been submitted yet when they are already overloaded and working on
the intensive margin.
One of advantages of using the local projection method is its flexibility. We can easily obtain conditional
responses by estimating
pHH,t+h = α + st θHH,h qt + (1 − st )κHH,h qt + ϕ′HH,h xt + et+h , (4)
where st is a dummy variable, which takes 1 when a certain condition is met and 0 otherwise.13
It may be the case that the mobility dynamics in the Kasumigaseki area are affected by something other
than lagged population in the area. In the current specification, we are not considering other variables.
One possibility would be flow from neighboring areas. It might be relevant, especially during the daytime.
However, to the extent that such flow is unrelated to the number of the MOQs, the estimated impact of the
MOQ shock will be unaffected. Moreover, there are no other high-frequency data available to account for
determinants of the area population. One potential candidate would be to include weather-related variables,
such as temperature and rainfalls. However, the area we are interested in is a business district. Unlike
recreational or tourist places, it seems that the area population in the business district is less likely to be
affected by changes in weather. Even when it is the case, the lagged population in the area can account for
such an effect. It may be important to include forward-looking variables, such as heavy rain/snow warnings,
however. These warnings may induce people to go home earlier. Again, to the extent that these warnings
are unrelated to the MOQ submission, the estimated impact of the MOQ will be unrelated.
5 Results
This section examines the estimated impact of the MOQ on the overtime population
∂pHH,t+h
= θ̂HH,h , (5)
∂qt
for HH = 17, · · · , 28. For each HH, we estimate this for h = 0, 1, · · · , 14, that is for two weeks ahead. For
now, we set p = 6 and d = 3. To the extent that we include sufficient number of lags for the past population,
the estimated results are robust to different choice of p and/or d. Typically, the error term will be serially
correlated, we use Newey-West standard errors. Note that it is well-known that the error bands tend to be
wider (c.f., Ramey, 2016; Barnichon and Brownlees, 2019). So, our results can be viewed as lower bounds
for the impact of the MOQ on overtime work in Kasumigaseki area.
We begin by looking at the unconditional responses of overtime work to the MOQ shock, which is an
13 This specification can be further extedned by replacing s with 0 ≤ F (z ) ≤ 1, where z is some state variable and F (·) is
t t t
a continuous function, so that we can capture state dependency of the MOQ shock.
1017:00 18:00 19:00 20:00
2 2 2 2
1 1 1 1
0 0 0 0
-1 -1 -1 -1
0 2 4 6 8 10 12 14 0 2 4 6 8 10 12 14 0 2 4 6 8 10 12 14 0 2 4 6 8 10 12 14
21:00 22:00 23:00 24:00
2 2 2 2
1 1 1 1
0 0 0 0
-1 -1 -1 -1
0 2 4 6 8 10 12 14 0 2 4 6 8 10 12 14 0 2 4 6 8 10 12 14 0 2 4 6 8 10 12 14
25:00 26:00 27:00 28:00
2 2 2 2
1 1 1 1
0 0 0 0
-1 -1 -1 -1
0 2 4 6 8 10 12 14 0 2 4 6 8 10 12 14 0 2 4 6 8 10 12 14 0 2 4 6 8 10 12 14
Figure 6: Impact of the MOQ Shock on the Nighttime Population in Kasumigaseki
Note: Vertical axes measure percentage changes in area population. Horizontal axes measure the number of days after an
MOQ is submitted. Thick lines are point estimates, and thin lines represent ±2-standard-error bands. Dots indicate significant
responses.
exogenous increase in the MOQ submitted at date t. After providing a validity check for exogeneity, we will
decompose the unconditional responses. Further, we will examine the impact of the pape-based MOQ shock,
and we will explore the consequences of submitting the MOQ under different circumstances.
5.1 Unconditional Responses
The MOQ shock affects overtime work significantly after one week on average. Figure 6 shows percentage
changes in the area population in response to the MOQ shock. Each panel in Figure 6 displays responses in
each hour. That is, it plots θ̂HH,t+h ×100 as a function of the number of days after the MOW shock, h, which
is on the horizontal axis of each panel. Thick lines represent point estimates, and thin lines correspond to
±2-standard-error bands. Dots indicate significant responses. There are significant responses observed on
the impact day. However, they are quantitatively negligible. On average, the MOQ shock does not affect
overtime work significantly up to 6 days after the shock. One week after the shock, however, the responses
become significant from 17:00 to 23:00 on average. Responses observed after 24:00 are all insignificant.
There are significant effects observed 12 and 13 days after the MOQ shock. Because of the 1-week
requirement, we do not expect to see changes in the overtime population if the additional tasks created by
the MOQ shock do not slow down ordinary jobs. However, we do observe significant increases in the overtime
population 12 and 13 days later. This can happen if there are rippled effects of preparing for the reply to
the MOQ on regular tasks. We call this indirect impact beyond the MOQ deadline a congestion effect. On
average, we observe congestion effects 12 and 13 days after the MOQ shock. The magnitude is comparable
to or even bigger than the direct impact we observe one week after the shock. This congestion effect is an
112
% Change in the Area Population
1.5
1
0.5
0
-0.5
17 18 19 20 21 22 23 24 25 26 27 28
Clock Time
Figure 7: After-one-week Responses to the MOQ Shock
Note: Vertical axis measures percentage changes in area population. Horizontal axis measures clock time. Thick lines
are point estimates, and thin lines represent ±2-standard-error bands. Dots indicate significant responses.
important side effect of policymakers submitting the MOQ.
Figure 7 summarizes the 1-week-later responses. That is, Figure 7 plots θ̂HH,7 × 100 as a function of
clock time, HH, which is on the horizontal axis. For example, one week after the shock, the population
increases more than one percent at 19:00, compared with the average population in the Kasumigaseki area.
The impact of shock decays as the night goes on. It becomes insignificant after 24:00. This result suggests
that upon receiving the MOQ shock, government officials work overtime by midnight.14
Is the impact negligible? We argue that it is not. Typically, a single MOQ is assigned to one person. If
she or he has to work longer, it might be OK because preparing the reply in a timely manner is necessary to
guarantee healthy discussion among policymakers and transparency of the Cabinet. However, if more than
one person has to work overtime, submitting the MOQ creates a negative spillover effect. Table 1 summarize
the result of the back-of-envelope calculation based on the average population in each time slot during the
Diet period. Even at 23:00, there are more than 30 people working overtime due to the MOQ shock. This
is clearly nonnegligible.
5.2 Placebo Test
The validity of our estimate hinges on the fact that the submission of the MOQ is exogenous to government
officials. However, it might be anticipated. To examine this possibility, we estimate
∂pHH,t−1
. (6)
∂qt
We set h = −1 in (1), instead of taking a partial derivative of the population in the near future (h ≥ 0).
That is, we estimate changes in the population yeterday when there is an additional increase in the MOQ
today. Figure 8 summarizes the result of this placebo test.
14 A significant increase at 23:00 means the area population from 23:00 to 23:59 is increased significantly in a statistical sense.
12Table 1: Average Population during the Diet Period
Time Ave. Population Estimated Increases
18:00 37,275 392
19:00 26,598 304
20:00 19,347 192
21:00 14,031 125
22:00 10,066 67
23:00 6,849 31
24:00 4,155 12
25:00 3,136 4
Note: The estimated increases in the area population are calcu-
lated based on the point estimates.
0.2
0.15
% Change in the Area Population
0.1
0.05
0
-0.05
-0.1
-0.15
-0.2
16 18 20 22 24 26 28
Clock Time (HH)
Figure 8: Placebo Test – ∂pHH,t−1 /∂qt
Note: Vertical axis measures percentage changes in area population. Horizontal axis measures clock time. Error
bars are based on ±2 standard error.
It turns out that the responses are all insignificant. This result suggests that the overtime population is
not reacting to potentially anticipated changes in the number of the MOQs.
5.3 Decomposing the Unconditional Responses
There are interesting variations in terms of gender-age-specific responses. So far, we have focused on the
aggregated responses of the Kasumigaseki population. However, the data set allows us to decompose the
aggregate responses to age- and gender-specific responses. Figure 9 displays gender-age-specific responses
one week after the MOQ shock. Figure 9a shows age-specific responses of the male population one week
after the shock, and those of the female population are in Figure 9b.
There are significant increases in the population even after midnight for Male 20s and Female 40s. These
two demographic groups are the most heavily affected by the MOQ shock. Male 20s show significant response
at 25:00 (one o’clock in the morning). However, there are no such responses at 23:00 and 24:00, suggesting
that if they can go home earlier, they do so by 23:00 and that they tend to work overtime by 26:00 (two
13Male 20s Male 30s Male 40s
2 2 2
1.5 1.5 1.5
1 1 1
0.5 0.5 0.5
0 0 0
-0.5 -0.5 -0.5
18 20 22 24 26 28 18 20 22 24 26 28 18 20 22 24 26 28
Clock Time (HH) Clock Time (HH) Clock Time (HH)
Male 50s Male 60s
2 2
1.5 1.5
1 1
0.5 0.5
0 0
-0.5 -0.5
18 20 22 24 26 28 18 20 22 24 26 28
Clock Time (HH) Clock Time (HH)
(a) Male-Age-Specific Responses
Female 20s Female 30s Female 40s
2 2 2
1.5 1.5 1.5
1 1 1
0.5 0.5 0.5
0 0 0
-0.5 -0.5 -0.5
18 20 22 24 26 28 18 20 22 24 26 28 18 20 22 24 26 28
Clock Time (HH) Clock Time (HH) Clock Time (HH)
Female 50s Female 60s
2 2
1.5 1.5
1 1
0.5 0.5
0 0
-0.5 -0.5
18 20 22 24 26 28 18 20 22 24 26 28
Clock Time (HH) Clock Time (HH)
(b) Female-Age-Specific Responses
Figure 9: Gender-Age-Specific One-Week-Later Responses to the MOQ Shock
Note: Vertical axes measure percentage changes in area population. Horizontal axes measure clock time. Thick lines are point
estimates, and thin lines represent ±2-standard-error bands. Dots indicate significant responses.
14o’clock in the morning) if they have to stay longer. Female 40s show significant increases until 24:00. Even
though the aggregate result suggests that the overtime work due to the MOQ remains significant until 23:00,
Male 20s and Female 40s are exceptions.
There is some difference between male and female government officials in response to the MOQ shock.
Female government officials (except for the 40s) are less affected in terms of duration of overtime compared
with the aggregate result. In terms of the magnitude of responses, we observe more pronounced increases
for female government officials than male counterparts. It is important to note that these are observed
consequences, not choices.
Responses of the 60s are somewhat insignificant. A caveat here is that most government officials retire
at the age of 60. To be precise, they retire on March 31 of the fiscal year when they become 60 years old. In
this sense, there might not be enough 60s who are affected by the submission of the MOQ, and interpretation
of the responses for the 60s requires some caution.
5.4 Impact of the Paper-based MOQ
As mentioned in Section 2.3, one of the most important changes in handling the MOQ is the digitalization of
the whole procedure. The House of Representatives employs it from the 200th extraordinary Diet (October
4, 2019 – December 9, 2019). It is natural to imagine that this digitalization has affected overtime work
related to the MOQ.
One caveat here is that the period for the digitalized MOQ (after mid-2019) is mostly overlapped with
the COVID-19 pandemic when the remote work was highly advocated. Although it is commonly said that
implementation of remote work was relatively slower for the public sector than private sectors, there are
some reductions in the area population, as can be seen in Figure 5. There is a possibility that the effect
of digitalization is contaminated by the impact of the remote work due to the pandemic. Thus, it is more
reasonable to view this exercise as purifying the effect of the paper-based MOQ on overtime work.15
There are drastic differences between responses to the paper-based MOQ shock, shown in Figure 10a,
and those to the digitalized MOQ shock, displayed in Figure 10b. There are four differences. First, we
observe significant responses much earlier and more frequently than those to the digitalized MOQ shock. On
the one hand, there are significant responses to the paper-based MOQ shock four to six days later. On the
other hand, responses to the digitalized MOQ shock become significant one week later. This is similar to
those of the unconditional responses to the MOQ shock, shown in Figure 6. Second, the digitalized MOQ
shock induces less overtime work than the paper-based MOQ shock. While significant responses almost
disappear after 21:00 for the digitalized MOQ, responses to the paper-based MOQ shock remain significant
even at 23:00. Third, the magnitude of these responses is much larger compared with the digitalized MOQ
shock. For example, responses to the paper-based MOQ shock at 19:00 are close to two percent, while
those to the digitalized are less than one percent. Finally, the congestion effects appear earlier than those
of the digitalized MOQ shock. This seems reasonable because we observe significant positive responses to
the paper-based MOQ shock earlier than the digitalized MOQ shock. For the paper-based MOQ shock, we
observe the significant congestion effects ten days later.
The impact of the paper-based MOQ shock on overtime work is much more pronounced than that of
the digitalized MOQ shock. Of course, there is a reservation to interpret this result as reductions in the
15 We still think that the digitalized MOQ shock is mostly capturing the effect of the digitalized system. One suggestive
evidence is that when we split the sample into the pre-pandemic and post-pandemic periods, we do not observe drastic differences
in the response. A more detailed investigation is warranted.
1517:00 18:00 19:00 20:00
2 2 2 2
1 1 1 1
0 0 0 0
-1 -1 -1 -1
0 2 4 6 8 10 12 14 0 2 4 6 8 10 12 14 0 2 4 6 8 10 12 14 0 2 4 6 8 10 12 14
21:00 22:00 23:00 24:00
2 2 2 2
1 1 1 1
0 0 0 0
-1 -1 -1 -1
0 2 4 6 8 10 12 14 0 2 4 6 8 10 12 14 0 2 4 6 8 10 12 14 0 2 4 6 8 10 12 14
25:00 26:00 27:00 28:00
2 2 2 2
1 1 1 1
0 0 0 0
-1 -1 -1 -1
0 2 4 6 8 10 12 14 0 2 4 6 8 10 12 14 0 2 4 6 8 10 12 14 0 2 4 6 8 10 12 14
(a) Responses to the Paper-based MOQ Shock
17:00 18:00 19:00 20:00
2 2 2 2
1 1 1 1
0 0 0 0
-1 -1 -1 -1
0 2 4 6 8 10 12 14 0 2 4 6 8 10 12 14 0 2 4 6 8 10 12 14 0 2 4 6 8 10 12 14
21:00 22:00 23:00 24:00
2 2 2 2
1 1 1 1
0 0 0 0
-1 -1 -1 -1
0 2 4 6 8 10 12 14 0 2 4 6 8 10 12 14 0 2 4 6 8 10 12 14 0 2 4 6 8 10 12 14
25:00 26:00 27:00 28:00
2 2 2 2
1 1 1 1
0 0 0 0
-1 -1 -1 -1
0 2 4 6 8 10 12 14 0 2 4 6 8 10 12 14 0 2 4 6 8 10 12 14 0 2 4 6 8 10 12 14
(b) Responses to the Digitalized MOQ Shock
Figure 10: Responses to the Paper-based and Digitalized MOQ
Note: Panel (a) shows responses to the pape-based MOQ shock, while panel (b) displays those to the digitalized MOQ shock.
Vertical axes measure percentage changes in population. Horizontal axes measure the number of days after an MOQ is submitted.
Thick lines are point estimates, and thin lines represent ±2-standard-error bands. Dots indicate significant responses.
16MOQ-related overtime work by the introduction of the digitalized system.
5.5 Conditional Responses
In this subsection, we will examine more detailed responses of the overtime work, depending on when
the MOQ is submitted. Figures 11–15 present responses to the MOQ submitted on Monday to Friday,
respectively. The top panels in these Figures correspond to responses to the paper-based MOQ shock, and
the bottom panels are to those to the digitalized MOQ shock. We can see that there are large heterogeneities
in the responses depending on when the MOQ shock hits the Kasumigaseki area.
In response to the paper-based question submitted on Monday, shown in Figure 11, we can observe that
there are large increases in the area population seven days later. The magnitude of responses is relatively
bigger than other days of the week. The area population significantly increases by more than five percent
at 17:00 and remains significant until 24:00. Responses to the digitalized MOQ submitted on Monday are
positive and significant, around one percent, but they become insignificant for the late night. Another thing
to note is that positive and significant responses are observed more frequently compared with the responses
to the paper-based MOQ.
In terms of the effect on overtime work, the MOQ submitted on Tuesday seems to be quite different from
other days of the week, as shown in Figure 12. Regardless of whether the paper-based MOQ or digitalized
MOQ shock, the responses are almost always insignificant.
The responses to the MOQ shock on Wednesday are different from other days of the week, as well as
within Wednesday, depending on the time slots. For early time slots (17:00 to 21:00), we observe significant
and positive responses to the paper-based MOQ shock. There are positive and significant responses from
26:00 to 28:00 two days after the shock (i.e., on Friday “night” or Saturday morning). We can also observe
positive and significant responses at 22:00, 23:00, 26:00, and 27:00 three days after the shock (i.e., on Saturday
“night”). While there is the strong significant impact of the paper-based MOQ on overtime work, it is not
the case for the digitalized MOQ shock.
From Figure 14, we observe that Thursday responses to the paper-based MOQ shock are significant at
the most of time slots two days after the shock (i.e., on Saturday “night”). We can also see positive and
significant responses at 22:00, 23:00, and 24:00 three days after the shock (i.e., on Sunday night). Regarding
the responses to the digitalized MOQ shock, there are positive and significant responses seven days after the
shock. This is similar to those on Monday.
Responses to the paper-based MOQ submitted on Friday, shown in Figure 15, are mostly insignificant
and much muted, compared with other days of the week. Responses to the digitalized MOQ submitted on
Friday deserve some attention. The digitalized MOQ shock realized on Friday lowers the overtime work one
day and two days after the shock (i.e., Saturday and Sunday).
It is evident that there exist large heterogeneities in response to the MOQ shock. It is important
to emphasize that the timing of submitting the MOQ matters for overtime work. In particular, there is
suggestive evidence that the MOQ shock can induce working over weekends (and overtime).
5.6 Discussion
Before we conclude, a couple of things deserve careful discussion. First, there may be a potential endogeneity
problem. One potential issue could be related to scandals of government offices and public agencies. When a
scandal happens, it is natural to imagine that government officials working at the corresponding Ministry tend
17to stay longer. Such a scandal also triggers questions from the Diet member inquiring about the perspective
of the Cabinet and seeking additional information. It is important to account for such a possibility. For
example, it may be helpful to construct some measure of media exposures for the Government offices and
public agencies. However, we think that such an impact is already incorporated in our specification to
some extent. A scandal does not affect the area population at a particular time slot. When it emerges,
it affects not only the current population pHH,t , but also the past population pHH−j,t−h for some j and h.
We are partially addressing this potential issue by including the early-time population as well as the lagged
population in (3).
Second, related to the first point, one might have a reservation for a causal interpretation of our results.
Even when it is the case, one can view our results as summarising the dynamic correlation between the
submission of MOQ and changes in overtime work for Japanese government officials.
Third, as mentioned above, the timing of introducing the digitalized MOQ is overlapped with the period
of the COVID-19 pandemic. Although it is said that remote work has been less utilized in the public sector
than in the private sector, we cannot ignore the possibility that overtime work is done remotely. If it is
the case, we cannot correctly measure the impact of the digitalized MOQ on overtime work. The estimated
responses to the digitalized MOQ would be misleading. However, the responses to the traditional paper-based
MOQ remain unchanged.
6 Conclusion
In this study, we shed light on the overtime work of government officials. Although their work is essential for
the management of our civil society, working overtime can be a source of inefficiency by damaging human
capital. We use mobile phone location data to estimate the impact of the MOQ on the overtime work of
Japanese government officials using the local projection. Unlike conventional reported overtime working
hours, the mobile phone location data give us a more accurate picture of the nighttime population in the
Kasumigaseki area. We also exploit the 1-week deadline of the MOQ to quantify the impact of the MOQ
shock on the overtime work.
We find that there are positive and significant increases in the nighttime population in the Kasumigaseki
area one week in response to receiving an extra MOQ from a policymaker. In particular, one week after
the MOQ shock, the overtime work increases and persists by midnight. Male 20s and female 40s are the
most heavily affected by the MOQ shock. Submitting an MOQ has negative spillover effects on the overtime
work of Japanese government officials, meaning that the economically nonnegligible number of government
officials are involved. This finding suggests that policymakers should refrain from abusive use of the MOQ.
We also find that there are much stronger impacts of the paper-based MOQ shock on overtime work. It
is tempting to attribute this as a consequence of digitalization that took place in mid-2019. However, its
timing cannot be completely isolated from the COVID-19 pandemic, which stimulated utilizing remote work
practices, so that we cannot correctly measure the impact on the overtime work. We leave a more thorough
analysis with this regard for future work.
18References
Alexander, D. and E. Karger (2021): “Do Stay-at-Home Orders Cause People to Stay at Home? Effects
of Stay-at-Home Orders on Consumer Behavior,” The Review of Economics and Statistics, 1–25.
Athey, S., B. A. Ferguson, M. Gentzkow, and T. Schmidt (2020): “Experienced Segregation,”
Working Paper 27572, National Bureau of Economic Research.
Barnichon, R. and C. Brownlees (2019): “Impulse response estimation by smooth local projections,”
Review of Economics and Statistics, 101, 522–530.
Barrios, J. M. and Y. Hochberg (2020): “Risk Perception Through the Lens of Politics in the Time of
the COVID-19 Pandemic,” Working Paper 27008, National Bureau of Economic Research.
Chen, M. K. and D. G. Pope (2020): “Geographic Mobility in America: Evidence from Cell Phone Data,”
Working Paper 27072, National Bureau of Economic Research.
Couture, V., J. I. Dingel, A. Green, J. Handbury, and K. R. Williams (2021): “JUE Insight:
Measuring movement and social contact with smartphone data: a real-time application to COVID-19,”
Journal of Urban Economics, 103328.
Fang, H., L. Wang, and Y. Yang (2020): “Human mobility restrictions and the spread of the Novel
Coronavirus (2019-nCoV) in China,” Journal of Public Economics, 191, 104272.
Jordá, O. (2005): “Estimation and Inference of Impulse Responses by Local Projections,” American Eco-
nomic Review, 95, 161–182.
Kobara, J. (2021): “Japan Faces Crisis as Overwork Drains Pool of Policymakers,” Nikkei Asia, https:
//asia.nikkei.com/Politics/Japan-faces-crisis-as-overwork-drains-pool-of-policymakers.
Kyodo (2021): “Concern after Japan Virus Officials Averaged 124 Hours of Overtime
in January,” The Japan Times, https://www.japantimes.co.jp/news/2021/03/08/national/
covid-19-in-japan-yasutoshi-nishimura-health-overwork/.
Matsumura, K., Y. Oh, T. Sugo, and K. Takahashi (2021): “Nowcasting Economic Activity with
Mobility Data,” Working Paper Series No. 21-E-2, Bank of Japan.
Ministry of Finance (2010): “Zaimusho ga Kawaru Tameno 50 no Teigen: Motivation, Open, Flexible
[Fifty Proposals for the Ministry of Finance to Change: Motivation, Open, and Flexible],” https://www.
mof.go.jp/about mof/councils/mof-pt/220419/all.pdf.
Ministry of Health, Labor, and Welfare (2019): “Koseiroudousho wo Kaeru Tame ni Subete no
Shokuin de Jitsugen Saseru Koto [Things that Every Official Needs to Do to Change Ministry of Health,
Labor, and Welfare],” https://www.mhlw.go.jp/content/11600000/000540524.pdf.
Miyauchi, Y., K. Nakajima, and S. J. Redding (2021): “Consumption Access and the Spatial Concen-
tration of Economic Activity: Evidence from Smartphone Data,” Working Paper 28497, National Bureau
of Economic Research.
Mizuno, T., T. Ohnishi, and T. Watanabe (2021): “Visualizing Social and Behavior Change due to the
Outbreak of COVID-19 Using Mobile Phone Location Data,” New Generation Computing, 39, 453–468.
19Olea, M., J. Luis, and M. Plagborg-Møller (2021): “Local projection inference is simpler and more
robust than you think,” Econometrica, 89, 1789–1823.
Pencavel, J. (2015): “The Productivity of Working Hours,” The Economic Journal, 125, 2052–2076.
Plagborg-Møller, M. and C. K. Wolf (2021): “Local projections and VARs estimate the same impulse
responses,” Econometrica, 89, 955–980.
Ramey, V. A. (2016): “Macroeconomic Shocks and Their Propagation,” in Handbook of Macroeconomics,
ed. by J. B. Taylor and H. Uhlig, Elsevier, vol. 2, chap. 2, 71–162.
Sato, K., S. Kuroda, and H. Owan (2020): “Mental health effects of long work hours, night and weekend
work, and short rest periods,” Social Science & Medicine, 246, 112774.
Tanaka, S. (2008): “Making Process of the Written Answers to Japanese Diet,” Meiji University Journal
of Politics, 28, 39–58.
Watanabe, T. and T. Yabu (2021a): “Japan’s voluntary lockdown,” PLOS ONE, 16, 1–20.
——— (2021b): “Japan’s voluntary lockdown: further evidence based on age-specific mobile location data,”
The Japanese Economic Review, 72, 333–370.
2017:00 18:00 19:00 20:00
5 5 5 5
0 0 0 0
-5 -5 -5 -5
0 2 4 6 8 10 12 14 0 2 4 6 8 10 12 14 0 2 4 6 8 10 12 0 2 4 6 8 10 12 14
21:00 22:00 23:00 24:00
5 5 5 5
0 0 0 0
-5 -5 -5 -5
0 2 4 6 8 10 12 14 0 2 4 6 8 10 12 14 0 2 4 6 8 10 12 14 0 2 4 6 8 10 12 14
25:00 26:00 27:00 28:00
5 5 5 5
0 0 0 0
-5 -5 -5 -5
0 2 4 6 8 10 12 14 0 2 4 6 8 10 12 14 0 2 4 6 8 10 12 14 0 2 4 6 8 10 12 14
(a) Responses to the Paper-based MOQ Shock
17:00 18:00 19:00 20:00
5 5 5 5
0 0 0 0
-5 -5 -5 -5
0 2 4 6 8 10 12 14 0 2 4 6 8 10 12 14 0 2 4 6 8 10 12 14 0 2 4 6 8 10 12 14
21:00 22:00 23:00 24:00
5 5 5 5
0 0 0 0
-5 -5 -5 -5
0 2 4 6 8 10 12 14 0 2 4 6 8 10 12 14 0 2 4 6 8 10 12 14 0 2 4 6 8 10 12 14
25:00 26:00 27:00 28:00
5 5 5 5
0 0 0 0
-5 -5 -5 -5
0 2 4 6 8 10 12 14 0 2 4 6 8 10 12 14 0 2 4 6 8 10 12 14 0 2 4 6 8 10 12 14
(b) Responses to the Digitalized MOQ Shock
Figure 11: Responses to the Paper-based and Digitalized MOQ Shock Submitted on Monday
Note: Panel (a) shows responses to the paper-based MOQ shock, while panel (b) displays those to the digitalized MOQ
shock. Vertical axes measure percentage changes in population. Horizontal axes measure the number of days after an MOQ
is submitted. Thick lines are point estimates, and thin lines represent ±2-standard-error bands. Dots indicate significant
responses.
2117:00 18:00 19:00 20:00
2 2 2 2
0 0 0 0
-2 -2 -2 -2
0 2 4 6 8 10 12 14 0 2 4 6 8 10 12 14 0 2 4 6 8 10 12 14 0 2 4 6 8 10 12 14
21:00 22:00 23:00 24:00
2 2 2 2
0 0 0 0
-2 -2 -2 -2
0 2 4 6 8 10 12 14 0 2 4 6 8 10 12 14 0 2 4 6 8 10 12 14 0 2 4 6 8 10 12 14
25:00 26:00 27:00 28:00
2 2 2 2
0 0 0 0
-2 -2 -2 -2
0 2 4 6 8 10 12 14 0 2 4 6 8 10 12 14 0 2 4 6 8 10 12 14 0 2 4 6 8 10 12 14
(a) Responses to the Paper-based MOQ Shock
17:00 18:00 19:00 20:00
2 2 2 2
0 0 0 0
-2 -2 -2 -2
0 2 4 6 8 10 12 14 0 2 4 6 8 10 12 14 0 2 4 6 8 10 12 14 0 2 4 6 8 10 12 14
21:00 22:00 23:00 24:00
2 2 2 2
0 0 0 0
-2 -2 -2 -2
0 2 4 6 8 10 12 14 0 2 4 6 8 10 12 14 0 2 4 6 8 10 12 14 0 2 4 6 8 10 12 14
25:00 26:00 27:00 28:00
2 2 2 2
0 0 0 0
-2 -2 -2 -2
0 2 4 6 8 10 12 14 0 2 4 6 8 10 12 14 0 2 4 6 8 10 12 14 0 2 4 6 8 10 12 14
(b) Responses to the Digitalized MOQ Shock
Figure 12: Responses to the Paper-based and Digitalized MOQ Shock Submitted on Tuesday
Note: Panel (a) shows responses to the paper-based MOQ shock, while panel (b) displays those to the digitalized MOQ
shock. Vertical axes measure percentage changes in population. Horizontal axes measure the number of days after an MOQ
is submitted. Thick lines are point estimates, and thin lines represent ±2-standard-error bands. Dots indicate significant
responses.
2217:00 18:00 19:00 20:00
6 6 6 6
4 4 4 4
2 2 2 2
0 0 0 0
-2 -2 -2 -2
0 2 4 6 8 10 12 14 0 2 4 6 8 10 12 14 0 2 4 6 8 10 12 14 0 2 4 6 8 10 12 14
21:00 22:00 23:00 24:00
6 6 6 6
4 4 4 4
2 2 2 2
0 0 0 0
-2 -2 -2 -2
0 2 4 6 8 10 12 14 0 2 4 6 8 10 12 14 0 2 4 6 8 10 12 14 0 2 4 6 8 10 12 14
25:00 26:00 27:00 28:00
6 6 6 6
4 4 4 4
2 2 2 2
0 0 0 0
-2 -2 -2 -2
0 2 4 6 8 10 12 14 0 2 4 6 8 10 12 14 0 2 4 6 8 10 12 14 0 2 4 6 8 10 12 14
(a) Responses to the Paper-based MOQ Shock
17:00 18:00 19:00 20:00
6 6 6 6
4 4 4 4
2 2 2 2
0 0 0 0
-2 -2 -2 -2
0 2 4 6 8 10 12 14 0 2 4 6 8 10 12 14 0 2 4 6 8 10 12 14 0 2 4 6 8 10 12 14
21:00 22:00 23:00 24:00
6 6 6 6
4 4 4 4
2 2 2 2
0 0 0 0
-2 -2 -2 -2
0 2 4 6 8 10 12 14 0 2 4 6 8 10 12 14 0 2 4 6 8 10 12 14 0 2 4 6 8 10 12 14
25:00 26:00 27:00 28:00
6 6 6 6
4 4 4 4
2 2 2 2
0 0 0 0
-2 -2 -2 -2
0 2 4 6 8 10 12 14 0 2 4 6 8 10 12 14 0 2 4 6 8 10 12 14 0 2 4 6 8 10 12 14
(b) Responses to the Digitalized MOQ Shock
Figure 13: Responses to the Paper-based and Digitalized MOQ Shock Submitted on Wednesday
Note: Panel (a) shows responses to the paper-based MOQ shock, while panel (b) displays those to the digitalized MOQ
shock. Vertical axes measure percentage changes in population. Horizontal axes measure the number of days after an MOQ
is submitted. Thick lines are point estimates, and thin lines represent ±2-standard-error bands. Dots indicate significant
responses.
2317:00 18:00 19:00 20:00
5 5 5 5
0 0 0 0
-5 -5 -5 -5
0 2 4 6 8 10 12 14 0 2 4 6 8 10 12 14 0 2 4 6 8 10 12 14 0 2 4 6 8 10 12 14
21:00 22:00 23:00 24:00
5 5 5 5
0 0 0 0
-5 -5 -5 -5
0 2 4 6 8 10 12 14 0 2 4 6 8 10 12 14 0 2 4 6 8 10 12 14 0 2 4 6 8 10 12 14
25:00 26:00 27:00 28:00
5 5 5 5
0 0 0 0
-5 -5 -5 -5
0 2 4 6 8 10 12 14 0 2 4 6 8 10 12 14 0 2 4 6 8 10 12 14 0 2 4 6 8 10 12 14
(a) Responses to the Paper-based MOQ Shock
17:00 18:00 19:00 20:00
5 5 5 5
0 0 0 0
-5 -5 -5 -5
0 2 4 6 8 10 12 14 0 2 4 6 8 10 12 14 0 2 4 6 8 10 12 14 0 2 4 6 8 10 12 14
21:00 22:00 23:00 24:00
5 5 5 5
0 0 0 0
-5 -5 -5 -5
0 2 4 6 8 10 12 14 0 2 4 6 8 10 12 14 0 2 4 6 8 10 12 14 0 2 4 6 8 10 12 14
25:00 26:00 27:00 28:00
5 5 5 5
0 0 0 0
-5 -5 -5 -5
0 2 4 6 8 10 12 14 0 2 4 6 8 10 12 14 0 2 4 6 8 10 12 14 0 2 4 6 8 10 12 14
(b) Responses to the Digitalized MOQ Shock
Figure 14: Responses to the Paper-based and Digitalized MOQ Shock Submitted on Thursday
Note: Panel (a) shows responses to the paper-based MOQ shock, while panel (b) displays those to the digitalized MOQ
shock. Vertical axes measure percentage changes in population. Horizontal axes measure the number of days after an MOQ
is submitted. Thick lines are point estimates, and thin lines represent ±2-standard-error bands. Dots indicate significant
responses.
24You can also read