Population dynamics of the sea snake Emydocephalus annulatus (Elapidae, Hydrophiinae)
←
→
Page content transcription
If your browser does not render page correctly, please read the page content below
www.nature.com/scientificreports
OPEN Population dynamics of the sea
snake Emydocephalus annulatus
(Elapidae, Hydrophiinae)
Richard Shine1,2*, Gregory P. Brown1 & Claire Goiran3
For sea snakes as for many types of animals, long-term studies on population biology are rare and
hence, we do not understand the degree to which annual variation in population sizes is driven by
density-dependent regulation versus by stochastic abiotic factors. We monitored three populations
of turtle-headed sea snakes (Emydocephalus annulatus) in New Caledonia over an 18-year period.
Annual recruitment (% change in numbers) showed negative density-dependence: that is, recruitment
increased when population densities were low, and decreased when densities were high. Windy
weather during winter increased survival of neonates, perhaps by shielding them from predation;
but those same weather conditions reduced body condition and the reproductive output of adult
snakes. The role for density-dependence in annual dynamics of these populations is consistent with
the slow, K-selected life-history attributes of the species; and the influence of weather conditions
on reproductive output suggests that females adjust their allocation to reproduction based on food
availability during vitellogenesis.
All populations change in numbers through time, and an understanding of the mechanisms that drive those
fluctuations can contribute to management and c onservation1. Any change in population size from one year
to the next may reflect the combined effects of mortality, recruitment, immigration and emigration, each of
which may be modified by a range of factors2. As a result, the proximate determinants of shifts in abundance
are complex and variable in both space and time, even for a single species3. One classical paradigm for classify-
ing mechanisms of population regulation invokes a continuum between stochasticity (whereby unpredictable
temporal changes in the environment drive major fluctuations in abundance, keeping the population well below
carrying capacity) and stability (whereby the population remains close to a consistent upper limit set by finite
resource availability)2,4. Although no real population conforms exactly to either extreme, the continuum offers
a valuable conceptual scheme with which to categorise and compare populations1,5,6.
Population fluctuations cannot be measured without long-term data on abundances in the field, encourag-
ing researchers to focus on organisms for which such studies are feasible. Thus, many analyses of population
regulation are based on small common insects5 or common, large and/or commercially valuable mammals
and birds for which detailed records of abundance are available over long periods of time7,8. For squamate rep-
tiles, several studies have documented a link between annual variation in population densities and stochastic
environmental factors, often mediated by abiotically-driven shifts in prey a vailability4,9–12. For example, annual
variation in monsoonal rainfall in the Australian wet-dry tropics affects the availability of several types of prey
(mammals, fishes, frogs) and thus the demography of several species of snakes that feed upon those prey13–16.
However, density-dependence has also been detected in reptile populations, most powerfully through experi-
mental manipulations of abundance17,18.
Few data on this topic are available for marine snakes, due to logistical obstacles. Most ecological studies
on sea snakes have been based on bycatch from commercial trawlers, or derived from relatively short-term
projects19,20, and thus cannot address the issue of population regulation. Our long-term (currently, 18-year)
annual censuses of turtle-headed sea snakes (Emydocephalus annulatus) in New Caledonia provide a unique
opportunity to explore this question. Below, we analyse information on numbers and recruitment-relevant traits
(age structure, body condition, reproductive rate) to examine the roles of density-dependence and stochastic
weather-induced factors in driving year-to-year variation in abundance in sea snake populations in small bays
beside the city of Noumea.
1
Department of Biological Sciences, Macquarie University, Sydney, NSW 2109, Australia. 2School of Life and
Environmental Sciences, University of Sydney, Sydney, NSW 2006, Australia. 3LabEx Corail and ISEA, Université de
la Nouvelle-Calédonie, BP R4, 98851 Nouméa cedex, New Caledonia. *email: rick.shine@mq.edu.au
Scientific Reports | (2021) 11:20701 | https://doi.org/10.1038/s41598-021-00245-2 1
Vol.:(0123456789)www.nature.com/scientificreports/
300 Anse Vata
Baie des Citrons South
Baie des Citrons North
250
Population estimate
200
150
100
50
0
2004 2005 2006 2007 2008 2009 2010 2011 2012 2013 2014 2015 2016 2017 2018 2019 2020 2021
Year
Figure 1. Jolly–Seber estimates of annual population sizes of turtle-headed sea snakes (Emydocephalus
annulatus) in three study sites near Noumea. Estimates for each year are shown with associated standard errors.
Dependent variable Pop. density Summer rain Summer wind Winter rain Winter wind
F1,26.72 = 14.23 F1,32.09 = 0.001 F1,31.76 = 2.57 F1,32.59 = 4.00 F1,31.86 = 8.64
% change in density
P = 0.001 P = 0.98 P = 0.12 P = 0.054 P = 0.006
F1,30 = 0.78 F1,30 = 0.55 F1,30 = 0.03 F1,30 = 8.03 F1,30 = 9.60
Body condition
P = 0.38 P = 0.46 P = 0.87 P = 0.008 P = 0.004
F1,33 = 0.21 F1,33 = 0.96 F1,33 = 0.64 F1,33 = 0.05 F1,33 = 10.56
Repro. frequency
P = 0.64 P = 0.33 P = 0.43 P = 0.82 P = 0.003
F1,33 = 0.96 F1,33 = 1.12 F1,33 = 0.05 F1,33 = 0.19 F1,33 = 17.90
Litter size
P = 0.33 P = 0.30 P = 0.83 P = 0.67 P = 0.0002
Table 1. Results of statistical analyses of annual changes in population densities (numbers of individuals
within 350 × 20 m study areas) of turtle-headed sea snakes (Emydocephalus annulatus) in three populations.
Site (population) was included as a random factor in all analyses, but site effects are not shown. Columns show
results of fixed-effect tests (degrees of freedom, F, P) for population density (“pop. density”) the preceding year,
and for rainfall and wind speeds in both summer (October to April) and winter (May to September). Boldface
font indicates significant values at P < 0.01.
Results
Changes in abundance through time and space. Mean population sizes (densities) were similar
among the three study sites (ANOVA with site as the factor, F2,41 = 2.88, P = 0.07), but varied through time at
each site, with no significant temporal correlation between numerical fluctuations at different sites (the correla-
tion between estimated numbers per year for the two sites with long-term data [Anse Vata vs. Baie des Citrons
south] was r 2 = 0.02, N = 17, P = 0.56; see Fig. 1).
Density‑dependence. Using the method of Dennis and Ponciano21, we detected density-dependence
in the data from Anse Vata (Likelihood ratio = − 665, P < 0.0001) but not Baie des Citrons south (Likelihood
ratio = − 0.65, P = 0.14).
Correlates of changes in abundance. Using a mixed-model multiple regression approach, annual
changes in abundance showed significant density-dependence; that is, a low population density was generally
followed by an increase the following year, whereas a high population density was followed by a decrease (“pop.
density” effect in Table 1; see Fig. 2 for univariate plot of these data). Rates of increase in population density were
also higher after years when winds were stronger than usual in winter (Table 1).
Scientific Reports | (2021) 11:20701 | https://doi.org/10.1038/s41598-021-00245-2 2
Vol:.(1234567890)www.nature.com/scientificreports/
Proportion change in population from previous year
1 Anse Vata
Baie des Citrons South
Baie des Citrons North
0.5
0
-0.5
-1
0 50 100 150 200 250 300
Population estimate in previous year
Figure 2. Univariate plot of density-dependence in annual changes in population densities of turtle-headed sea
snakes, Emydocephalus annulatus, in three populations. Higher population densities were followed by reductions
in population density the following year. Dotted horizontal line shows stability (no change in population density
from one year to the next), and solid sloping line shows least-squares regression fitted to the combined dataset.
See Table 1 for statistical tests of these data, incorporating weather covariates.
Correlates of changes in age structure. Fluctuations in population density were disproportionately
due to changes in the abundance (density) of juvenile snakes. After years when population densities increased,
a higher proportion of individuals were juveniles; the reverse was true in years when population densities
declined (omitting two outliers: F1,34 = 10.98, P = 0.002). The proportion of the population comprised of juveniles
decreased after years with unusually calm conditions in winter ( F1,31.49 = 4.38, P < 0.05) but was not significantly
linked to other weather measures or to population size in the previous year (all P > 0.17). Reproductive output
(proportion of females that were gravid) did not predict age structure in the following year (N = 44, r2 = 0.00005,
P = 0.89).
Phenotypic correlates of population size and weather conditions. All of the traits that we meas-
ured were affected by wind speeds in winter. After winters with calmer-than-usual conditions, snakes were in
better condition (mass relative to length), and females were more likely to be gravid, and to produce larger lit-
ters (Table 1). No other factors (including population density in the previous year) were significant, except that
snakes tended to be in better body condition after winters with less-than-average rainfall (Table 1).
Discussion
At each of the three sites that we studied, the population densities of turtle-headed sea snakes varied among years.
Much of that variation was due to recruitment; that is, annual differences in the numbers of juvenile snakes. Our
analyses identify two correlates (and thus, plausible determinants) of that numerical variation. First, recruitment
rates were reduced when population densities were high, consistent with competition for finite food resources
(presumably exploitative rather than interference competition, because we have never seen overt behavioural
interference among free-ranging snakes). Second, windy conditions in winter enhanced the numbers of juvenile
snakes in the population, but reduced body condition as well as the reproductive output of adult snakes.
Our sampling occurred only once per year, precluding us from partitioning changes in abundance into shifts
due to reproductive output, survival, and immigration/emigration. Because we sampled only in summer, when
females were gravid, we do not know if the juveniles that we captured were the progeny of females from within
the population, or had immigrated from elsewhere. Neonates may be more dispersive than older age classes22,23,
but the high philopatry of individuals (including, young-of-the year snakes), and genetic divergence among s ites24
suggest that immigration and emigration are unlikely to be important. Hence, the lack of a significant correlation
between reproductive output one year and proportion of juvenile snakes the following year suggests that annual
changes in abundance of juveniles are not driven by annual changes in fecundity or migration. Instead, the most
plausible mechanism involves differential survival: neonate snakes survive at higher rates in some years than
others. Such variation has been documented in other tropical snakes (both terrestrial and aquatic) and has been
linked to annual variation in prey availability13,14.
A combination of density-dependence and stochastic (weather-driven) influences on population density is
unsurprising. Finite resources ultimately limit all populations, so that the primary axis of variation in terms of
population-regulation may be whether or not a population remains close to that limit versus being kept well
below it by stochastic events—so that in the latter case, density-dependence may play little role in driving tempo-
ral variation in abundance1,2. In turtle-headed sea snakes, the significant statistical signal of density-dependence
Scientific Reports | (2021) 11:20701 | https://doi.org/10.1038/s41598-021-00245-2 3
Vol.:(0123456789)www.nature.com/scientificreports/
suggests that populations frequently reach a point at which increased densities reduce average viability of indi-
viduals. That process may act by exacerbating competition for a finite food supply (the eggs of demersal-spawning
fishes); but could also be mediated by higher rates of pathogen transfer at increased population densities, or if
predators are attracted to sites of high prey availability. Our data do not allow us to distinguish among these
alternatives; all we can say is that juvenile snakes appear to be disproportionately disadvantaged by increased
population density.
Annual variation in snake density and in traits such as body condition and reproductive output was also
linked to weather conditions in the year preceding our sampling. Wind speeds are lower during winter than in
summer (means of 4.56 vs. 5.58 m/s), creating calm-water conditions that facilitate feeding because snakes can
move about more easily, and are not thrown against sharp coral by strong currents. Hence, a calmer winter may
allow more time for feeding, resulting in enhanced body condition and reproductive output. In contrast, calm
winters appear to decrease survival rates of juveniles. This effect may occur through rendering the snakes more
visible to potential predators. Smaller snakes may be more at risk, because they are slower than adults25 and are
ingestible by a wider range of gape-limited predators26. In terrestrial snakes, predators sometimes target smaller
individuals27. Consistent with the hypothesis that small body size increases the vulnerability of a sea snake, the
offspring of most marine snakes are larger than those of terrestrial snakes because (a) offspring size increases
with mean adult body size, and adult sea snakes are larger than most terrestrial s pecies28; and (b) the offspring
of marine snakes are larger relative to adult body size29.
Although thermal factors have often been implicated as critical determinants of viability for terrestrial
snakes12,27, temperatures are buffered by the ocean at our study sites, and vary less from one year to the next than
between winter and summer in any given year (annual means 27°C in summer; 23°C in winter; also s ee30). Our
preliminary analyses revealed no significant effects of annual thermal variation on snake population densities or
other parameters. Although individuals of some species of hydrophiine snakes bask on the surface of the o cean31,
we have never seen this behaviour in turtle-headed sea snakes; instead, these snakes broach the water surface
only briefly when they come up to breathe, swimming down rapidly as soon as they obtain a lungful of air (R.
Shine, pers. obs.). That behaviour is consistent with the threat of aerial predation, rather than with behavioural
thermoregulation. Snakes tended to be thinner after a winter with unusually heavy rainfall, perhaps reflecting
reduced foraging opportunities or reduced breeding by fishes.
The link between weather conditions and reproductive rate accords with the hypothesis that, unlike most
snakes, Emydocephalus are “income breeders” rather than “capital breeders”32. Masunaga et al.33 proposed this
idea based on dissections of the congeneric species E. ijimae, in which most adult females begin vitellogenesis
every year, but few eventually ovulate. That is, follicular atresia is common, as expected if females begin with an
“optimistic” forecast of the amount of energy they can gather prior to ovulation but abort the development of
some of those follicles if food intake falls below the level needed to sustain a large l itter33. Our data accord well
with this scenario, with a female’s “decision” to reproduce, as well as her litter size, influenced by wind strengths
over the preceding winter (a primary feeding season for female turtle-headed sea s nakes34).
The significant density-dependence of population densities in turtle-headed sea snakes predicts that this
species should exhibit “K-selected” life-history traits such as delayed maturation, infrequent reproduction and
low fecundity6,35. That prediction is supported by the biennial reproductive cycle and small litter size of snakes
in our study area, but at first sight is inconsistent with relatively early maturation (at two to three years of a ge36).
However, the large size at birth for turtle-headed sea snakes (around 300 mm snout-vent length [SVL]) relative
to the size at maturation (500 mm S VL36) means that ages to sexual maturity cannot be directly compared with
those of terrestrial snakes that produce much smaller o ffspring29. That is, sea snakes need to grow less between
birth and maturation than do terrestrial snakes; and hence, similar ages at maturation in the two groups36 imply
a slower growth rate in juvenile sea snakes than in their terrestrial counterparts. Overall, then, our data conform
to the scenario of a “K-selected” species whose abundance is regulated at least partly by density-dependence.
Our study provides the first long-term dataset on population fluctuations in hydrophiine snakes, so we can-
not compare the dynamics of our turtle-headed sea snake populations with those of other species. Worryingly,
however, sea snakes have been reported to exhibit population declines in some areas, even on protected reefs,
in some cases leading to local extinctions (with ambiguous c ausation37,38). Given the substantial diversity in
life-history traits among hydrophiine species29,36,39, population dynamics of sea snakes are likely to be equally
diverse, and generalisations therefore elusive. We urgently need research on long-term population dynamics
of other species of sea snakes, perhaps using cost-effective methods such as video-camera s tations40. Until we
understand the factors that drive annual variation in the abundance of these marine predators, we will struggle
to understand the factors that are driving those widespread declines.
Methods
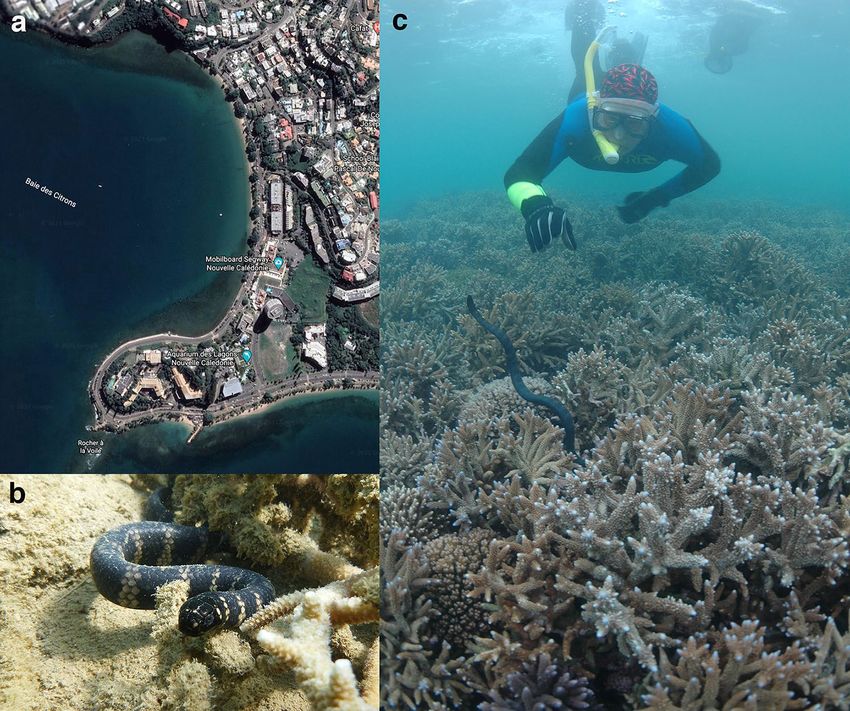
Study site and species. Anse Vata and the Baie des Citrons (22° 16′ S, 166° 26′ E) are adjacent shallow bays
beside Noumea, capital city of the Pacific archipelago of New Caledonia (Fig. 3a). Sea snakes are found primarily
in coral-reef habitats at either end of each bay, which are separated by sandy substrate41. Thus, the turtle-headed
sea snakes that we studied in this area form three discrete populations (north end of Anse Vata, north and south
ends of Baie des Citrons). These snakes are so highly philopatric that interchange of individuals among the three
populations is very rare (despite their proximity: < 1.5 km apart) based on phenotypic t raits42 and genetic data24.
The three study areas that we survey for snakes are each 350 X 20 m in size, extending from the shoreline to
about 4 m water depth, over a substrate dominated by live and dead coral, sand, and b oulders43. Tidal range is
43
1.5 m . Water temperatures average around 27 °C in midsummer (February) and 23 °C in midwinter (August:
https://www.seatemperature.org/australia-pacifi c/new-caledonia/noumea.htm). Headlands block the often-
strong winds, generating relatively calm conditions especially in winter (see below). However, shifts in wind
Scientific Reports | (2021) 11:20701 | https://doi.org/10.1038/s41598-021-00245-2 4
Vol:.(1234567890)www.nature.com/scientificreports/
Figure 3. Photographs of (a) the study areas in which we conducted mark-recapture studies on sea snakes; (b) a
turtle-headed sea snake, Emydocephalus annulatus; (c) capturing a snake during annual surveys. Photographs by
Google Earth (a), Claire Goiran (b), and Pierre Larue (c). Map data: Google Earth 2019.
direction and increases in wind speed sporadically produce much rougher conditions; and over the course of
our study the sites have intermittently been hit by cyclones and affected by coral bleaching43.
Turtle-headed sea snakes (Emydocephalus annulatus) belong to the aipysurine lineage of the hydrophiine
elapids (“true sea snakes”) and are entirely aquatic. They are relatively short, heavy-bodied snakes (to 800 mm
SVL, 480 g; see Fig. 3b) that feed entirely on the demersal eggs of small fishes (blennies, gobies, damselfish);
snakes obtain those eggs by scraping against the coralline substrate with their enlarged upper labial s cales34.
Consistent with that diet, the venom glands have atrophied and the venom is weak44. Both sexes mature at
around 500 mm SVL at two to three years of age, and adult females produce a litter of one to three (usually, two)
large (300 mm SVL) offspring on an approximately biennial s chedule36. Annual survival rates are around 70%,
but some individuals live for more than a decade36. Mating occurs in winter, and females are gravid from early
ay36. Males rarely feed during the mating season (in winter) whereas females
to late summer, giving birth in M
cease feeding when they are heavily distended by developing embryos (in s ummer34). Known predators of sea
snakes include large fishes (especially sharks) and seabirds (especially sea eagles)45–49.
Methods. Every January from 2004 to 2021, we snorkelled through the three study areas to find and capture
snakes. Each site was surveyed at least six times per year, over a 2-week period, for 30–60 min each time, by
3–12 divers (Fig. 3c; see36 for details). Captured snakes were returned to a nearby laboratory to be measured,
weighed and microchipped for individual identification, and then released at the site of capture < 60 min later.
Gravid females are easily recognisable by their distended midbodies, and oviductal embryos can be palpated and
counted by careful pressure on the snake’s abdomen. Captured snakes were marked by a scale-clip recognisable
in the field, allowing us to collect only unmarked snakes on subsequent dives (i.e., each snake was only caught
once per year, and our counts do not include multiple records of the same individual within a given year).
The present analysis is based on a total of 2818 capture records over the period 2004–2021 (mean = 156.6
per year, range 101–231). For the first several years we worked only at Anse Vata and the southern end of Baie
des Citrons, but we began microchipping snakes at the third site (north end of Baie des Citrons) in 2016. Thus,
we have 18 years of data for two sites, but only 6 years of data for the third. All of our statistical analyses (except
those for differences among sites) include site as a random factor, to avoid pseudoreplication.
Independent variables. Jolly-Seber estimates of population sizes for each site in each year were calcu-
lated using the POPAN implementation in the MARK software package50. Goodness-of-fit tests indicated that
the mark-recapture data from each site were appropriate for analysis using Cormack–Jolly–Seber models (all
Scientific Reports | (2021) 11:20701 | https://doi.org/10.1038/s41598-021-00245-2 5
Vol.:(0123456789)www.nature.com/scientificreports/
Site Model AICc ΔAICc Parameters Deviance − 2 log likelihood
Phi(t) p(t) pent(t) 2593.95 0.00 53 − 2706.37 2482.79
AV Phi(t) p(·) pent(t) 2616.82 22.87 36 − 2646.71 2542.45
Phi(·) p(·) pent(t) 2639.46 45.52 20 − 2590.44 2598.73
Phi(t) p(t) pent(t) 2175.97 0.00 53 − 1889.63 2063.74
BCS Phi(t) p(·) pent(t) 2177.92 1.96 36 − 1850.29 2103.08
Phi(·) p(t) pent(t) 2211.82 35.85 37 − 1818.56 2134.81
Phi(·) p(·) pent(t) 751.10 0.00 8 − 568.50 734.75
BCN Phi(t) p(·) pent(t) 758.58 7.48 12 − 569.44 733.80
Phi(t) p(t) pent(t) 765.37 14.27 17 − 573.42 729.82
Table 2. Rankings of the top three mark-recapture models for each study site. For each site a set of models was
constructed in which the three parameters (survival (phi), recapture (p) and entry (pent)) were held constant
over time (·) or allowed to vary over time (t). Abundance estimates were obtained from the top-ranked model
for each site. At both Anse Vata (AV) and the Baie des Citrons south (BCS) the top-ranked model was one in
which all three parameters varied over time (Phi(t) p(t) pent(t)). At the Baie des Citrons north (BCN) = the
best model was one in which survival and recapture were constant over time but entry varied annually (Phi(·)
p(·) pent (t).
P > 0.06). For each site we constructed a set of candidate models in which parameters for survival (phi), recapture
(p) and recruitment (pent) were allowed to vary among years (t) or to remain constant (·). We then selected the
best model for each site based on corrected Akaike Information Criteria (AICc) values. At both Anse Vata and
Baie des Citrons south the top-ranked model was fully time-dependant (Phi(t) p(t) pent (t); Table 2). At Baie
des Citrons north the top model was one in which survival and recapture rates were both constant over time but
with time-dependent recruitment (Phi(·) p(·) pent(t); Table 2). Annual estimates of population density for each
site were derived from the top-ranked model. Parameter estimates for population sizes, survival, recapture, and
recruitment at each site can be found in Supplementary Materials (Appendices 1 and 2).
To quantify abiotic conditions that might affect snake populations, we first divided the year into summer
(October to April, encompassing vitellogenesis and pregnancy) and winter (May to September, the mating season
and the first few months of life for neonates36). Abiotic factors were calculated separately for each of these seasons,
because of the biological differences between them. For example, recruitment might be especially sensitive to
weather-driven constraints on feeding or survival during winter (when females feed but males do not; and when
neonates are small)34,36. A priori, we predicted that the two most important weather variables for snakes would
be rainfall (access to freshwater enhances snake body c ondition51) and wind speed (stronger winds create rough
sea conditions, constraining shallow-water foraging but hiding snakes from aerial and aquatic predators). We
extracted mean monthly values for these variables from the Météo-France climate database for Noumea (http://
www.m eteo.n c/d
onnee s-p
ubliq
ues/p
ublit heque) and calculated seasonal means from these mean monthly values.
With these indices, we can ask whether the direction and degree of change in population density from one year
to the next is related to the number of snakes initially present, and/or to weather conditions experienced in the
year prior to our January sampling.
Dependent variables.
(1) Annual change in population density. Quantified by dividing the estimated number in one year by that in
the preceding year (Jolly–Seber estimate for Year N divided by that for Year [N − 1]), and calculating the
difference between that number and 1.0 (i.e., magnitude of proportional change). To eliminate bias due to
proportional data being asymmetric (bounded within the range 0–1 for numbers < 1.0, but able to range
from 1 to infinity for numbers above 1), we repeated the analysis with numerator and denominator reversed,
to obtain symmetric deviation scores. We then arbitrarily defined all cases of decreases as negative, and all
cases of increases as positive52. Negative scores reflect decreases in population density, and positive scores
show increases; and in both cases, are bounded within the same range (0–1).
(2) Age structure. Quantified as the proportion of captured snakes that were adults (> 500 mm SVL), and ln-
transformed (ln [1 + X]) to improve normality.
(3) Body condition of snakes. Quantified by taking residual scores from the general linear regression of ln body
mass against ln snout-vent length. Positive scores represent snakes that were heavier-than-expected based
on their body length; our analyses used means per population per year.
(4) Reproductive frequency. Quantified as the proportion of adult-sized female snakes (> 500 mm SVL) that
were gravid when palpated; our analyses used means per population per year.
(5) Litter size. Determined by abdominal palpation of females; our analyses used means per population per
year.
Analyses. There has been considerable debate about methods for detecting density-dependence from time-
series data on animal a bundances2,4,53. We used the procedure and code developed by Dennis and P
onciano21, to
look for density-dependence in the two long-term datasets (i.e., for Anse Vata and for Baie des Citrons south).
Scientific Reports | (2021) 11:20701 | https://doi.org/10.1038/s41598-021-00245-2 6
Vol:.(1234567890)www.nature.com/scientificreports/
The procedure compares the goodness of fit of two state-space models fitted to time-series abundance data. The
Exponential Growth state-space analysis models time-series as a density-independent process and the Ornstein-
Uhlembeck state-space analysis models time-series as density-dependent. A parametric bootstrap likelihood
ratio test (based on 1000 bootstrap replicates) is then performed to compare the fits of the density-dependent
vs. density-independent models4. These analyses were performed in R 4.0.2 using the codes provided as Sup-
plemental Material in Dennis and Ponciano21.
We also used a simpler method that allows us to combine data for all three sites, and to compare the effects of
density-dependent and stochastic factors within the same analysis. To do so, we conducted linear mixed-model
multiple regressions in JMP 15.0. Site (N = 3: Anse Vata, Baie des Citrons north and south) was included as a
random factor in all analyses, to account for pseudoreplication (see Table 1). To compare population densities
(as estimated by MARK analyses) among sites, we used annual estimates as replicates and conducted an ANOVA
with site as a fixed rather than random factor. To look for temporal correlation in the magnitude of annual
changes in population densities between the two sites with long-term data, we compared estimated numbers
per year for Anse Vata versus Baie des Citrons south. To look for influences on the proportional change in
estimated population densities of snakes from one year to the next, we used this parameter as the dependent
variable, with the independent variables being population density in the previous year, and mean wind speeds
and mean temperatures for summer and winter during the year prior to the survey. To examine the impacts of
these same independent variables on traits relevant to recruitment (energy balance and reproductive rate), we
repeated the analyses with dependent variables being mean body condition (residual score), proportion of gravid
adult females, and mean litter size.
To examine shifts in age structure compared to population change, we used proportion of snakes that were
adult in Year [N + 1] as the independent variable, and the proportional change in population density as the
dependent variable (i.e., were juvenile snakes under-represented after years in which populations declined?).
To clarify effects on age structure, we used proportion of adult snakes as the dependent variable in an ANOVA,
with independent variables of population density in the previous year, and wind speeds and rainfall in summer
and winter. To evaluate whether reproductive output in one year predicted age structure in the following year,
we compared these two variables using correlation analysis.
Ethical approval. The research was conducted under animal ethics approval 2015/880 (University of Syd-
ney) and permit 3252-17/ARR/DENV (Province Sud, New Caledonia). All procedures involving animals were
carried out in accordance with relevant guidelines and regulations (including ARRIVE guidelines).
The person appearing in the photograph in Fig. 3c has given informed consent to publication of their image
in this open-access publication.
Data availability
Data is available from the Dryad Digital Repository at https://doi.org/10.5061/dryad.qbzkh18hx.
Received: 27 June 2021; Accepted: 8 October 2021
References
1. Krebs, C. J. Two paradigms of population regulation. Wildl. Res. 22, 1–10 (1995).
2. McLaren, I. A. Natural Regulation of Animal Populations (Routledge, 2017).
3. Deffner, D. & McElreath, R. The importance of life history and population regulation for the evolution of social learning. Philos.
Trans. R. Soc. B 375, 20190492 (2020).
4. Leão, S. M., Pianka, E. R. & Pelegrin, N. Is there evidence for population regulation in amphibians and reptiles? J. Herpetol. 52,
28–33 (2018).
5. Hanski, I. A. Density dependence, regulation and variability in animal populations. Philos. Trans. R. Soc. B 330, 141–150 (1990).
6. Reznick, D., Bryant, M. J. & Bashey, F. r-and K-selection revisited: The role of population regulation in life-history evolution.
Ecology 83, 1509–1520 (2002).
7. Stenseth, N. C., Falck, W., Bjørnstad, O. N. & Krebs, C. J. Population regulation in snowshoe hare and Canadian lynx: Asymmetric
food web configurations between hare and lynx. Proc. Natl Acad. Sci. USA 94, 5147–5152 (1997).
8. Lande, R. et al. Estimating density dependence from population time series using demographic theory and life-history data. Am.
Nat. 159, 321–337 (2002).
9. Ferguson, G. W., Bohlen, C. H. & Woolley, H. P. Sceloporus undulatus: Comparative life history and regulation of a Kansas popula-
tion. Ecology 61, 313–322 (1980).
10. Andrews, R. M. Population stability of a tropical lizard. Ecology 72, 1204–1217 (1991).
11. Tinkle, D. W., Dunham, A. E. & Congdon, J. D. Life history and demographic variation in the lizard Sceloporus graciosus: A long-
term study. Ecology 74, 2413–2429 (1993).
12. Altwegg, R., Dummermuth, S., Anholt, B. R. & Flatt, T. Winter weather affects asp viper Vipera aspis population dynamics through
susceptible juveniles. Oikos 110, 55–66 (2005).
13. Madsen, T. & Shine, R. Rain, fish and snakes: Climatically driven population dynamics of Arafura filesnakes in tropical Australia.
Oecologia 124, 208–215 (2000).
14. Madsen, T., Ujvari, B., Shine, R. & Olsson, M. Rain, rats and pythons: Climate-driven population dynamics of predators and prey
in tropical Australia. Austral Ecol. 31, 30–37 (2006).
15. Brown, G. P. & Shine, R. Rain, prey and predators: Climatically driven shifts in frog abundance modify reproductive allometry in
a tropical snake. Oecologia 154, 361–368 (2007).
16. Brown, G. P., Ujvari, B., Madsen, T. & Shine, R. Invader impact clarifies the roles of top-down and bottom-up effects on tropical
snake populations. Funct. Ecol. 27, 351–361 (2013).
17. Massot, M., Clobert, J., Pilorge, T., Lecomte, J. & Barbault, R. Density dependence in the common lizard: Demographic conse-
quences of a density manipulation. Ecology 73, 1742–1756 (1992).
18. Fordham, D. A., Georges, A. & Brook, B. W. Experimental evidence for density-dependent responses to mortality of snake-necked
turtles. Oecologia 159, 271–281 (2009).
Scientific Reports | (2021) 11:20701 | https://doi.org/10.1038/s41598-021-00245-2 7
Vol.:(0123456789)www.nature.com/scientificreports/
19. Burns, G. & Heatwole, H. Home range and habitat use of the olive sea snake, Aipysurus laevis, on the Great Barrier Reef, Australia.
J. Herpetol. 32, 350–358 (1998).
20. Ward, T. M. Age structures and reproductive patterns of two species of sea snake, Lapemis hardwickii Grey (1836) and Hydrophis
elegans (Grey 1842), incidentally captured by prawn trawlers in northern Australia. Mar. Freshw. Res. 52, 193–203 (2001).
21. Dennis, B. & Ponciano, J. M. Density-dependent state-space model for population-abundance data with unequal time intervals.
Ecology 95, 2069–2076 (2014).
22. Bonnet, X., Naulleau, G. & Shine, R. The dangers of leaving home: Dispersal and mortality in snakes. Biol. Conserv. 89, 39–50
(1999).
23. Yacelga, M., Cayot, L. J. & Jaramillo, A. Dispersal of neonatal Galápagos marine iguanas Amblyrhynchus cristatus from their nesting
zone: Natural history and conservation implications. Herpetol. Conserv. Biol. 7, 470–480 (2012).
24. Lukoschek, V. & Shine, R. Sea snakes rarely venture far from home. Ecol. Evol. 2, 1113–1121 (2012).
25. Shine, R., Cogger, H. G., Reed, R. R., Shetty, S. & Bonnet, X. Aquatic and terrestrial locomotor speeds of amphibious sea-snakes
(Serpentes, Laticaudidae). J. Zool. 259, 261–268 (2003).
26. Forsman, A. Body size and net energy gain in gape-limited predators: A model. J. Herpetol. 30, 307–319 (1996).
27. Shine, R., LeMaster, M. P., Moore, I. T., Olsson, M. M. & Mason, R. T. Bumpus in the snake den: Effects of sex, size and body
condition on mortality in red-sided garter snakes. Evolution 55, 598–604 (2001).
28. Sherratt, E., Rasmussen, A. R. & Sanders, K. L. Trophic specialization drives morphological evolution in sea snakes. R. Soc. Open
Sci. 5, 172141 (2018).
29. Lemen, C. A. & Voris, H. K. A comparison of reproductive strategies among marine snakes. J. Anim. Ecol. 50, 89–101 (1981).
30. Shine, R., Shine, T. & Shine, B. Intraspecific habitat partitioning by the sea snake Emydocephalus annulatus (Serpentes, Hydrophii-
dae): The effects of sex, body size, and colour pattern. Biol. J. Linn. Soc. 80, 1–10 (2003).
31. Heatwole, H., Grech, A., Monahan, J. F., King, S. & Marsh, H. Thermal biology of sea snakes and sea kraits. Integr. Comp. Biol. 52,
257–273 (2012).
32. Van Dyke, J. U., Beaupre, S. J. & Kreider, D. L. Snakes allocate amino acids acquired during vitellogenesis to offspring: Are capital
and income breeding consequences of variable foraging success? Biol. J. Linn. Soc. 106, 390–404 (2012).
33. Masunaga, G., Matsuura, R., Yoshino, T. & Ota, H. Reproductive biology of the viviparous sea snake Emydocephalus ijimae (Reptilia:
Elapidae: Hydrophiinae) under a seasonal environment in the Northern Hemisphere. Herpetol. J. 13, 113–119 (2003).
34. Goiran, C., Dubey, S. & Shine, R. Effects of season, sex and body size on the feeding ecology of turtle-headed sea snakes (Emydo-
cephalus annulatus) on IndoPacific inshore coral reefs. Coral Reefs 32, 527–538 (2013).
35. Phillips, B. L. The evolution of growth rates on an expanding range edge. Biol. Lett. 5, 802–804 (2009).
36. Shine, R., Shine, T. G., Brown, G. P. & Goiran, C. Life history traits of the sea snake Emydocephalus annulatus, based on a 17-yr
study. Coral Reefs 39, 1407–1414 (2020).
37. Goiran, C. & Shine, R. Decline in sea snake abundance on a protected coral reef system in the New Caledonian Lagoon. Coral
Reefs 32, 281–284 (2013).
38. Somaweera, R. et al. Pinpointing drivers of extirpation in sea snakes: A synthesis of evidence from Ashmore Reef. Front. Mar. Sci.
8, 658756 (2021).
39. Udyawer, V. et al. Future directions in the research and management of marine snakes. Front. Mar. Sci. 5, 399 (2018).
40. Udyawer, V., Cappo, M., Simpfendorfer, C. A., Heupel, M. R. & Lukoschek, V. Distribution of sea snakes in the Great Barrier Reef
Marine Park: Observations from 10 yrs of baited remote underwater video station (BRUVS) sampling. Coral Reefs 33, 777–791
(2014).
41. Udyawer, V., Goiran, C. & Shine, R. Peaceful coexistence between people and deadly wildlife: Why are recreational users of the
ocean so rarely bitten by sea snakes? People Nat. 3, 335–346 (2021).
42. Shine, R., Goiran, C., Shine, T., Fauvel, T. & Brischoux, F. Phenotypic divergence between seasnake (Emydocephalus annulatus)
populations from adjacent bays of the New Caledonian Lagoon. Biol. J. Linn. Soc. 107, 824–832 (2012).
43. Goiran, C., Brown, G. P. & Shine, R. Niche partitioning within a population of sea snakes is constrained by ambient thermal
homogeneity and small prey size. Biol. J. Linn. Soc. 129, 644–651 (2020).
44. Li, M., Fry, B. G. & Kini, R. M. Eggs-only diet: Its implications for the toxin profile changes and ecology of the marbled sea snake
(Aipysurus eydouxii). J. Mol. Evol. 60, 81–89 (2005).
45. Heatwole, H. Predation on sea snakes. In The Biology of Sea Snakes (ed. Dunson, W. A.) 233–250 (University Park Press, 1975).
46. Rancurel, P. & Intes, A. L. requin tigre, Galeocerdo cuvieri Lacepede, des eaux neocaledoniennes examen des contenus stomacaux.
Tethys 10, 195–199 (1982).
47. Ineich, I. & Laboute, P. Les Serpents Marins de Nouvelle-Calédonie (IRD éditions, 2002).
48. Masunaga, G., Kosuge, T., Asai, N. & Ota, H. Shark predation of sea snakes (Reptilia: Elapidae) in the shallow waters around the
Yaeyama Islands of the southern Ryukyus, Japan. Mar. Biodivers. Rec. 1, e96 (2008).
49. Wirsing, A. J. & Heithaus, M. R. Olive-headed sea snakes Disteria major shift seagrass microhabitats to avoid shark predation.
Mar. Ecol. Progr. Ser. 387, 287–293 (2009).
50. White, G. C. & Burnham, K. P. Program MARK: Survival estimation from populations of marked animals. Bird Study 46, S120–S139
(1999).
51. Brischoux, F., Rolland, V., Bonnet, X., Caillaud, M. & Shine, R. Effects of oceanic salinity on body condition in sea snakes. Integr.
Comp. Biol. 52, 235–244 (2012).
52. Lovich, J. E. & Gibbons, J. W. A review of techniques for quantifying sexual size dimorphism. Growth Dev. Aging 56, 269–269
(1992).
53. Dennis, B., Ponciano, J. M., Lele, S. R., Taper, M. L. & Staples, D. F. Estimating density dependence, process noise, and observation
error. Ecol. Monogr. 76, 323–341 (2006).
Acknowledgements
We thank Météo-France in New Caledonia for providing the climate data. The work was funded by the Austral-
ian Research Council.
Author contributions
R.S. and C.G. gathered the data; R.S. and G.P.B. conducted statistical analyses; R.S. drafted the manuscript, with
input from C.G. and G.P.B.
Competing interests
The authors declare no competing interests.
Scientific Reports | (2021) 11:20701 | https://doi.org/10.1038/s41598-021-00245-2 8
Vol:.(1234567890)www.nature.com/scientificreports/
Additional information
Supplementary Information The online version contains supplementary material available at https://doi.org/
10.1038/s41598-021-00245-2.
Correspondence and requests for materials should be addressed to R.S.
Reprints and permissions information is available at www.nature.com/reprints.
Publisher’s note Springer Nature remains neutral with regard to jurisdictional claims in published maps and
institutional affiliations.
Open Access This article is licensed under a Creative Commons Attribution 4.0 International
License, which permits use, sharing, adaptation, distribution and reproduction in any medium or
format, as long as you give appropriate credit to the original author(s) and the source, provide a link to the
Creative Commons licence, and indicate if changes were made. The images or other third party material in this
article are included in the article’s Creative Commons licence, unless indicated otherwise in a credit line to the
material. If material is not included in the article’s Creative Commons licence and your intended use is not
permitted by statutory regulation or exceeds the permitted use, you will need to obtain permission directly from
the copyright holder. To view a copy of this licence, visit http://creativecommons.org/licenses/by/4.0/.
© The Author(s) 2021
Scientific Reports | (2021) 11:20701 | https://doi.org/10.1038/s41598-021-00245-2 9
Vol.:(0123456789)You can also read