NOIRE study report : towards a low frequency radio interferometer in space
←
→
Page content transcription
If your browser does not render page correctly, please read the page content below
NOIRE study report : towards a low frequency radio
interferometer in space
Citation for published version (APA):
Cecconi, B., & Bentum, M. J. (2018). NOIRE study report : towards a low frequency radio interferometer in
space. In EGU General Assembly 2018 [EGU2018-3648] EGU: European Geosciences Union.

Document status and date:
Published: 08/04/2018

Document Version:
Accepted manuscript including changes made at the peer-review stage

Please check the document version of this publication:
• A submitted manuscript is the version of the article upon submission and before peer-review. There can be
important differences between the submitted version and the official published version of record. People
interested in the research are advised to contact the author for the final version of the publication, or visit the
DOI to the publisher's website.
• The final author version and the galley proof are versions of the publication after peer review.
• The final published version features the final layout of the paper including the volume, issue and page
numbers.
Link to publication

General rights
Copyright and moral rights for the publications made accessible in the public portal are retained by the authors and/or other copyright owners
and it is a condition of accessing publications that users recognise and abide by the legal requirements associated with these rights.

       • Users may download and print one copy of any publication from the public portal for the purpose of private study or research.
       • You may not further distribute the material or use it for any profit-making activity or commercial gain
       • You may freely distribute the URL identifying the publication in the public portal.

If the publication is distributed under the terms of Article 25fa of the Dutch Copyright Act, indicated by the “Taverne” license above, please
follow below link for the End User Agreement:
www.tue.nl/taverne

Take down policy
If you believe that this document breaches copyright please contact us at:
openaccess@tue.nl
providing details and we will investigate your claim.

Download date: 10. Apr. 2021
NOIRE Study Report: Towards a Low Frequency Radio
                                                            Interferometer in Space
                                                                      Baptiste Cecconi, Moustapha Dekkali, Carine Briand, Boris Segret
                                                LESIA, Observatoire de Paris, PSL, CNRS, Sorbonne Universités, UPMC, Univ. Paris Diderot, Sorbonne Paris Cité
                                                                                                Meudon, France
                                                                                +33 1 45 07 77 59 — baptiste.cecconi@obspm.fr
                                                                                                     Julien N. G. Girard
                                                                                       CEA/AIM, Univ. Paris Diderot, Sorbonne Paris Cité
                                                                                                       Saclay, France
                                                                                                    julien.girard@cea.fr
arXiv:1710.10245v1 [astro-ph.IM] 27 Oct 2017

                                                   André Laurens, Alain Lamy, David Valat, Michel Delpech,                                       Martin Bucher
                                                                Mickael Bruno, Patrick Gélard                                     APC, Univ. Paris Diderot, Sorbonne Paris Cité
                                                                   CNES, Toulouse, France                                                          Paris, France
                                                          +33 5 61 27 46 42 — andre.laurens@cnes.fr
                                                                                                              Quentin Nenon
                                                                                                                 ONERA
                                                                                                             Toulouse, France
                                                                                             Jean-Mathias Grießmeier
                                                                                       LPC2E, Université d’Orléans, CNRS
                                                           Station de Radioastronomie de Nançay, Observatoire de Paris, PSL, CNRS, Univ. Orléans, OSUC
                                                                                                  Orléans, France
                                                                               Albert-Jan Boonstra                                  Mark Bentum
                                                                                     ASTRON                                 Eindhoven Technical University,
                                                                             Dwingeloo, the Netherlands                       Eindhoven, the Netherlands

                                               Abstract—Ground based low frequency radio interferometers                                      1. I NTRODUCTION
                                               have been developed in the last decade and are providing the sci-
                                               entific community with high quality observations. Conversely,                Radioastronomy is a young astrophysical science. The first
                                               current radioastronomy instruments in space have a poor angu-                detection of extraterrestrial radio emission occurred in 1932
                                               lar resolution with single point observation systems. Improving              [1]. Despite such short history, radio observatories are now
                                               the observation capabilities of the low frequency range (a few               coming to a golden age, which is enabling new types of
                                               kHz to 100 MHz) requires to go to space and to set up a space                observations down to very low frequencies. Table 1 presents
                                               based network of antenna that can be used as an interferometer.              a selection of a few milestone and shows the evolution of
                                                                                                                            the complexity and type of radio telescope: ground based
                                               We present the outcome of the NOIRE (Nanosatellites pour                     telescopes have been gaining angular resolution by using
                                               un Observatoire Interférométrique Radio dans l’Espace /                    array of antenna (either phased arrays, like UTR-2 or NDA, or
                                               Nanosatellites for a Radio Interferometer Observatory in Space)
                                                                                                                            interferometers, like LOFAR), whereas space observatories
                                               study which assessed, with help of CNES’ PASO2 , the feasibility             are still in the single antenna era. Space systems are required
                                               of a swarm of nanosatellites dedicated to a low frequency radio
                                               observatory. With such a platform, space system engineer-                    for observations below the ionospheric cut-off at ∼ 10 MHz.
                                               ing and instrument development must be studied as a whole:                   However, building instruments with angular resolution at
                                               each node is a sensor and all sensors must be used together                  those frequencies has long been impossible to implement,
                                               to obtain a measurement. The study was conducted on the                      due to the required aperture size (the angular resolution of
                                               following topics: system principle and concept (swarm, node                  a telescope is ∼ λ/D with λ the observed wavelength and D
                                               homogeneity); Space and time management (ranging, clock                      the aperture size). Other techniques have been used to recover
                                               synchronization); Orbitography (Moon orbit, Lagrange point                   angular resolution with simple antennas, such as goniopo-
                                               options); Telecommunication (between nodes and with ground)                  larimetric techniques [2], [3]. With strong assumptions on
                                               and networking; Measurements and processing; Propulsion;                     the incoming wave (single point source at infinity), direction-
                                               Power; Electromagnetic compatibility.
                                                                                                                            finding and polarization with accuracy up to ∼ 1◦ and 10%
                                               No strong show-stopper was identified during the preliminary                 are reachable respectively with intense signals. The Cassini
                                               study, although the concept is not yet ready. Several further                and STEREO missions are using these techniques and the
                                               studies and milestones are identified. The NOIRE team will                   research teams have published many results including radio
                                               collaborate with international teams to try and build this next              source characterization (such as a posteriori radio source
                                               generation of space systems.                                                 mapping). However, real imaging capabilities is still out of
                                                                                                                            reach of current space radio instruments.
                                                                                                                            During the last decade, several concept studies and projects
                                                                                                                            (see Table 2) have been drafted with the aim of building a
                                               978-1-5386-2014-4/18/$31.00 c 2018 IEEE                                      radio interferometer in space, and thus allows sky imaging
                                               2 PASO   - Architecture Platform for Orbital Systems - is CNES’ cross-       down to a few kHz. The NOIRE study presented here is
                                               disciplinary team in charge of early mission and concept studies

                                                                                                                        1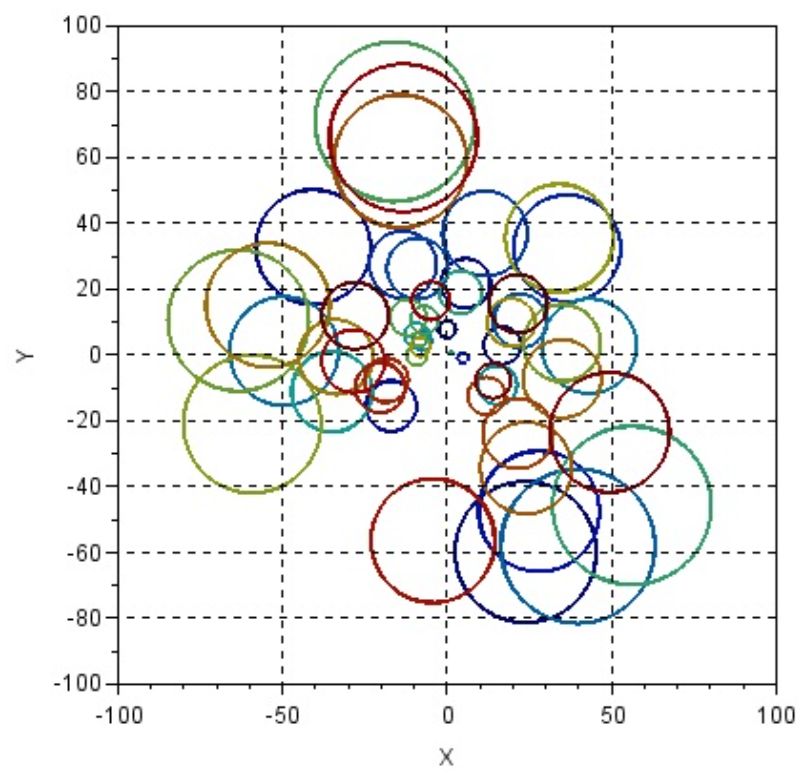
part is this international effort to increase our knowledge, to        Earth and Jupiter radiation belts [26].
identify and improve the technologies that will lead us to a           • Planetary Atmospheres — Lightning induced radio pulses
future low frequency radio observatory in space. The NOIRE             at Earth, Saturn, Uranus and Neptune [27], [28], [29].
study was initiated after regular discussions and contacts             • Exoplanets — Exoplanetary auroral radio emissions [20]
with the Dutch team at the origin of several studies and
projects: OLFAR (Orbiting Low Frequency Array), DARIS
(Distributed Aperture Array for Radio Astronomy in Space),
DEx (Dark Ages Explorer), SURO (Space based Ultra long                 Detailed science objectives
wavelength Radio Observatory), DSL (Discovering the Sky                Two science objectives are discussed here: the Dark Ages and
at the Longest Wavelengths) [4], [5], [6].                             Planetary radio emissions.
Once out of the ionosphere, observations of the sky is                 The dark ages—The so-called Dark Ages signals are fossil
possible down to the local heliosphere radio wave cut-off              signatures of the very early universe, from the reoinization to
frequency (about 10 kHz). However, the human activity                  the forming of the first stars. This phenomenon is predicted to
is producing a radio noise (Radio Frequency Interferences,             appear as spectral fluctuations between 5 and 80 MHz. Figure
RFI), that pollutes the spectral range down to a few hundred           1 is showing a simulation of this signature. Its amplitude is
kHz. Observations by RAE-B (Radio Astronomy Explorer-                  a few 10 mK as compared to the sky brightness temperature
B) [7] or more recently with the Kaguya/LRS (Lunar Radar
Sounder) [8] shows that the closest place near Earth free of           that can be as high as 107 K at very low frequencies.
RFI is the far side of the Moon.
                                                                       The observation of the Dark Ages is thus particularly difficult,
The goal of the NOIRE study is provide an initial assessment           as it is a relative measurement, compared to a basically
of feasibility and reachable performances for a space-based            unknown sky. The only knowledge of the sky is partial at low
radio observatory implemented on an homogeneous low-                   frequencies: some maps exist but are partial, not accurate,
control swarm of spacecraft. Starting from the state of the            and difficult to reuse [13]. The decreasing sky brightness
art of already published studies and concepts, the NOIRE               temperature helps the measurements at higher frequencies.
team has identified a selection of key science objectives              Furthermore the anisotropy of the sky brightness temperature,
(corresponding to the topical expertise of the science team)           is known but not characterized [30].
and conducted a feasibility study with the CNES/PASO team.
The NOIRE team is presented in Appendix A.                             If we assume a 30 mK signal at 30 MHz, with a 5 mK
                                                                       accuracy requirement for a 5σ detection. At this frequency,
                                                                       the sky brightness temperature is about 1000 K. We need
                                                                       a measurement with ∆T /T ≈ 5 × 10⁻⁶ . Assuming a 10
              2. S CIENCE O BJECTIVES                                  MHz spectral integration bandwidth, this would require an
In the low frequency range (namely below 100 MHz), the                 integration time of 4000 seconds. This integration time shall
sky brightness temperature can be as high as 107 K at about            be accumulated with data samples without any variable fore-
1 MHz. Figure 2 is showing the main radio sources and                  ground source. Furthermore, this assumes that the instrument
components observable in space near Earth. As discussed                is perfectly calibrated and that this calibration is constant with
in previous studies [5], [19], [20], [21], [6], many science           time with a noise below the 5 mK accuracy requirement.
objectives are concerned by such instrumentation. We present
here a few of them, focussing on the science expertise of the          Planetary radio emissions—The magnetized planets, which
team:                                                                  are the Earth, Jupiter, Saturn, Uranus and Neptune in our
                                                                       solar system, are emitting intense radio signals resulting from
                                                                       particle accelerations in various places of the planetary envi-
•  Cosmology — Pathfinder measurements of the red-shifted              ronment. The auroral radio emissions are emitted above the
HI line that originates from before the formation of the first         magnetic poles of the planet through a cyclotron instability.
stars (dark ages, recombination) [19];                                 The radiation belts (in the case of the Earth and Jupiter) are
• Astrophysics — Low frequency sky mapping and monitor-                emitting synchrotron emission. The planetary atmospheric
ing: radio galaxies, large scale structures (clusters with ra-         discharges can also be the source of radio pulses associated to
dio halos, cosmological filaments...), including polarization,         lightnings. Figure 2 shows these various components of the
down to a few 100 kHz [13];                                            planetary electromagnetic spectra. Radio emissions can be
• Pulsars — Radio observations at the lowest frequencies               used to remotely characterize accelerated particles on magne-
will allow to test the temporal broadening, which is usually           tized plasma, as well as study the dynamics of the planetary
assumed to vary with f −4 . In this context, it will be possible       magnetic environment, or discharges in atmospheres.
to determine whether there is a low-frequency cut-off for this
broadening relation, which could be indicative of the largest          Except for Jovian radio emissions which are visible from
turbulence scales in the interstellar medium. This will also           ground observatories, most other components occur at too
allow to put constraints on the observation of radio transients        low frequency to be observed from ground. The current
a low frequencies;                                                     radio exploration is done with single point radio observato-
• Inner heliosphere — Low-frequency radio bursts from the              ries (placed on planetary exploration space missions, such
Sun, from 1.5 RS (Solar Radius) to ∼1 AU (Astronomical                 as Cassini, JUNO, JUICE...). Thanks to goniopolarimetric
Unit) [22], [23].                                                      techniques, it is possible to reconstructed “images” after ac-
• Space Weather — Scintillation and Faraday rotation                   cumulating many single observations. However, this process
through the heliospheric plasma [24].                                  is very limited and always assumes a single radio source per
• Planetary Magnetospheres — Auroral emissions from the                observation. The objective is to go from this “direction of
Earth and from the giant planets’ magnetospheres in our solar          arrival” era to direct imaging, as LOFAR allowed to do for the
system: rotation periods, modulations by satellites and Solar          low frequency part of the Jovian radiation belts [26]. With an
Wind, magnetospheric dynamics, seasonal effects... First               observatory located away from Earth, we could build images
opportunity in decades to study Uranus and Neptune [25]                of the Earth radiation belts.
                                                                   2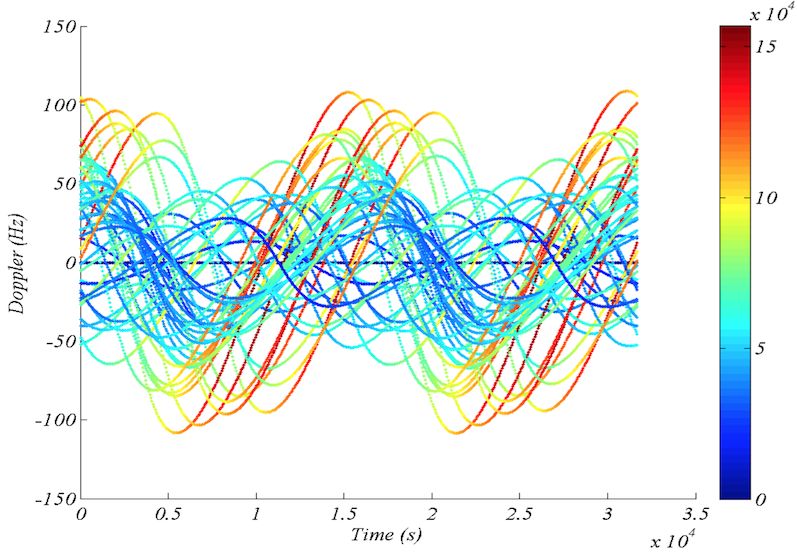
Observatory        Antenna
Date   Milestone                                                       Frequency(MHz)       Ground Space     Single Array
1932   First observation of Galactic radio emission [1]                      20.5             ×                ×
1946   First interferometric radio astronomy measurement [9], [10]            200             ×                ×
1955   Detection of Jovian radio emissions [11]                              22.2             ×                ×
1972   First light of UTR-2 (Kharkov, Ukraine) [12]                         8 − 40            ×                        ×
1973   First map of Galactic background emission (RAE-B) [13]               < 13.1                    ×        ×
1977   First light of NDA (Nançay Decameter Array, France) [14]            8 − 80            ×                        ×
1997   Launch of the Cassini mission (NASA) [15]                             < 16                     ×        ×
2007   Launch of the STEREO mission (NASA) [16]                              < 14                     ×        ×
2012   LOFAR radio telescope in Europe [17]                                10 − 240           ×                        ×
2013   Long Wavelength Array 1 (LWA) [18]                                   10 – 88           ×                        ×
                         Table 1. Ground and space low frequency radio astronomy milestone

   Name               Frequency     Baseline   Nb of S/C       Location                     Team / Country
                      (MHz)         (km)
   SIRA               0.03 – 15     >10        12 – 16         Sun-Earth L1 halo            NASA/GSFC (2004)
   SOLARA/SARA        0.1 – 10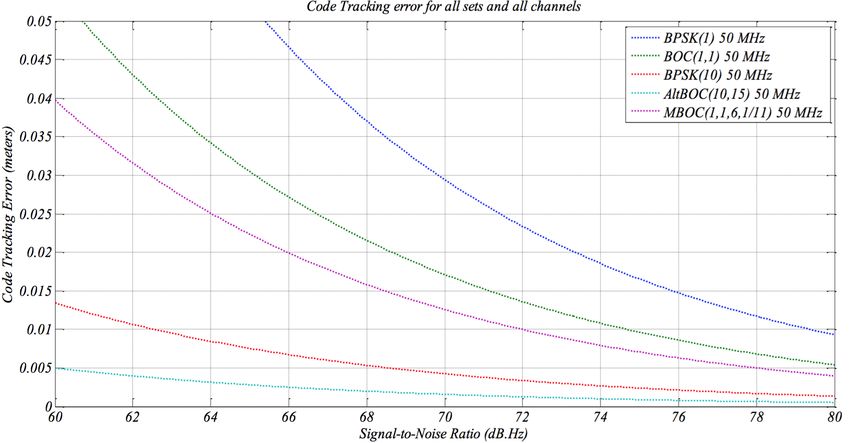
Science requirement analysis                                           Earth, one can ignore this issue if the observed FoV is small
Table 3 lists the high-level science objectives identified by          enough to apply classical 2D small-field approximations.
the NOIRE team and evaluated in this work. On that table,              From space, such DDEs arise naturally by construction and
each high-level science objective is identified by its own             the data processing should include such effects. Hopefully,
S-ID. Each high-level objective is translated into “Science            the mathematical framework of the “Measurement Equation”
Performance Requirement” parameters. For some high-level               (see [34], [35], [36], [37] and references therein) helps to
                                                                       model and implements methods to account for such effects.
science objectives, the team was not able yet to set the science
performance requirements. The result of this preliminary
analysis is presented in Table 4. From this assessment, it             Depending on the observing modes, the study requires to
                                                                       discuss the feasibility of using NOIRE for its various science
is possible to classify the high-level science objective into          cases.
“Measurement Performance Requirements”, as presented in
Table 5. Spectral (M-Fxx), temporal (M-Txx) and polar-                 Individual Measurements—Antenna Electro-magnetic (EM)
ization (M-Pxx) measurement requirements are not binding
for NOIRE, as they can be fulfilled with single spacecraft             simulations in vacuum can accurately represent the radia-
observatory. Signal (M-Sxx) and Spatial (M-Lxx) measure-               tion properties of simple dipoles. However, attached to
ment requirements are used to define the NOIRE platform                a nanosatellite body, the effective measured E       ~ field will
characteristics. The sensitivity is related to the number of                                                              ~
                                                                       corresponds to the projection of the incoming E field onto an
nodes (the effective area of each antenna adds up). The spatial        “effective” antenna which direction depends on the coupling
resolution is directly related to the length of the baselines          of the dipole with the satellite body. The resulting effective
(the lengths of the lines joining each pair of nodes). The             direction is hard to predict without refined EM simulations of
requirements on the platform characteristics will be described         the whole sensor. The precise knowledge of these effective
in the next sections.                                                  directions are vital for the full 3D-polarimetric measure-
                                                                       ments, direction-finding and local measurements. In a swarm
                                                                       of monitored sensors that are all presenting various attitudes
          3. P RINCIPLES AND C ONCEPTS                                 compared to absolute reference directions, we can transform
                                                                       all individual dipole orientation onto a single common refer-
The aim of the NOIRE study is to assess on a system-                   ence frame gathering effective dipole directions, using linear
wide point of view, the feasibility of a novel type of space           transforms. The precise localization and orientation of sen-
instrumentation. The most innovative, disruptive, or even              sors with respect to this common reference frame requires an
unconventional concepts have been preferred in order to face           accurate bootstrapping on main absolute directions (generally
all major challenges and identify the potential hard spots.            provided by star trackers). Due to the symmetry of the sensors
The study has been conducted in order to either adopt the              and that of the sky, there is not such a priori natural privileged
proposed concepts (together with realistic implementations),           direction.
or adjust or reject them if the implementation turned out to be
unfeasible at this stage.                                              Goniopolarimetric (GP) technique, or Direction-Finding, as
                                                                       it was used on Cassini until 2017, is based on deriving the
Measurement Concepts                                                   direction of arrival (DoA) of a plane wave and its polarization,
Measurements performed with this new cutting-edge instru-              by using the correlation of signal amplitudes measured on the
ment take root in ground-based radio phased arrays and inter-          different available antenna polarizations. On this principle,
ferometers. Similar concepts therefore need to be adapted to           GP is equivalent to having an “angular” spatial frequency
the scope of current nanosatellites technology used in swarm.          sampling device, whereas a multiple antenna interferometer
The added difficulty is to tackle the challenges raised by these       is a linear spatial frequency sampling device. Nevertheless,
3D, potentially-deformable, array of sensors. As for other             GP relies on strong assumptions on the regularity of the
radio observatories, some measurements take place at the sen-          dipole beam pattern. In the short dipole regime (l
sor level. These measurements are subsequently combined                λ/10), the individual dipole beam pattern varies smoothly
(in a distributed fashion) to form the array response, which           with direction following a sin2 function. When computing
is meant to bring improved angular resolution and sensitivity          co-localized “co-polar” and “cross-polar” correlations on a
while dealing with individual sensors of manageable size and           single node between the X, Y and Z dipoles, one can derive
load.                                                                  analytical solutions to trace the orientation of an incoming
                                                                       wave vector ~k. However, at higher frequencies, the beam
Modern radio astronomy has entered a new golden age with               pattern will present multiple nulls and many lobes that breaks
the advent of continental-scale radio observatories such a             the assumptions of GP [3] and introduce as many degenerated
LOFAR [17] and SKA [33]. Such observatories come with                  directions that can fit the data. Hopefully, modeling antenna
improved angular, spectral and temporal resolutions and huge           beam patterns in all direction as a DDE and using its spectral
sensitivity in a large field of view (FoV). Such improvements          dependency, can help alleviate this issue.
therefore come with a more complex instrumental “calibra-
bility”. Some critical assumptions, valid for ground based             In addition, improved knowledge of the antenna electric prop-
observatories, fall when going to space. For example, the lack         erties is critical for in-situ measurements of the surrounding
of a (infinite) reflective ground plane (typically Earth ground)       plasma characteristics, such as thermal noise spectroscopy
can introduce degeneracies in the calibration and imaging              [38].
process.
                                                                       Distributed Measurements—The power of using a network
Calibration of data taken on a large FoV demands the con-              of sensors resides in combining a lot of small manageable
sideration of the so-called “Direction-Dependent Effects”              sensors to mimic the properties of a much larger instrument
(DDE) such as the strong variations of the antenna beam                normally impossible to build nor launch but having improved
pattern with the direction. If not accounted for, the observed         angular resolution and sensitivity. This procedure is called
sky will strongly be biased by instrumental effect. On                 “aperture synthesis” that is nowadays the default design ap-

                                                                   4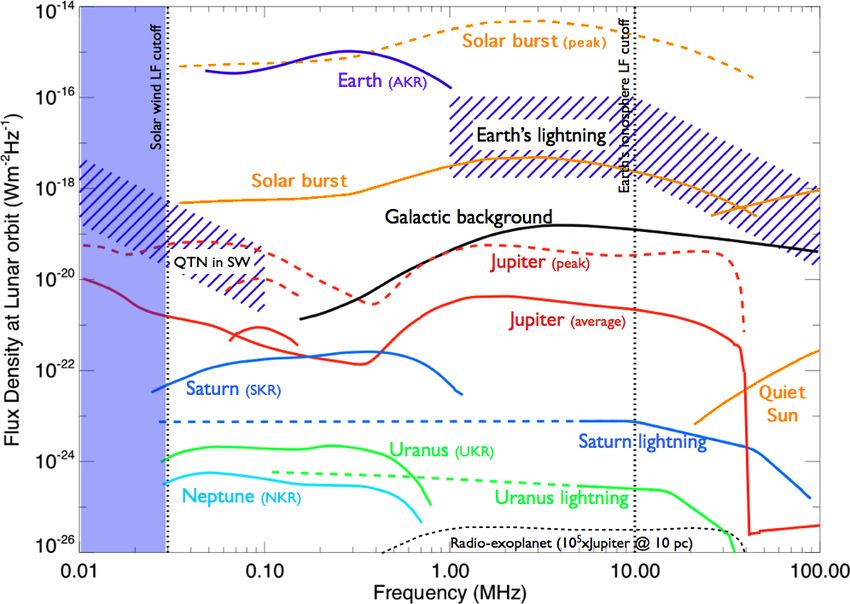
(b)

Figure 2. (a) Solar system radio source normalized spectra, as observed from a distance of 1 AU (Astronomical Unit). Radio
    emission spectra from Jupiter, Saturn, Earth, Uranus/Neptune are traced in black, green, red and blue. (b) The radio
 component spectra observed from Earth, including solar radio emissions, earth and planetary auroral and atmospheric radio
          emissions, galactic emission and local plasma noise on the antenna. Figure adapted from [20] and [32].

        S-ID      Science Topic                          Observed Phenomena
        Cosmology and Astrophysics
        S-CA1 Low frequency anisotropy of CMB            21 cm Line redshifted to 5-30 MHz range
        S-CA2 Foreground sources                         Extragalactic sources
        S-CA3 Foreground sources                         Low frequency sky mapping
        S-CA4 Pulsars                                    Low frequency dispersion of pulsars
        Solar and Stellar Physics
        S-SO1 Solar physics and Space Weather            Radio bursts associated with solar flares
        S-SO2 Solar physics and Space Weather            Radio bursts associated with CME and interplanetary shocks
        S-SO3 Solar physics and Space Weather            In-situ electrostatic waves
        S-SO4 Solar physics and Space Weather            Quasi thermal noise spectroscopy
        S-ST1 Stellar physics                            Stellar radio bursts
        Planetary and Magnetospheric Sciences
        S-PM1 Magnetospheric radio emissions             Terrestrial magnetospheric radio emissions
        S-PM2 Magnetospheric radio emissions             Jovian magnetospheric radio emissions
        S-PM3 Magnetospheric radio emissions             Kronian magnetospheric radio emissions
        S-PM4 Magnetospheric radio emissions             Uranus and Neptune auroral radio emissions
        S-PM5 Magnetospheric radio emissions             Exoplanetary auroral radio emissions
        S-PA1 Planetary atmospheric electricity          Terrestrial lightnings
        S-PA2 Planetary atmospheric electricity          Kronian lightnings
        S-PA3 Planetary atmospheric electricity          Uranus lightnings
        S-PB1 Planetary Radiation Belts                  Earth radiation belts
        S-PB2 Planetary Radiation Belts                  Jupiter radiation belts
                                                 Table 3. Science Objectives

proach to large scale instrument (e.g., LOFAR, MWA, SKA1-            ing the reconstruction of an aperture in a equivalent man-
Low). The purpose of the study is to address its feasibility         ner (in the aperture plane or in the Fourier transform of
in space. In principle, there is no fundamental difference           the aperture plane), the computing loads and the format of
between building an array of radio antennas on the ground or         the output data are drastically different. Beamforming is
in space. However, data rate constraints, online/offline data        performed with a complex weigthed (amplitude and phase)
processing and orbitography, sensors relative and absolute           sum that generate a single sensitivity beam pattern in a
positioning/attitude control are amongst the factors that will       target direction. In our case, the signals measured along the
directly impede the theoretical performances of the array and        main direction in the common reference frame of effective
the final scientific return of the measurements.                     antennas. An interferometer is a set of spatial frequency
                                                                     filters that samples the Fourier components of the sky (rather
We need to distinguish between two main kinds of arrays:             than the sky itself). In a complex-valued system, the sampled
phased arrays and interferometers. While the two are propos-         spatial frequencies depends on the array configuration. The

                                                                 5
measured samples are of the complex visibility function, and
are called “visibilities”. Practically, visibilities are obtained
by computing the cross-correlation between two sensors sig-
nals. The computation load of the phased output is negligible
S-PM5
S-PM4
S-PM3
S-PM2
S-PM1
S-CA4
S-CA3
S-CA2
S-CA1
S-SO3
S-SO2
S-SO1
S-PB2
S-PB1
S-PA3
S-PA2
S-PA1
S-ST1
S-ID
compared to that of the correlator output. It can easily be
affected by a misbehaving sensors that will corrupt the sum.
Conversely, the computation of all correlations scales with
N 3 per polarization where N is the number of sensors. A
10 MHz
100 kHz
500 kHz
500 kHz
5 MHz
300 kHz
10 kHz
10 kHz
10 kHz
10 kHz
1 kHz
100 Hz
10 kHz
300 kHz
1 MHz
300 kHz
300 kHz
5 MHz
Min.
misbehaving sensor can then be identified by its N-1 correla-
tions (or baselines) and flag as bad values from the data. The
two kind of arrays have similar pointing capabilities.
LOFAR is a typical working example of a fully digital radio
Spectral Scale
100 MHz 1 MHz
1 MHz
50 MHz
50 MHz
50 MHz
100 MHz 10-1000 kHz
1 MHz
1 MHz
45 MHz
1 MHz
100 kHz
100 kHz
100 MHz 10 kHz
100 MHz ?
100 MHz 100 kHz
100 MHz 100 kHz
100 MHz ?
50 MHz
Max.
telescope where the receiving parts are never moving. Beam
forming, beam pointing are fully operated digitally. If we
want to develop a N=50 network in space, we need to im-
plement the intelligence that will take care of this operations,
while the array is moving.
10 kHz
100 kHz
100 kHz
100 kHz
1 kHz
1 kHz
1-1000 kHz
1 kHz
1%
–
1 MHz
Resol.
The digital pathway of the signal can be represented as flow-
ing through a pipe of a certain radius. This radius depends on
the maximum data transfer rate between the sensors and the
processing unit as well as the processing capabilities of this
unit. NOIRE will provide data distributed across frequency
noise
10−1 Jy
noise
noise
noise
noise
noise
noise
noise
noise
106 Jy
1 mV/m
noise
?
noise
10−3 Jy
?
noise
Fluct.
channels (see Fig. 3) and depending on the scientific case
Table 4. Science Performance Requirements
of observation. All frequencies can be allocated to a single
particular direction of interest, or it can be subject of a
trade-off between the number of desired directions and the
Signal Scale
bandwidth allocated per directions.
6 Jy
10−3 Jy
100 Jy
103 Jy
1010 Jy
1 Jy
100 Jy
105 Jy
108 Jy
1011 Jy
108 Jy
200 mV/m
1012 Jy
?
1 Jy
106 Jy
?
1 Jy
Max.
Regardless of the beamforming mode or interferometric
mode, the default strategy will be to insert relative phase
delay between the nodes to point the array in specific di-
rection (i.e., the phase center). Coherency will be obtained
60 dB
60 dB
100 dB
100 dB
100 dB
120 dB
120 dB
120 dB
120 dB
120 dB
80 dB
30 dB
80 dB
?
120 dB
90 dB
?
70 dB
Dyn.
in a certain angular region around the phase center. For the
default targeted mode, the desired final imaging performance
will have a strong influence on the design of the array.
Working interferometers rely on the concept of coherency
–
–
1’
?
1’
?
4π sr 4π sr
Min
Spatial Scale
which guarantees that the sampled interferometric data is
unresolved
unresolved
correctly capturing some information about the sky. This
array will generate a lot of data, which can be reduced by
10”
10’
1’
1’
1’
∞
–
90◦
?
4π sr
?
Max
spectral and temporal integration. However, it is known that
such frequency or time averaging (in the correlator or during
data post-processing) will affect the span of the field of view
of a single pointing. Indeed, by following classical radio
M-ID      Description                                                    S-IDs
               Perform a measurement of the radio spectrum:
    M-F00      – from 0.3 to 50 MHz with 10 kHz to 1 MHz resolution           S-CA1, S-CA2, S-CA3, S-CA4, S-ST1, S-SO1,
                                                                              S-PM2, S-PM5, S-PA1, S-PA2, S-PA3, S-PB2
    M-F01      – from 50 to 100 MHz with >1 Mhz resolution                    S-CA2, S-CA3, S-CA4, S-ST1, S-SO1, S-PM5,
                                                                              S-PB2
    M-F03      – from 10 kHz to 1 MHz with
Impact on System Specifications— Array configuration and              acquire signal and process it. All nodes can communicate
the number of sensors will depend on the tractability of              with each other and with Earth. The interchangeability makes
computing ∼ N 2 correlations but also the feasibility of              the swarm robust to failure. It also lowers the manufacturing
controlling many sensors in the array. For an RF array                costs.
deployed on the Moon [46], it is possible to derive the
minimal number of sensors required to achieve a certain point         In case a fully homogeneous swarm appears to be not fea-
source RMS. A typical number of 50 sensors will provide               sible, application-specific nodes would be envisaged for the
1 Jy/beam, 100 mJy/beam, 10 mJy/beam point-source RMS                 such functions as space-time reference system, Earth com-
in 24h respectively at frequencies of 3 – 30 – 300 MHz.               munication, science processing unit.
The point-source RMS decreases with the number of sensors
following a power law. It is wrong to think that we will              Networking—The plan is to strictly mimic a ground-based
make a huge interferometer with million km baselines at low           network model with: physical connectivity with closest
frequency n the frequency range of NOIRE (f ≤ 100 MHz).               neighbors (not with all nodes); this connectivity doesn’t need
Being free from Earth ionospheric cut-off frequency (around           to be permanent but should be able to be activated at any time;
10 MHz), the array is still exposed to propagation effects            logical connectivity between each nodes through Internet
in the interstellar medium (ISM) and interplanetary medium            technologies (routing, protocols and services).
(IPM). their effect will be to restrict the maximal angular
resolution power as a function of frequency. For example,             Such a networking scheme allows a limited operating range
the ISM and IPM angular broadening affect the size of any             for physical connectivity (and thus limited dedicated re-
structures at 1 MHz to ∼ 1◦ minimal angular size, which               sources) and provides a full support to all communications
equates the maximum achievable angular resolution of an 50            needs: swarm measurement configuration (phasing of sen-
km baseline at the same frequency. Temporal broadening will           sors); time reference propagation; shared computing; data
also distort the duration of transient radiosources. Detailed         distribution before and after the processing.
effects of the IPM, ISM, polarization decorrelation, absorp-
tion, angular/temporal dispersion and proximity of the sun            On-board Distributed Computing— The usual strategy of
and of the the galactic plane are developed in [47].                  transmitting a digitized waveform directly to Earth for pro-
                                                                      cessing, is probably not feasible within the low on-board
Integrating data helps improving the detection SNR but is             resources of nanosatellites. Thus a good way to reduce
limited to a bedrock defined as the thermal noise limit and the       significantly the data flow is to achieve the beamforming or
confusion limit. The confusion limit is the steady background         interferometry processing on-board (even partially). For this
radio noise associated with unresolved sources that create a          purpose, it could be taken advantage of the total computing
structured background. Once this limit is achieved, there is          power available in the swarm to distribute this processing
no need to integrate further as the noise will stop decreasing.       onto a networked computer architecture, inspired by its
Depending on the maximum, this will limit the survey speed            ground counterparts.
and the maximum achievable absolute sensitivity of the in-
strument. Confusion limit can be improved by increasing the           Relative Navigation and Ranging – Time Keeping and Propa-
maximum baseline and the number of sensors [46], however,             gation—In order to achieve on-board interferometry process-
due to ISM/IPM scattering, at low frequencies, there is a             ing, the individual time and position of each node must be
fundamental limit to the detection level achievable by the            known to an accuracy dictated by the observed phenomena,
instrument.                                                           observation frequency, measurement requirements. More-
                                                                      over, the individual measurements should be done within a
In order to be able to combine the raw signals into imaging           given time slot for the correlation process to be acceptable.
products (see previous paragraphs), the platform must pro-
vide the following characteristics:                                   For that purpose, an auto-location capability is necessary to
                                                                      estimate on-board the relative positions of the nodes, as well
•  ranging accuracy on baselines: ∼ 1 cm (fraction of the             as the shape and orientation of the swarm. An on-board time
shortest wavelength);                                                 reference is also required for the purpose of the interfero-
                                         ◦                            metric processing (but also of the auto-location mechanism),
• attitude of each node: better then 1 (accuracy of single
node antenna calibration);                                            to be maintained and distributed over the network. Such a
• orientation of the baselines in an inertial astrophysical           time reference is not necessarily ”absolute”, i.e., locked on a
frame with an accuracy of ∼1”;                                        terrestrial or astronomical time scale.
• clock error or drift
done after the swarm has scattered. If a specific geometry                ship), or if the computation can be distributed among the
is needed, then post-dispersion operations may be required.               nodes. Fig. 4 depicts a beamforming processing performed
The long term evolution of the swarm geometry will have                   at the node i. After having received the Na − 1 time-tagged
te be evaluate together with the science requirements. With               signals from the other nodes, the phasing step is performed
the frame of such a low-control swarm, there may be a need                in two steps: a coarse phasing step and a fine phasing step.
to implement a herding dog algorithm [48]. The homoge-                    The former is done by using a shift register to insert true-time
neous swarm concept makes all nodes interchangeable. It                   delays (TTD) between the signals. Then, after undergoing
is then possible to redistribute roles between central and                a Fourier transform, complex phase coefficients are applied
remote nodes. This relaxes geometry constraints to statistical            to each signal in the Fourier space. The coarse step helps
geometrical properties (contrarily to individual constraints,             inserting the necessary TTD to fold the remaining pointing
depending on node capabilities).                                          phase to the [0◦ − 360◦ ] range.
The measurement requirements don’t impose any attitude                    The resulting three dimensional complex spectrum is rotated
control, but requires the knowledge of the attitude of each               into the beam frame to obtain the complex beamlet spectrum.
node, and a slow evolution of the node orientation (attitude              One can decide to allocate the responsibility of computing
must be considered as constant during individual measure-                 one beamlet to one node so that up to N beamlets can
ment, within the required knowledge accuracy). There is no                be formed independently. One can add “weights” to the
science driven need for an attitude control after the initial             various nodes signal to shape the beam according to an
deployment-induced rotation are damped down. However                      arbitrary apodizing strategy. Classical weights are 1 to enable
ancillary requirements may impose attitude control, e.g.,                 the beamforming of a theoretical array of identical anten-
solar pointing for solar panel, or Earth pointing for ground              nas. The phased signals can either be summed coherently
transmissions. The swarm network concept doesn’t require                  (“beamformed” mode) or be cross-correlated (“Interferom-
pointing for intra-swarm communication (omni-directional                  eter” mode) to compute the visibilities around the beamlet
antenna).                                                                 phase center.

Concerning, the global attitude of the swarm, there is no                 Orbitography
requirement for pointing or attitude control, but there is
a scientific requirement on the knowledge of its absolute                 Several orbital options have been studied in previous studied
attitude in an absolute astrophysical frame.                              (Sun-Earth L1, Sun-Earth L2 or Lunar orbit). In the frame
                                                                          of NOIRE, a lunar equatorial orbit is investigated at this time.
                                                                          An Earth-Moon L2 orbit study was considered as an option at
                                                                          early stages of the study, but has not been further developed.
                4. T ECHNICAL S TUDIES
This section presents the results of the various studies con-             The first step of the analysis is to evaluate the time of
ducted during the past year.                                              visibility for an earth observer for TM/TC (Telemetry and
                                                                          Telecommand) purposes as well as for scientific purposes
Measurements and Processing                                               (some science objectives requires to be hidden from Earth
                                                                          radio interferences). As the Moon is in the ecliptic plane, the
Each sensor-node (i.e., nanosatellite) is composed of three               location of the observer matters: with an observer at Earth’s
orthogonal electric dipoles (noted h1 , h2 , h3 ) which provide a         center (occultation of Earth), a study over a month is enough;
full polarimetric measurement of radio waves. Their physical              with an observer at a specific location on Earth’s surface, a
length is set to ∼5m tip-to-tip [4], [6]. Each dipole is con-             study over a year is required. In all cases the sensitivity of the
nected to a low noise amplifier (LNA) directly situated at the            results with respect to the orbit altitude has to be evaluated.
antenna feed point to reduce the impact of Radio Frequency                The lunar gravitational sphere of influence has a radius of
Interference (RFI). This first amplification stage is critical in         50000 km. A lunar orbit will then be inside that sphere.
the whole amplification chain. The noise level of current                 The altitude of the orbit is not constrained by the science
designs is of the order of 3 to 5 nV/Hz1/2 . The LNA input                requirements.
impedance is large enough to limit the interaction between
antenna and the satellite body to a capacitive coupling.                  As a first step, we study a circular lunar orbit. We recall that
                                                                          the Moon radius is ≈1700 km. The period of orbits of semi
Each measured and amplified electric signal is digitized by               major axes 5000 km or 10000 km are respectively ≈7.0 h
the radio receiver in the 1 kHz – 100 MHz band. The three                 and ≈24.9 h. The fraction of time in Earth occultation is
antennas are sampled simultaneously by parallel Analog-to-                inversely proportional to the distance. For the two orbital al-
Digital converters (ADC). The rate of the digital signal is               titude previously given, the spacecraft is in Earth occultation
200 Msamples per second. On-board Field Programmable                      condition 11% and 5.5% of the time, respectively. The case of
Gate Arrays (FPGA) will produce a defined number of Nf                    elliptical orbits has been studied in order to try to increase the
frequency channels (or sub-bands). A total of 3Nf sub-bands               Earth occultation fraction time. However, the analysis allows
will be produced by each sensor-node. Fig. 3 display the                  us to rule out this option, as the orbit apsides are rotating in
typical measurement chain on a single sensor-node. This                   the Earth-Moon frame, leading to reduce the occultation time
flux of raw data will then be processed jointly along with                over course of a lunar revolution.
the similar flux coming from other sensor-nodes. Subsequent
steps include data buffering, post-processing, beam forming               Considering first a swarm with two nodes on the same orbit
and/or correlations. The computing load to produce the array              (with an offset), there are three possible effects depending on
response represents a critical design for the instrument.                 the offset (in-track, radial or off-plane). An in-track offset
                                                                          makes no specific effects, the nodes are just following one
Assuming that all sensor signals have reached the central                 each other. A radial offset gives a relative rotation in the
computation node, a dedicated post-processing unit is taking              orbital plane. With off-plane offset, the nodes will have
care of the beamforming/phase shifting of the signals. Design             relative off-plane rotation. We can extend this simple scheme
studies have to tell if a central unit is necessary (e.g., a mother       to a swarm with a larger number of nodes. In the simulation,

                                                                      9
Nf sub-bands x 3 channels
Rx board (in Swarm frame) to other nodes
h1 FPGA DPU S/C IF
1k - 100M 16 bits
Nf sub-bands
Buffering
200 Msps PFB
LNA ADC
FIR
Nf sub-bands x 3 channels
Processing
h2 Rotation Matr.
1k - 100M 16 bits Hilbert Transf.
Nf sub-bands
200 Msps PFB
LNA ADC
FIR
Beam Former
h3
1k - 100M 16 bits
Nf sub-bands
Correlator
200 Msps PFB
LNA ADC
FIR
(Nsc -1) x Nf sub-bands x 3 channels
(in Swarm frame) from other nodes
Figure 3. Typical architecture for the acquisition and processing on a node. The measurement chain is composed of an
antenna, a low noise amplifier (LNA) and a digitization front-end (filtering and conversion). The radio receiver (Rx board) is
composed of those front-ends and an FPGA, which extracts Nf sub-bands using polyphase filter banks (PFB) or impulse
response filters (IRF). The data stream is sent to the digital processing unit (DPU), which manages all further processing. The
data stream is also transmitted.
S/C IF DPU
f φ iε f φ
e 1 w1 RAM
1 M1
t t
f φ f φ
i–1 Mi–1 eiεi–1 wi–1
t t
f φ f φ f φ f φ
Mi eiεi wi
Σ Rb
t t beamlet
f φ f φ
i+1 Mi+1 eiεi+1 wi+1
t t
f φ f φ
n Mn eiεn wn
t t
Fine
Phase
FFT
Weighted
Sum
Coarse
Shift
Beam
Frame
i
time
(Nsc -1) for 1 sub-band vector waveform
(3 streams of real values per node per sub-band)
Figure 4. Principle of Beam Forming done on a single node. The waveform from each node is processed the same way:
coarse shifting using a shift register to correct for large scale radio path; an FFT to pass into the Fourier space; a fine shifting
using a phase shift in Fourier space; and a weighted sum. As the data propagation path in the swarm network depends on the
distance between the nodes, all waveforms are not processed simultaneously. The resulting three dimensional complex
spectrum is rotated into the beam frame to obtain the complex beamlet spectrum.
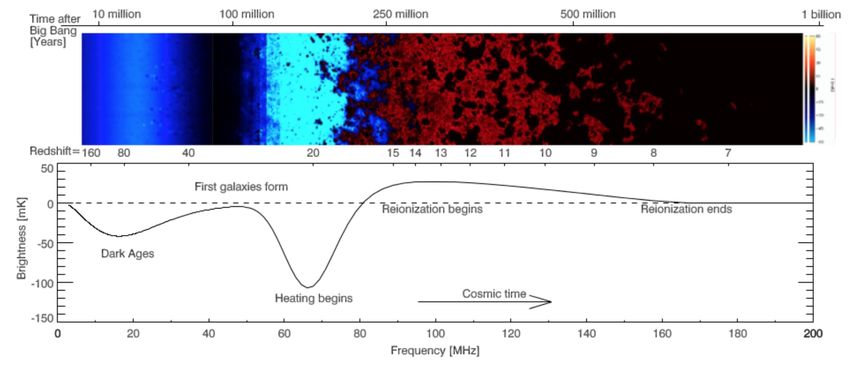
1050 nodes are set randomly in an initial sphere of 100 km on simulated orbits, satellite ranging never exceed 180 km
radius, and an orbital period for the swarm center is ≈9 h. and with a EIRP (Effective Isotropic Radiated Power) of 1W,
the link budget is excellent. In this way, the error estimation
variance on the pseudo-distance tracking clearly decreased
The evolution of circular orbits with respect to gravitational compared to Earth application. The Figure 7, highlights the
perturbation (Earth, Sun, Lunar J2 gravitational moment) DLL standard deviation error in function of C/N0. The curves
will be evaluated in further studies, as well as the swarm’s depend on several DLL tracking parameters (bandwidth filter,
deployment strategy. time integration, chip spacing, discriminator, . . . ) and, above
all, depend on chip frequency rate and type of modulation.
Location, Timing and Navigation
Location and time keeping— Performances of the location For instance, by using faster modulation such as BPSK(10)
and time system are directly constrained by the measurement (Binary Phase-Shift Keying modulation technique), the rang-
requirements, as the swarm is the infrastructure support of ing accuracy of 1 cm in node to node could be easily
measurement devices. As discussed in the previous sections, achievable. The final accuracy of location not only depends
the first order estimate of the required precision on the node on ranging accuracy but also on a factor called ”Dilution of
distances is of the order of 1 cm, and the time keeping Precision” (DoP), which depends on the location of reference
precision is directly linked to the length of the individual nodes compared to the receiving node. The simulation shows
snapshots to be combined. that DoP < 1, which implies that by only considering ther-
mal noise effects, the geometrical accuracy of 1 cm compared
Based on the homogeneous swarm hypothesis, the initial to a reference point of the swarm is achievable. Another
selected location and timing concept is founded on GNSS- challenging problem to cope with is not in theoretical aspects
like strategy (Global Navigation Satellite System). Each node of localization strategy but specifically about the quality of
is both a transmitter and a receiver. By using a well-known calibration done on instrumental hardware biases. Moreover,
TOA-CDMA technique (Time Of Arrival - Code Division the clock biases should be accurately estimated in order to
Multiple Access), inter-satellites ranging could be precisely maintain a global synchronization of all node local oscillators
determined. Consequently, each node can use the rest of the thanks to a time scale algorithm. This item will be the subject
swarm to localize itself. of a further study.
The proposed concept is based on a S-band device with The distances between each pair of nodes are the interfero-
a channel for ranging determination and another one for metric baselines. This information must then be known on
science data. This concept was used for the proximity link the nodes that combine the measurements into beamforming
between Rosetta and Philae, with 1 MHz for codes and 50 or interferometric products.
Hz for data. The model is based on the orbit modeling
presented before and includes the relative velocities. In this Swarm shape and orientation—In order to locate the source
first estimation, the assumptions are the following: the nodes of the radio astronomical signals, or to achieve beamforming-
don’t have spin nor attitude control; they use omni-directional based observations, the knowledge of the orientation of the
antenna both transmission and reception; there is no sig- baselines (and of the whole swarm) is also necessary. At
nificant multipaths propagation; there is no electromagnetic first sight, it appears possible to reconstruct the 3D topology
interference in transmission-band; the swarm is composed of from the node-to-node distances. However multiple con-
50 nodes, all in operations; and the noise temperature doesn’t figurations that generate the same history of node-to-node
depend on the antenna pattern (two extreme temperatures distance measurements can be found for a swarm of free
were considered: 30K in Lunar occultation, 300K concept). drifting satellites. Removing the ambiguity implies therefore
The simulation also assumes that clocks have no bias. some additional observables that can be brought either by the
orbit determination of some of the nodes or indirectly by the
The signal observed by a node i is modeled as follows: application of maneuvers.
In this study, a “minimalist” navigation concept has been
PFi11,C1 = ρi1 + hi + h1 + c.(biC1 − bs1
C1 ) + η1 (F 1, C1) proposed to estimate the swarm’s shape and orientation. It re-
PFi12,C2 = ρi1 + hi + h1 + c.(biC2 − bs1
C2 ) + η1 (F 2, C2) quires the knowledge of the position of at least one node, and
.. reconstructs the absolute state of all the other nodes through
. the integration of the swarm dynamics and the processing
PFiN1,C1 = ρiN + hi + hN + c.(biC1 − bsNC1 ) + ηN (F 1, C1) of relative distance measurements. The efficiency of this
PFiN2,C2 = ρiN + hi + hN + c.(biC2 − bsN concept is strongly dependent on the precision of the time
C2 ) + ηN (F 1, C2)
and location system, but also the accuracy with which the de-
termination of the reference node’s position can be achieved
where PFij1,C1 and PFij2,C2 are the pseudo distances between with “ordinary” ranging and doppler measurements (such as
nodes i and j measured on frequency links F 1 and F 2 and those realized on TM/TC links for deep space probes) and
for the codes C1 et C2; ρij the geometrical distance between associated on-board orbit extrapolation.
nodes i and j; hi is the clock error on node i; ∆τ ij =
Various GNC (Guidance, Navigation and Control) strategies
(biC1 − bsj
C1 ) is the instrumental delays for nodes i and j for have been identified in order to optimise the accuracy of this
the code C1; and η1 (F 1, C1) is the DLL (Delay Lock Loop) navigation concept and a prototyping of the aforementioned
thermal noise tracking error on node i for the frequency F1 navigation technique has been performed [49]. Complemen-
and code C1, and c the vacuum speed of light. As shown on tary work is needed to address critical issues: the convergence
Figure 6, the doppler shifts are rather small for this orbital of the estimator initialization, the design of an optimized and
configuration which makes frequency tracking easier. A reconfigurable distributed estimator to reduce the computa-
detailed analysis of link budget also shows that the signal to tional load. These will be the subject of further studies.
noise ratio (C/N0, Carrier to noise density) is never going
below 60 dB.Hz, which is a very favorable situation. Indeed,
11Figure 5. Orbital simulation of a swarm of 50 elements, in circular Lunar orbit (orbital period of ≈9h). The left-hand panel
shows the motions of each node in the center of mass frame of the swarm, over one orbital period. The right-hand panel shows
the same data, but seen in the direction of the z-axis. Distances are given in km.
Figure 7. Code tracking error as a function of Signal to
noise ratio, for all sets
Figure 6. Doppler shift (vertical axis) and node distance
(color axis) plotted versus time for a simulation run.
bution schemes have been identified on the basis of well-
On-board Processing and Avionics known ground solutions: task distributed parallelism (such
In the growing market of nanosatellites, some low-cost low- as Apache Mesos) versus data parallelism (such as MPI).
power hardware solutions have been identified to be good Although these distribution schemes will have to be more
candidates, based on COTS SoC (System on Chip). This deeply assessed, it already appears that a dedicated work has
kind of new component provides high processing power and to be done on algorithm implementation, in order to relax
flexibility thanks to multiple hardware architecture available the functional and QoS requirements applicable to the inter-
(GPU, FPGA, multicore CPU). Even if some references are node data communication system, which is expected to be
announced to be Rad-Tolerant, such solutions and associated challenging and costly. Further studies and trade-offs will
architectures need to be evaluated from the EMC point of be considered, as soon as some key processing parameters
view (see below) and the mitigation of their potential impacts will be more precisely known: elementary measurement
on the radio measurement carefully analyzed. duration, number of successive or integrated acquisitions,
data volume to be acquired and exchanged, sequencing of
As regards the on-board processing, two candidate distri- local and distributed processing.
12Electro-Magnetic Compatibility centralized infrastructure. All nodes communicate through
Radio receivers mounted on the NOIRE swarm nodes have there own wireless interfaces. As there is no infrastructure,
to measure low level electric fields. These receivers are all nodes are routers and participate to the discovery of routes
very sensitive. Electromagnetic compatibility (EMC) re- between nodes. The mobiles nodes are thus forming an ad-
quirements are thus one of the main constraints on the system. hoc network infrastructure. The way the network topology
In order to ensure electromagnetic cleanliness, EMC concepts is changing is a dimensioning characteristic of the network,
must be taken into account in early design phases. An as it implies dynamical reconfiguration of the network and
EMC work group shall be set up as soon as possible during may result into frequent node disconnections. Several classi-
implementation. This working group shall be composed fications of MANET routing algorithms have been proposed
(see, e.g., [51] and [52]). The latter reference defines three
of: EMC experts, instrument team members and system classes of MANET: proactive, reactive and hybrid networks.
representatives. The EMC working group will set up a
precise EMC control plan and update it throughout the project Proactive MANET are implementing a knowledge of the
(including during design and test phases). The EMC control network topology in each node, which uses a large bandwidth
plan contains studies and analyses proving that instruments overhead to maintain this knowledge. On reactive MANET
and system are compliant with EMC requirements, design connexions are established on demand from peer to peer
rules, frequency control plan, as well as test concepts and and there is no need to maintain a routing table. However,
procedures. The EMC working group will also assess any establishing a route takes a longer time (not predictable) than
deviation and exception to the EMC control plan and and with a proactive network. Hybrid MANET are trying take
propose adequate recommendations or waivers. advantage of both solutions. For instance the ZRP (Zone
Routing Protocol) a proactive scheme is used between close
The requirements defined in ECSS-E-ST-20C (Electrical and neighbors and a reactive scheme is used for further connec-
electronic) and ECSS-ST-20-07C (ElectroMagnetic compati- tions. In the case of NOIRE, setting up a MANET seems
bility) are applicable. These requirements will be reinforced appropriate, probably using ZRP scheme, as we want to limit
the system bandwidth compared to the science bandwidth.
according to the mission-specific constraints. EMC control
plans from the Solar Orbiter or JUICE mission can be used as
a good starting point. However they will have to be updated Communication with Earth—Direct communication to Earth
taking into account the specific NOIRE concept platform from a lunar nanosatellite is of course challenging, as long
(swarm of small interconnected nanosatellites). as a significant data rate is needed. Except the relay solution
(the carrier that has deployed the swarm is still in the Moon’s
Communications and Networking vicinity and could be used for this purpose), the swarm
itself could be envisaged as a synthetic antenna for direct-to-
Inter-node communication—The proposed inter-satellite link Earth communication. This original concept has not yet been
(ISL) is based on omni-directional communication to avoid studied further.
implementing pointing systems between nodes. The studied
networking scheme is a physical connectivity limited to the Satellite Architecture
nearest neighbors (in order to limit the power consumption
of the telecom system), the communication at swarm scale No traditional architecture studies (sizing, layout, subsys-
being achieved through successive hops by means of network tems dimensioning) have be conducted, but the first iden-
protocols. As said before, such an ISL would be compatible tified needs for capacity or performance, combined to the
increasing offer of nanosatellite equipment, e.g., energy and
with the auto-location system and share the same physical power conditioning, attitude control sensors and actuators,
link. Further dimensioning of the hardware equipment and
associated link budget computation need data rates to be structure elements, launcher interface, give confidence in the
estimated for each function (location and navigation, time availability of hardware solutions to implement the swarm’s
keeping protocol, distributed processing, command and con- satellite.
trol, etc.). Nano-satellites or very small platforms tend to be strategic for
Networking paradigm— The orbital 3D modeling of the spatial applications. Guiding and controlling very small satel-
swarm a strongly dynamical topology. The relative locations lite trajectories as well as their orbital drift ask for compact,
of each node is very variable in time. This will challenge efficient, and robust propulsion systems. However, traditional
the network routing protocol, as the route joining two nodes propulsion systems hardly match the required constraints
is not persistent. Node are able to communicate with the for this new generation of small satellites. Most of these
surrounding nodes, within the effective range of their com- technologies have been optimized for operation in a range of
munication antenna. Several hops from nodes to nodes may power that serves the needs of usual space missions (North
South Station Keeping and Orbit raising). For example, a
be needed to route a packet to its destination. The node relatively large number of Hall Effect thrusters ranges from
mobility and the power limitation must be taken into account
to select or design suitable routing protocols. Such type of almost 200 W in power level to several tens of kilowatts. New
information routing problematic has been studied for Mobile innovative and efficient propulsion systems are then needed,
Ad hoc NETworks (MANET) without infrastructure where and new tracks have to be explored
all stations are mobile. The IETF (Internet Engineering Task
Force) is standardizing routing protocols for MANET [50].
5. C ONCLUSIONS AND P ERSPECTIVES
A MANET is characterized by the following properties. As this stage, the NOIRE study has began preliminary work
Nodes are mobile units, which are moving freely and arbi- to identify the main constraining parameters of the proposed
trarily. The network topology can thus be modified anytime, concept, along with system-level enabling solutions. If the
in a unpredictable manner. The topological links may be feasibility of such a system has not yet been demonstrated,
mono- or bidirectional. The units are autonomous and may no strong show-stopper is identified. Thus, the concept is not
have limited power. The power resources management has yet ready to be implemented, and further studies are identified
be to taken into account. There isn’t any preexisting nor in the following areas.
13You can also read