Non-Energy Benefits Study: Phase II - Quantified Benefits and Qualitative Insights
←
→
Page content transcription
If your browser does not render page correctly, please read the page content below

Non-Energy Benefits Study:
Phase II
Quantified Benefits and Qualitative Insights
July 2021

Prepared for:

Independent Electricity System Operator (IESO)

Submitted to: Prepared by:

Independent Electricity System Operator Dunsky Energy Consulting
Jimmy Lu 50 Ste-Catherine St. West, suite 420
Evaluation Specialist Montreal, QC, H2X 3V4

www.ieso.ca www.dunsky.com | info@dunsky.com
 + 1 514 504 9030

 With the support from:
 Ad Hoc Research
 RPM Research

 About Dunsky
 Dunsky provides strategic analysis and counsel focused exclusively on helping our clients accelerate
 the clean energy transition, effectively and responsibly.

 With a focus on buildings, renewables and mobility, our 30+ experts support our clients –
 governments, utilities and others – through three key services: we assess opportunities (technical,
 economic, market); design strategies (programs, plans, policies); and evaluate performance (with a
 view to continuous improvement).

Executive Summary
In this study, we assessed the Non-Energy Benefits (NEBs) from energy efficiency projects funded by the
IESO over the 2017-2019 period. We quantified NEBs in each of the seven sectors served by the IESO
programs and we assessed how these values might be included in cost-effectiveness testing. We also
gathered qualitative information about NEBs and identified how NEBs can be used to meet IESO program
design, marketing, and policy objectives.

The study included four stages:
 1. Screening and review of NEBs with industry experts to identify the most relevant NEBs for
 each sector
 2. Participant surveys that collected quantitative and qualitative data for each sector
 3. NEBs quantification that combined survey data with IESO program tracking data
 4. Cost-effectiveness guideline review to understand how NEBs could be captured in IESO’s
 cost-effectiveness tests

The table below outlines all sectors and NEBs included in the study. For each sector, the NEBs are
ranked by quantified NEB value. The quantified value is included in brackets.

Table ES1. Ranked NEBs by Sector and (Quantified NEBs Values)

 Low- First Nation
 Residential Commercial Institutional Industrial Agricultural
 income (Participant)

 Reduced financial 4 1 2
 stress ($0.03) ($0.09) ($0.090)
 1 2 1 2 2 2
 Thermal comfort
 ($0.11) ($0.08) ($0.092) ($0.05) ($0.25) ($0.003)
 Reduced building & 5 1 3 2
 equipment O&M1 ($0.02) ($0.08) ($0.11) ($0.03)
 Improved indoor air 3 3 4 3 1 3
 quality ($0.05) ($0.02) ($0.06) ($0.007) ($0.27) ($0.002)

1
 O&M stands for Operations & Maintenance

 i
Low- First Nation
 Residential Commercial Institutional Industrial Agricultural
 income (Participant)

 Sense of control over 2
 energy decisions ($0.06)
 Improved lighting 3
 levels ($0.08)
 4 4
 Reduced spoilage
 ($0.0002) ($0.001)
 Improved business 1 1
 outcomes ($0.04) ($0.09)
 Improved product 3
 quality ($0.01)
 Total (depends on $0.05 - $0.09 - $0.09 – $0.08 – $0.11 - $0.08 $0.09 -
 specific measures)2 $0.27 $0.19 $0.32 $0.14 $0.63 $0.10

 Using NEBs Values
 All participant NEBs presented in this study are based on participants’ self-reported perception of
 the value of NEBs they experienced from the energy efficiency measures. Previous studies have
 found subjective benefits, including the NEBs quantified in this study, to be highly valued by
 participants. Some jurisdictions choose to use these values primarily for program design,
 marketing, and customer targeting rather than in cost-effectiveness testing. Other jurisdictions do
 include subjective or ‘soft’ NEBs in cost-effectiveness testing. This report highlights many potential
 uses for the Ontario-specific NEBs values, including marketing, program design and policy support.
 The report also includes an overview of how these NEBs could be applied in cost-effectiveness
 testing.

From the study findings, the following key takeaways emerge:

Participants of IESO-funded programs place a great deal of value on NEBs. In many cases, the
value of the NEBs within a given sector exceed the value of the participant energy savings. This highlights
that there are factors beyond energy savings that may motivate participation in energy efficiency or
contribute to positive customer experiences with programs.

NEBs factor into decision-making around program participation across all sectors. More than
half of residential respondents and nearly two-thirds of non-residential respondents consider NEBs
when deciding to participate in programs. In addition, those who consider NEBs when considering
program participation are more likely to pursue additional EE measures in next 5 years.

2
 Some NEBs are specific to certain measures (e.g. improved lighting levels). The total NEB value therefore
depends on the measures offered within a given program.

 ii
NEB values are likely higher than estimated in this Study. This study did not include all possible
participant NEBs from energy efficiency but was limited in scope to NEBs related to specific efficiency
measures installed through six IESO CDM programs during 2017-2019. We also elected to use a
conservative approach when calculating the NEB values.

The NEBs identified and their valuations vary by sector. Although some NEBs were identified as
relevant and valued highly across multiple sectors – notably thermal comfort – there is considerable
variation in NEB selection and valuation between sectors. Each sector has a unique combination of
NEBs, and even those sectors with a similar NEB mix show differences in their NEBs rankings. For
those NEBs that are found across multiple sectors, there is also considerable variation in absolute
NEBs values by sector. This supports the sector-specific granularity of this study.

Areas for future research include values by subsector (notably within the agricultural and
industrial sectors). Some experts highlighted the potential for there to be differences in the valuation of
NEBs in some sub-sectors – in particular those in the agriculture and industrial sectors. Additional
targeted research could illuminate the benefits most relevant to subsectors and further shape marketing
and communications targeted to those customers.

 Applicability to Other Jurisdictions
 Because NEBs research has not been completed in all jurisdictions, others may be interested in
 leveraging this research. While the methodology used in this study is not jurisdiction-dependent and
 could be replicated in other jurisdictions, the results of the study are specific to Ontario. Given the
 widely varying NEBs values found in the jurisdictional scan, the Dunsky Team cautions against the
 simple adoption of these NEB values in other jurisdictions.
 Additional considerations regarding the applicability of this work include:
 1. The NEBs valuations are dependent on the specific measure mixes installed by surveyed
 participants as well as the overall program designs. For example, many residential sector
 survey respondents had installed thermostats, which may have led to an increased
 valuation of the ‘sense of control over energy decisions’ NEB. The measures installed in
 each sector’s surveyed population are included in the appendix and the NEBs valuations
 should be considered in the context of these values.
 2. Ontario is a very large province (over 1 million square kilometres – an area larger than
 France and Spain combined) with a highly diversified economy driven primarily by the
 services sector as well as key manufacturing industries such as automotive, biotech,
 pharmaceuticals and communications technologies3. Ontario’s climate is characterized by
 cold winter temperatures alongside strong seasonal temperature swings to increasingly
 warmer summers that are increasing the demand for air conditioning across the province.
 While the province has generally been a summer-peaking electricity system since 2000, it
 could be characterized dual peaking system with Ontario having an annual winter peak as
 recent as 20144. This points to the increased importance and challenge of maintaining

3
 Government of Ontario. (2019). Government of Ontario. Available at this link.
4
 IESO (2014). 2014 Electricity Production, Consumption, Price and Dispatch data. Available at This link.

 iii
comfort year-round, and the potential for increased energy intensity compared to other
jurisdictions. The NEBs values may have also be impacted by the combination of industries
present in Ontario along with the province’s home and building characteristics, which are
expected to vary from other jurisdictions.

 iv
Table of Contents

Executive Summary ........................................................................................................... i
1. INTRODUCTION ............................................................................................................. 1
 1.1 – Study Context ...................................................................................................................................... 2
 1.2 – Research Objectives............................................................................................................................ 2
 1.3 – Study Scope ......................................................................................................................................... 3
 1.3.1 – NEB Categories .............................................................................................................................. 3
 1.3.2 – Sectors and Programs .................................................................................................................... 4
2. METHODOLOGY............................................................................................................. 5
 2.1 – Screening & Review of NEBs .............................................................................................................. 6
 2.1.1 – Identify in-scope NEBs .................................................................................................................... 7
 Industrial NEBs ........................................................................................................................................... 7
 Agricultural NEBs ....................................................................................................................................... 7
 2.1.2 – Market Research Online Community Survey .................................................................................. 7
 2.1.3 – Final NEBs Screening ..................................................................................................................... 8
 2.2 – Participant Survey ............................................................................................................................. 11
 2.3 – NEBs Quantification ........................................................................................................................... 12
 2.3.1 – Participant NEBs Quantification .................................................................................................... 12
 2.3.2 – Societal NEBs quantification (reduced air pollution) ..................................................................... 13
 2.4 – Cost-Effectiveness Guideline Review .............................................................................................. 14
 2.5 – Summary of data sources and uses ................................................................................................. 14
3. RESEARCH FINDINGS ................................................................................................. 16
 3.1 – Summary of findings: participant NEBs .......................................................................................... 17
 3.2 – Residential, Low-income and First Nation Sectors ......................................................................... 19
 3.2.1 – Experience with NEBs ................................................................................................................... 19
 3.2.2 – Quantified Values .......................................................................................................................... 22
 Reduced Financial Stress ......................................................................................................................... 23
 Thermal Comfort ...................................................................................................................................... 24
 Reduced Building & Equipment Operations & Maintenance .................................................................... 24
 Improved Indoor Air Quality ..................................................................................................................... 24
 Sense of Control over Energy Decisions .................................................................................................. 25
 Improved Lighting Levels .......................................................................................................................... 25
 3.2.3 – First Nation Community Survey .................................................................................................... 25
 3.3 – Non-Residential Sectors ................................................................................................................... 27
 3.3.1 – Experience of NEBs ...................................................................................................................... 27
 3.3.2 – Quantified Values .......................................................................................................................... 32
 3.4 – Illness Cost of Air Pollution ............................................................................................................... 37
4. NEB APPLICATIONS .................................................................................................... 41
 4.1 – Cost-effectiveness testing ................................................................................................................ 42
 4.1.1 – Including NEBs in Cost-Effectiveness Tests .................................................................................. 42
 4.1.2 – The Application of NEBs at the Program and Portfolio Levels ...................................................... 43
 4.1.3 – Comparison to Other Jurisdictions ............................................................................................... 47
 4.2 – The Application of NEBs to Demand Savings Values ..................................................................... 48
5. CONCLUSIONS ............................................................................................................ 50
 5.1 – Key Findings....................................................................................................................................... 51
 5.2 – Applicability to other jurisdictions ................................................................................................... 52
 5.3 – Study Limitations ............................................................................................................................... 53
6. APPENDIX ....................................................................................................................... 1
 A.1 – Program Descriptions ........................................................................................................................ 2
 A.2 – NEB Definitions .................................................................................................................................... 3
 A.3 – Participant Survey Results ................................................................................................................. 4
 A.3.1 – Residential Sector Survey Results .................................................................................................. 4
 A.3.2 – Low-income Sector Survey Results................................................................................................ 5
 A.3.3 – First Nation Sector Survey Results ................................................................................................. 6
 A.3.4 – Commercial Sector Survey Results ................................................................................................ 7
 A.3.5 – Institutional Sector Survey Results ................................................................................................. 8
 A.3.6 – Industrial Sector Survey Results..................................................................................................... 9
 A.3.7 – Agricultural Sector Survey Results ............................................................................................... 11
 A.4 – Comparison of calculation methodologies for average NEB values ............................................. 12
 A.5 – Values Used to Calculate kWh/kW Ratio ......................................................................................... 15
Table of Figures

Figure 1. Study Stages ................................................................................................................... 6
Figure 2. NEBs Screening & Review Process .................................................................................. 6
Figure 3. Intention to implement more measures in next 5 years, by previous NEBs consideration
(residential sector) .........................................................................................................................21
Figure 4. Impact of experience with NEBs on likelihood of future EE activities, by previous NEBs
consideration (residential sector) ...................................................................................................22
Figure 5. Intention to implement more measures in next 5 years, by previous NEBs consideration
(non-residential sectors) ................................................................................................................29
Figure 6. Impact of experience with NEBs on likelihood of future EE activities, by previous NEBs
consideration (non-residential sectors) ..........................................................................................30
Figure 7. Previous consideration of NEBs in decision-making, by non-residential sector ................30
Figure 8. Impact of NEBs experience on future efficiency upgrades, by non-residential sector.......31
Figure 9. Intention regarding additional efficiency upgrades, by non-residential sector ..................31
Table of Tables

Table 1. Sector to program mapping ............................................................................................... 4
Table 2. NEBs Included in Participant Surveys, along with MROC relevance rating ........................10
Table 3. Data Used in the Study .....................................................................................................14
Table 4. Summary of Participant NEBs values and ranking by Sector ($ per gross first year kWh) .17
Table 5 Contextual questions summary – residential sector ...........................................................20
Table 6. Quantified Residential, Low-income, and First Nation NEBs ..............................................22
Table 7. Contextual questions summary, non-residential sectors ....................................................28
Table 8. Quantified Commercial, Institutional, Industrial, and Agricultural NEBs ..............................32
Table 9. Current Consideration of NEBs in IESO Cost-Effectiveness Tests......................................42
Table 10. Recommended Inclusion of NEBs in Cost-Effectiveness Tests.........................................43
Table 11. Inclusion of NEBs in Cost-Effectiveness Tests in Other Jurisdictions ...............................47
Table 12. Inclusion of Utility NEBs in California and Massachusetts Cost-Effectiveness Testing ......48
Table 13. kWh/kW Ratios for Application of NEBs to Demand Savings ...........................................49
1. INTRODUCTION

 | buildings • renewables • mobility
Introduction

Conservation and Demand Management (CDM) programs can offer participants significant value beyond
energy savings. Identifying and understanding these non-energy benefits (NEBs) can help CDM program
administrators to design and market programs in a manner that best resonates with target participants.
Quantifying NEBs (either directly or through generic adders) enables the inclusion of these non-energy
impacts streams in program cost-effectiveness testing.

While NEBs are generally recognized amongst CDM professionals to be strong motivators for CDM
program participation, NEBs are notoriously difficult to evaluate. Among the very few studies on NEBs
quantification completed to date, findings suggest that participant NEBs can exceed the value of energy
savings, sometimes considerably.

1.1 – Study Context
In 2015, the IESO adopted a 15% NEB adder alongside the implementation of the Conservation First
Framework (CFF). In 2018, the IESO sponsored the NEB Study Phase I (“Phase I Study”) which compiled
NEB values that had been quantified in other jurisdictions, adapted them to the Ontario context, then
compared these values to the adder. The study found that using a global adder of 15% appropriately
represents NEBs at the portfolio level but does not provide nuance or granularity of program-level cost-
effectiveness. The Phase I study recommended future NEB research in Ontario to collect data from a
customer-centric or market perspective and to quantify NEBs in a way that supports IESO cost-
effectiveness calculations.

In 2018, the IESO published the findings of the CFF mid-term review. The report considered the use of
NEBs when assessing programs and recommended that the IESO ensure that the application of NEBs, in
particular societal benefits, is congruent with the IESO’s Cost-Effectiveness guidelines.

Building upon both the Phase I Study and the results of the CFF Mid-Term Review, IESO engaged Dunsky
Energy Consulting (“Dunsky”) in early 2020 to undertake this study, referred to as the Non-Energy
Benefits Study Phase II (“Phase II Study”).

1.2 – Research Objectives
The Phase II study assesses the NEBs associated with the implementation of energy efficiency projects
funded by the IESO over the 2017-2019 period. Specifically, the study objectives were threefold:

 • To better understand qualitative aspects of sector-specific NEBs and identify how NEBs can be
 used to inform program design, marketing, and policy objectives;

 • To quantify Ontario-specific NEBs at the sector-level where possible; and

 • To ensure the appropriate application of quantified NEBs in cost-effectiveness testing.

 | buildings • renewables • mobility 2
1.3 – Study Scope
1.3.1 – NEB Categories
NEBs are generally grouped into three categories based on the benefit recipient: participant, utility, and
societal. The focus of this study was on identifying and quantifying participant NEBs.

In addition, the study also included three societal NEBs:

 • Quantification of illness and mortality costs of avoided air pollution (across all sectors)

 • Qualitative research on two societal NEBs within First Nation Communities specifically: (a)
 education and capacity building; (b) reduced reliance on fossil fuels

Utility NEBs were outside of the scope of this study, although recommendations for future consideration of
utility NEBs are included in the Cost-Effectiveness Framework Recommendation section.

 Understanding and using NEBs
 NEBs can be subjective

 While some types of NEBs (e.g. reduced spoilage) may lend themselves to objective quantification, other
 NEBs (e.g. thermal comfort, reduced financial stress) are inherently subjective. All participant NEBs
 presented in this study are based on participants self-reported perception of the value of NEBs they
 experienced from the efficiency measures installed through the CDM programs in 2017-2019.

 Previous studies have found subjective benefits, including the NEBs quantified in this study, to be highly
 valued by participants. Some jurisdictions choose to use these values primarily for program design,
 marketing, and customer targeting rather than in cost-effectiveness testing 5. Other jurisdictions do include
 subjective or ‘soft’ NEBs in cost-effectiveness testing 6. This report highlights many potential uses for the
 Ontario-specific NEBs values stemming from this Phase II study, including marketing, program design and
 policy support. The report also includes an overview of how these NEBs could be applied in cost-
 effectiveness testing.

 NEBs may not be mutually exclusive

 NEBs are often inter-related and may not be mutually exclusive. Some (but not all) previous studies have
 chosen to address the potential for overlap between NEBs by scaling down the NEBs reported by
 participants (to equal the total value of energy savings, for example). This study does not scale NEBs to
 account for potential overlap between different NEBs– it includes the full value of NEBs reported by

5
 NMR Group, Inc. (2011). Massachusetts Special and Cross-Sector Studies Area, Residential and Low-Income Non-Energy
Impacts (NEI) Evaluation. Available at this link
6
 Lawrence Berkeley National Laboratory. (2020). Applying Non-Energy Impacts from Other Jurisdictions in Cost-Benefit
Analyses of Energy Efficiency Programs. Available at this link.

 | buildings • renewables • mobility 3
surveyed participants. There is a recommendation, however, to cap the total NEBs value when undertaking
 cost effectiveness testing. This recommendation is discussed in greater detail in Chapter 4.

1.3.2 – Sectors and Programs
The study included seven sectors: Residential; Low-income; First Nation; Commercial; Institutional;
Industrial; and Agricultural. A participant dataset including contact information and participant savings was
developed based on 2017-2019 energy efficiency projects completed through six of the IESO’s Save on
Energy programs, as seen in the table below. Descriptions of these programs are included in the
Appendix. The participant dataset was not granular enough to enable sampling at the subsector level. All
quantified NEB results are provided at the sector level however some qualitative insights are provided for
specific sub-sectors.

For the purposes of this study, the First Nation sector is limited to First Nation households in on-reserve
communities, which is the eligibility criteria for the IESO’s First Nation Conservation Program. We
acknowledge that there are also First Nation individuals who live in off-reserve communities and who may
have participated in one or more of the IESO’s other residential programs, however the IESO does not
collect racial or ethnic data from program participants. We also note that while the Home Assistance
Program is limited to Low-Income households, the Heating & Cooling Program is not income qualified. As
such, it is possible that some participants in the Heating & Cooling Program could be from low-income
households.

Table 1. Sector to program mapping

 Small Process
 Heating & Home First Nations
 Business Retrofit Systems &
 Sector Cooling Assistance Conservation
 Lighting Program Upgrades
 Program7 Program Program
 Program Program
 Residential ✓
 Low-Income ✓
 First Nation ✓
 Commercial ✓ ✓
 Institutional ✓ ✓
 Agricultural ✓ ✓
 Industrial ✓ ✓ ✓

7
 The survey team developed the residential sector survey sample and gathered per participant gross savings values from a
database of past Heating and Cooling Program participants. When the surveyors verified which measures each survey
participant had installed, however, measures from the Instant Discount program were noted by some participants (including
lighting). Although the survey sample was developed using the Heating and Cooling program, participants who had also
participated in the Instant Discount program considered all measures that they had installed through both programs when
quantifying the NEBs that they had experienced. For those participants, the study team augmented the per participant gross
savings values from the Heating and Cooling program database to include savings from the measures installed from the
Instant Discount program by each participant using the IESO Prescriptive Measures and Assumptions List (April 2020).

 | buildings • renewables • mobility 4
2. METHODOLOGY

 | buildings • renewables • mobility 5
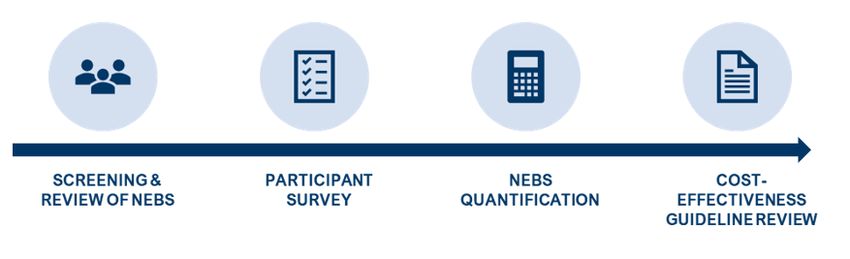
Methodology

Our approach for conducting the Phase II Study included four main stages, as seen in Figure 1. Below, we
outline the methodology used in each of these stages.

Figure 1. Study Stages

2.1 – Screening & Review of NEBs
Phase I of the project identified potential in-scope
NEBs to include in future research. To keep the Figure 2. NEBs Screening & Review Process
participant surveys a manageable length, the
first stage of the Phase II project – Screening and
Review of NEBs – included several steps to
prioritize which NEBs to include in the participant
surveys. First, the project team refined the in-
scope NEB lists identified in the Phase I Study for
the industrial and agricultural sectors. The team
then reviewed the lists with the IESO to ensure
that the NEBs were not already accounted for in
IESO cost-effectiveness testing (in which case
they were excluded from further study). Next, the
study team held an Market Research Online
Community (MROC) survey where sector-
specific experts reviewed the lists to prioritize
which NEBs to include in participant surveys.
Following the MROC survey, the project team
completed an additional screening process to
ensure all NEBs were suitable to include in a
participant survey and to finalize the 3-5 NEBs to
be quantified for each sector.

These steps are described in detail in the sub-sections that follow.

 | buildings • renewables • mobility 6
2.1.1 – Identify in-scope NEBs
The Phase I Study was used as the basis for scoping which NEBs should be included in this Study, with
two notable refinements. The Phase I Study identified NEBs for all sectors in this study, except for the
agricultural sector. The Phase I Study also recommended that industrial sectors NEBs should be reviewed
in future work due to limited previous NEBs research specific to the that sector. Below we describe the
approach we took with each of these sectors to identify additional in-scope NEBs for consideration.

Industrial NEBs
As part of a previous project, the Dunsky team completed research focused on industrial sector barriers to
participating in energy efficiency programs and the types of benefits, including NEBs, that can promote
industrial participation. From this research, the team developed guidelines for program design strategies
on behalf of EfficiencyOne in Nova Scotia8. This research included detailed interviews with 20 industrial
customers and with 7 program administrators in jurisdictions across North America. The key themes that
emerged from this research included the importance of competitiveness, pressure from global trade, and
a core focus on productivity.

With these previous research findings in mind, we reviewed the Phase I Study NEBs list and
recommended the addition of a NEB for business competitiveness for the Industrial Sector.

Agricultural NEBs
As a starting point, the project team drew from the lists of recommended in-scope NEBs for the
commercial, institutional, and industrial sectors. The team then met with IESO staff familiar with the
agricultural sector to understand which programs agricultural customers participate in, which measures
they install, and additional NEBs that may be relevant. As a result of these conversations the project team
included additional NEBs, some of which were selected as top-ranked NEBs by the experts as part of the
MROC survey (e.g. increased crop, livestock productivity and/or improved health). Overall, the agricultural
sector NEBs had a high degree of consensus among the community experts, and few additional NEBs
were recommended by experts beyond what was included in the in-scope list and identified through
conversation with the IESO.

The in-scope lists for all sectors were reviewed once more with the IESO to ensure that they did not
include NEBs already assessed by the IESO. The finalized lists of NEBs were included in the MROC
survey, described in the next sub-section.

2.1.2 – Market Research Online Community Survey
The goal of the Market Research Online Community (MROC) Survey was to gather sector-specific NEBs
insights from a broad range of sector experts, including those representing industry organizations,
advocacy groups, consultants, and more. This information allowed the project team to compile qualitative

8
 Dunsky Energy Consulting. (2019). Industrial Energy Efficiency: Trends, Barriers, and Strategies. Available at this link

 | buildings • renewables • mobility 7
insights about the NEBs while also narrowing down the 'in-scope' list of NEBs for inclusion in the
participant surveys.

The MROC Survey included three days of activities held over two weeks and used a Delphi panel
approach. During each day of activities, participants were shown the responses collected during the
previous session from other experts, allowing them to reflect on the feedback provided by others and
adjust their responses if desired. The goal of this approach was to reach consensus or convergence on
the research question. In this case, experts were asked to identify the 'most relevant' NEBs for each
sector, with relevance defined as:

 • Value from the perspective of an energy efficiency program participant

 • Importance from a marketing perspective

 • Importance from a policy perspective

Experts were also asked to provide qualitative insight on NEBs identified as most relevant. In addition to
providing feedback on the in-scope NEBs lists, experts were also able to suggest novel NEBs that had not
been included in the original sector-specific lists. In subsequent sessions, other experts were shown these
novel NEBs and could provide their feedback on their relevance.

Following the three days of survey activities, each NEB was classified into one of four categories:

 • Top-ranked NEB: Those ranked as very relevant for the sector with a high degree of expert
 convergence

 • Very relevant NEB: Those ranked as very relevant for the sector with a lesser degree of expert
 convergence

 • Less relevant NEB: Those ranked as less relevant for the sector

 • Not relevant NEB: Those ranked as not very relevant for the sector

2.1.3 – Final NEBs Screening
Following the MROC survey, the project team completed a final screening to develop shortlists of three to
five NEBs for each sector that would be used for the participant surveys. To undertake this final screening,
we used the following methodology:

 1. Start with 'Top-ranked NEBs'
 2. Check that all 'Top-ranked NEBs' are quantifiable through participant surveys (eliminate those that
 are non-quantifiable) (relevant for novel NEBs suggested by experts in the MROC survey)

 | buildings • renewables • mobility 8
3. Review 'Top-ranked NEBs', applying professional judgement to authenticate the results of the
 MROC survey (ensuring no redundancy, ensuring experts understood how NEB was defined, etc.)
 4. If more NEBs are required (i.e. there are fewer than three NEBs after completing step 3), select
 additional 'Very relevant NEBs' through the following process:
 a. Check that they are quantifiable (eliminate non-quantifiable)
 b. Check for likelihood of significant variance between jurisdictions (prioritize NEBs more
 likely to be Ontario specific)
 c. Check for likelihood of significant variance between measures (prioritize those with more
 variance between measures)
 d. Check for additional considerations
 5. If more NEBs are required following Step 4, repeat Step 4 process with the 'Less relevant NEBs'
 6. If more NEBs are required following Step 5, repeat Step 4 process with the 'Not relevant NEBs'
 7. For all selected NEBs, check for likelihood of significant variance across sub-sectors/segments
 (consider splitting by segment if significant variance is expected)
Using this screening process, we developed final lists of three to five NEBs for each sector to be included
in the participant surveys, shown in the table below.

 | buildings • renewables • mobility 9
Table 2. NEBs Included in Participant Surveys, along with MROC relevance rating9

 (Community)
 Low-income

 (Participant)

 Commercial

 Agricultural
 Institutional
 First Nation

 First Nation
 Residential

 Industrial
 Reduced financial Top Top Top Top
 stress ranked ranked ranked ranked
 Improved thermal Top Top Very Less/Not Less/Not Very
 comfort ranked ranked relevant Relevant Relevant relevant
 Reduced building Very Top Less/Not
 Top
 & equipment relevant ranked Relevant
 ranked
 O&M10
 Improved indoor Very Top Very Top Less/Not Very
 air quality relevant ranked relevant ranked Relevant relevant
 Sense of control
 Very
 over energy
 relevant
 decisions
 Improved lighting Very
 levels relevant
 Education and Top
 capacity building ranked
 Reduced reliance Top
 on fossil fuels ranked
 Top Less/Not
 Reduced spoilage
 ranked Relevant
 Improved business Top Top
 outcomes ranked ranked
 Improved product Very
 quality relevant
 Total NEBS in
 5 3 4 3 4 3 3 4
 Participant Survey

9
 Appendix Section A2 - NEB Definitions includes definitions for all NEBs included in the participant survey.
10
 O&M stands for Operations & Maintenance.

 | buildings • renewables • mobility 10
2.2 – Participant Survey
Dunsky’s market research partner, Ad Hoc Research, conducted telephone and online surveys with past
program participants to determine the value of NEBs benefits that they realized by installing program
measures. The surveys used two different types of questions to gauge non energy benefits:

 • Relative scaling11: Relative scaling questions ask participants to state the value of an item of
 interest relative to some base. For this survey, we asked participants to state the value of each
 NEB relative to the annual electricity bill savings that they estimated or (if they could not estimate
 savings) their annual electricity bill.

 • Willingness-to-pay12: Willingness-to-pay questions ask participants to assign the dollar value they
 would be willing to pay for the item of interest. In this case, we asked participants what they would be
 willing to pay for each relevant NEB.

All survey respondents were asked to value all NEBs (for their given sector) using both techniques. The
data collected from these questions was used quantify the NEBs – a process described in greater detail in
the following section.

 The COVID-19 Pandemic
 It should be noted that the survey was fielded during June 2020 amidst the COVID-19 pandemic. It
 is possible that this may have influenced how some survey respondents valued some NEBs. Possible
 impacts of the pandemic on survey results may include, among others:
 • Higher than usual residential NEBs for the residential sector due to stay-at-home orders
 • Underrepresentation of some commercial segments (e.g., restaurants) due to closures or
 other hurdles
 • Lower or higher than usual NEBs for the commercial and institutional sectors due to
 underused office space, increased concerns about air quality due to COVID, etc.

11
 In a review of the application of non-energy benefits in cost-effectiveness tests, Skumatz et al. (2014) found relative scaling
questions to be easiest for participants to understand, and to provide consistent responses. Relative scaling questions were
recommended as a best practice for quantifying NEBs. This study is available at this link.
12
 In the same study by Skumatz et al. (2014), willingness-to-pay questions were found to benefit from the fact that they
provide dollar values, requiring no interpretation to arrive at quantified values. They were found to be somewhat more
confusing to participants and to provide more inconsistent or volatile responses than relative scaling questions, however. For
this study, willingness-to-pay questions are included to provide another, secondary data point to quantify NEBs alongside the
relative scaling questions.

 | buildings • renewables • mobility 11
2.3 – NEBs Quantification
2.3.1 – Participant NEBs Quantification
Using the survey responses from above, we took the total sector-level NEB value across all participants
and divided it by the total gross savings values across all participants. This calculation was completed for
each individual NEB using both Relative Scaling and Willingness to Pay NEB values. For example, for
respondents of the residential sector survey we quantified 10 different NEB values (5 NEBs times two
questioning techniques per NEB).

In some cases, participants responded either 'don't know' or valued a NEB at zero when asked to value a
NEB using one valuation approach but provided a non-zero value when asked using the other valuation
approach. These values were not considered to be true zeros – rather, they pointed to participants having
difficulty responding to the question. To ensure the responses from these participants were considered,
we calculated hybrid values (using the responses provided to the relative scaling question for some
participants and the responses provided to the willingness-to-pay question for others). These hybrid
values are more representative of the sample as they include all participants that responded to at least
one of the two questions with a non-null value. We considered two approaches for determining hybrid
values:

 • Hybrid, relative scaling priority – in which we give priority to the relative-scaling response value
 given the preference for this approach in previous NEBs research11. In this approach, we only
 consider the willingness-to-pay if the participant did not answer the relative scaling question.

 • Hybrid, minimum approach – in which we consider the lowest non-null response between the
 relative scaling and the willingness-to-pay questions.

All values included in the report, as based on the hybrid, minimum approach. While previous
NEBs research has demonstrated a preference for relative scaling questions, we acknowledge the
inherent challenges with estimating NEBs and that significant variability in NEB values (across different
studies/jurisdictions) may hinder their use in cost effectiveness testing and/or their acceptance by
stakeholders and decision-makers. As such we recommend using the Hybrid, Minimum Approach, which
by design will provide the more conservative estimates of NEB values. In the Study Conclusions Chapter,
we reiterate that this approach is likely underestimating the true value of NEBs and as such great care
should be taken to avoid any further scaling or discounting of these NEB values. We also include the
values calculated using the Hybrid, relative scaling priority approach in the appendix for reference.

It should also be noted that all NEBs quantified in this report reflect the value of the NEB across the
surveyed sector population as a whole, not just among those who reported experiencing the particular
NEB. Those survey respondents who reported that they had not experienced a given NEB were assumed
to have valued the NEB as $0 and were included when calculating the overall value. The measures
installed by participants included in the surveyed population are outlined in the Appendix and should be
considered when applying NEBs or comparing them to findings from other jurisdictions.

 | buildings • renewables • mobility 12
As a final step we calculated the sector-level average value ($/kWh) for each NEB weighted by energy
savings across all participants.

 Alternative methodology for calculating sector-level average NEBs
 Our primary method for calculating sector-level NEBs values ($/kWh) – as described above - was to
 calculate the sector-level NEB based on a weighted average of energy savings across all
 participants. This approach does not give equal weighting to all program participants, but rather to
 the total energy savings achieved in the programs.
 An alternative approach was also considered, wherein we calculated the normalized NEB value
 ($/kWh) for each participant and then simply averaged that value across all participants. This
 approach gives equal weighting to all program participants, regardless of the volume of energy
 savings they achieved through program participation.
 A comparison of results using both calculation methods is included in the Appendix. Given that the
 NEBs will be applied to each unit of energy savings in cost-effectiveness testing at the program level
 (and not to each program participant), our recommendation is to use the first approach (weighted
 averages based on savings).
 If NEBs were to be applied on a participant-by-participant basis, values that were normalized by
 participant would be more appropriate. Broad application of the NEBs calculated in this study on a
 per participant basis is not recommended, however. We calculated the values at the sector-level
 according to the population-wide mix of measures installed. The mix of measures installed by any
 one participant are expected to vary from the mix of measures installed across the population, and
 therefore expected to result in different valuation of NEBs.

2.3.2 – Societal NEBs quantification (reduced air pollution)
As part of the review of NEBs, the study team assessed the benefits associated with reduced air pollution,
and consequently avoided public health costs.

This assessment was completed in four steps:

 1. Review the validity of the approach proposed in the Phase I Study
 2. Update this value with the latest available data
 3. Provide IESO staff with guidance on how to update this value going forward
 4. Provide direction on how this value could be made more precise

Additional detail around these steps and the results of the assessment are provided in the Illness Cost
of Air Pollution section.

 | buildings • renewables • mobility 13
Additional Societal NEBs
 Only one societal NEB - the benefits of reduced air pollution discussed above – was quantified in the
 Study. This limited assessment of societal NEBs should not be interpreted as an indication that
 societal NEBs are inherently limited in scope or scale, but rather is a function of the primary focus for
 the Phase II study being participant NEBs. Other societal NEBs such as macroeconomic benefits
 (including jobs impacts) could be assessed through future research.

2.4 – Cost-Effectiveness Guideline Review
The IESO currently applies a 15% multiplier to benefits for two of the cost-benefit tests included in the
IESO Conservation & Demand Management Energy Efficiency Cost Effectiveness Guide (the IESO CE
Guide): the Total Resource Cost Test and the Societal Cost Test. The project team reviewed this practice
and assessed practices in other jurisdictions to determine if it could be refined in light of the findings from
the Phase II Study. The results of this review are included in the Cost-effectiveness Framework
Recommendations section.

2.5 – Summary of data sources and uses
The table below summarizes the key data sources and uses for this study.

Table 3. Data Used in the Study

 Data Description Uses in Study
 Based on the results of a jurisdictional scan,
 Phase I 'In- the Phase I Study identified a list of potential Primary source of NEBs for inclusion in expert
 Scope' NEBs 'in-scope' NEBs to consider for future MROC survey.
 quantification research by IESO.
 Results were used to identify the NEBs to include in
 During the survey, experts prioritized the
 MROC survey the participant survey. Other qualitative sector-
 NEBs for further study and provided
 Results specific insights about the NEBs are highlighted
 qualitative insights.
 throughout this report.
 The datasets were used to develop the survey
 Program sample and the source of contact information for
 The IESO provided program participant
 participation past program participants. The datasets also
 datasets spanning the 2017-2019 period.
 datasets provided per participant program savings values
 (kWh) which were used to normalize the NEBs.
 Participant surveys were completed for all
 seven sectors in the study. The surveys The per participant quantified NEBs values were
 asked past program participants to quantify combined to calculate sector-wide average values.
 Participant
 any NEBs they had realized from installing The qualitative information provided by participants
 survey results
 measures through IESO-funded programs is included throughout the report and provides
 and to share qualitative information about additional sector-specific context.
 their experience.

 | buildings • renewables • mobility 14
Data Description Uses in Study

 Several data sources were used to calculate
 the societal value of air pollution NEB:
 Illness Cost of 1) Public health valuation of air
 This data was combined to calculate the air pollution
 Air Pollution pollution in Ontario13
 NEB value.
 Data 2) Proportion of air pollution
 attributable to power generation14
 3) Total electricity generation in ON15

13
 Health Canada. (2019). Health impacts of air pollution in Canada. Available at this link.
14
 Environment and Climate Change Canada. (2018). Canada's Air Pollutant Emissions Inventory. Available at this link.
15
 Canada Energy Regulator. (2020). Canada’s Energy Future 2020 Data Appendices. Available at this link.

 | buildings • renewables • mobility 15
3. RESEARCH FINDINGS

 | buildings • renewables • mobility 16
Research Findings

3.1 – Summary of findings: participant NEBs
Table 4 below presents the rankings and values of participant NEBs within each sector based on the
hybrid minimum $/kWh valuation. Blank cells indicate that the NEB was not prioritized for a given
sector during the Screening & Review phase of the study and therefore was excluded from participant
surveys for that sector.

Table 4. Summary of Participant NEBs values and ranking by Sector ($ per gross first year kWh)

 First Nation
 Residential Low-income Commercial Institutional Industrial Agricultural
 (Participant)

 Reduced 4 1 2
 financial stress ($0.03) ($0.09) ($0.090)
 1 2 1 2 2 2
 Thermal comfort
 ($0.11) ($0.08) ($0.092) ($0.05) ($0.25) ($0.003)
 Reduced
 5 1 3 2
 building &
 equipment O&M ($0.02) ($0.08) ($0.11) ($0.03)

 Improved indoor 3 3 4 3 1 3
 air quality ($0.05) ($0.02) ($0.06) ($0.007) ($0.27) ($0.002)
 Sense of control
 2
 over energy
 decisions ($0.06)

 Improved 3
 lighting levels ($0.08)
 Reduced 4 4
 spoilage ($0.0002) ($0.001)
 Improved
 1 1
 business
 outcomes ($0.04) ($0.09)

 Improved 3
 product quality ($0.01)
 Total (depends
 $0.05 - $0.09 - $0.09 – $0.08 – $0.11 - $0.09 -
 on specific $0.08
 $0.27 $0.19 $0.32 $0.14 $0.63 $0.10
 measures)16

As can be seen from the table above, some NEBs are valued highly across multiple sectors – notably
thermal comfort, which ranked either first or second place for the majority of surveyed sectors. This
indicates the broad market appeal of this NEB. There is considerable variation between sectors,

16
 Some NEBs are specific to certain measures (e.g. improved lighting levels). The total NEB value therefore
depends on the measures offered within a given program.

 | buildings • renewables • mobility 17
however. This variation is in terms of a) NEBs identified as relevant to each sector (and therefore
included in the participant survey), and b) NEBs rankings between sectors.

 Marketing Insight
 Thermal comfort was assigned high value across all sectors, indicating broad appeal of marketing
 campaigns focused on this NEB. Specific marketing messages will vary by the sector being
 targeted, but may highlight improved thermal comfort for participants and their families (for the
 residential, low income, and First Nation sectors) or for customers or employees (for the commercial,
 institutional, industrial, and agricultural sectors).

Each sector has a unique combination of NEBs, supporting the sector-specific granularity of this study.
For example, among non-residential customers, the industrial and agricultural sectors include a
different mix of NEBs compared to commercial and institutional – an interesting finding given that
individual non-residential sectors have had very limited sector-specific NEBs research in the past. Even
those sectors with a similar NEB mix (for example, commercial and institutional) show differences in
their NEBs rankings: reduced operations and maintenance ranks first for the commercial sector,
whereas it ranks third in the institutional sector. For those NEBs that are found across multiple sectors,
there is also considerable variation in absolute NEBs values between sectors.

Potential driving factors behind the results in each sector are explored in greater detail below.

 Understanding and interpreting NEB values
 The NEB values shown in Table 4 must be considered in light of the NEB identification and
 assessment methodology set out in the previous chapter. Below we provide additional context for
 these NEB values based on the study scope and approach.
 The values do not reflect all possible participant NEBs that can result from energy
 efficiency. The NEBs included in this study were limited to those resulting from the installation of
 specific measures by participants in IESO-funded energy efficiency programs over the 2017-2019
 period. Energy performance building certifications, for example, have been shown to provide
 commercial property owners with notable NEBs such as market value improvements (sales price,
 rental income, lower vacancy rates) and green attractiveness (e.g. marketing/branding, employee
 attraction/retention). While the energy efficiency upgrades undertaken through the Save on Energy
 programs would likely support building certification, it is unlikely that survey participants would
 attribute the NEBs associated with building certification to the individual measures installed through
 IESO programs.
 The values do not reflect all NEBs stemming from these specific IESO programs studied. To
 keep the participant surveys to an acceptable length, we limited the survey to 3-5 NEBs per sector.
 The MROC survey played a critical role in screening and prioritizing the most relevant NEBs for each
 sector.

 | buildings • renewables • mobility 18
The values for each NEB reflect the weighted average across the surveyed sector
 population as a whole, not just among those who reported experiencing the particular
 NEB. Those survey respondents who reported that they had not experienced a given NEB were
 assumed to have valued the NEB as $0 and were included when calculating the overall value. The
 measures installed by participants included in the surveyed population are outlined in the Appendix
 and should be considered when applying NEBs or comparing them to findings from other
 jurisdictions.

3.2 – Residential, Low-income and First Nation Sectors
This section summarizes qualitative insights and valuation results for the residential, low-income, and First
Nation sectors.

3.2.1 – Experience with NEBs
The online participant survey included contextual questions focused on decision-making around measure
installation, the experience of NEBs, and plans for future energy efficiency measure installation. The phone
survey (used for the low-income and First Nation sectors) was a similar format to the online survey but with
fewer contextual questions aimed at reducing survey time. As a result, only residential contextual
responses were collected and are included below.

The results of these contextual questions for the residential sectors are summarized in the table below.

 | buildings • renewables • mobility 19
You can also read