NSW Electricity Strategy - NSW Electricity Strategy
←
→
Page content transcription
If your browser does not render page correctly, please read the page content below
NSW Electricity Strategy

NSW Electricity Strategy
Introduction
The NSW Electricity Strategy is the NSW Government’s plan for a reliable, affordable and
sustainable electricity future that supports a growing economy. There are numerous challenges to
achieving this future. Some arise from the fact that the State’s existing fleet of power stations are
reaching the end of their technical lives, which is increasing reliability risks to the system. Others
arise from congestion in the transmission system which is dampening investment in the new
generation required to reduce electricity prices, improve reliability and protect the environment.
The NSW Government’s strategy to respond to these challenges and to achieve its objectives is to:
first, improve the efficiency and competitiveness of the NSW electricity market by reducing risk,
cost, process-driven delays and by ensuring investment in new energy saving, demand response
and generation technologies.
Second, if the market does not deliver the firm and flexible generation needed to ensure a prudent
level of capacity in the electricity system, the NSW Government will take action to address any
resulting capacity gaps in a way which also financially protects taxpayers and consumers and does
not encourage market participants to delay investment decisions to take advantage of government
action. For this purpose, the NSW Government will set an Energy Security Target of capacity
sufficient to satisfy a one in ten year peak demand with a buffer equal to the capacity of the State’s
two largest generating units.
Third, the NSW Government will ensure it has the powers it needs to deal with electricity
emergencies, if they arise.
This Strategy will support an estimated $8 billion of private investment in NSW’s electricity system
over the next decade. For households, the Strategy will lead to estimated bill savings of $40 per
year. This Strategy is estimated to result in 1,200 new jobs, most of which are expected to be in
regional NSW. Implementing the Strategy will lead to a $3.4 billion net economic benefit and
support cleaner air for NSW.
This Strategy is designed to complement the work of the national energy market bodies. NSW is
part of a national electricity system and the NSW Government’s preference is for national solutions
to issues facing the electricity system. This Strategy sets out actions to address the specific needs
of NSW while long term national reforms are developed and implemented. Its purpose is to provide
certainty to investors and foster community confidence about how the NSW Government will
improve the affordability and reliability of the electricity system while also protecting the
environment.
The Strategy is set out in six parts: Part 1 explains how the electricity system operates; Part 2 sets
out the key trends in the electricity system; Part 3 sets out existing NSW Government and national
initiatives and reforms; Part 4 sets out the NSW Government’s objectives for the electricity system;
Part 5 sets out the NSW Government’s plan to achieve them; and Part 6 sets out how the Strategy
applies to NSW today.

                                                                         NSW ELECTRICIT Y STRAT EGY | 1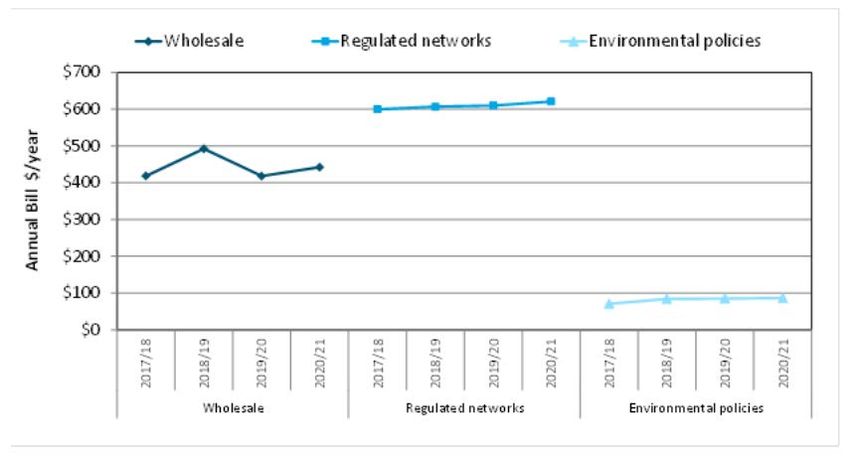
NSW Electricity Strategy

Part 1: How the electricity system operates
1.1 The structure of the electricity system
NSW is part of the National Electricity Market (NEM); a market which was established in
accordance with the Australian Energy Market Agreement (the Agreement), an intergovernmental
agreement between the Commonwealth and the relevant states and territories.
The National Electricity Law (NEL), which was legislated by the South Australian Parliament, and
the National Electricity Rules (Rules) made under it are the main laws that regulate the NEM. They
have force in NSW through the National Electricity (New South Wales) Act 1997.
The NEL confers power on three national energy market bodies to govern, operate and regulate
the NEM: the Australian Energy Market Operator (AEMO), which administers and operates the gas
and electricity markets and power systems; the Australian Energy Market Commission (AEMC),
which makes the Rules and advises on the design of the NEM; and the Australian Energy
Regulator (AER), which enforces the Rules and grants legal authorities on relevant persons
participating in the NEM.
In addition to the national market bodies, there is the Energy Security Board (ESB). The role of the
ESB is to coordinate the implementation of the reform blueprint produced by Australia's Chief
Scientist, Dr Alan Finkel AO. The ESB also provides whole of system oversight for energy security
and reliability to drive better outcomes for consumers. The ESB is comprised of an Independent
Chair, Independent Deputy Chair and the heads of AEMO, the AEMC and the AER.
Despite there being a national market, NSW has a number of schemes and powers that interact
with the electricity system. For example, the Electricity Supply Act 1995 (NSW) confers on the
NSW Government a range of powers to deal with an electricity supply emergency. It confers on the
Energy Minister information collection powers, 1 which may be used:
            (a) “to determine whether the supply of electricity to all or any part of the State has
                been, or is likely to be, disrupted to a significant degree,
            (b) to plan and prepare for the exercise of powers under this Part in the event that the
                supply of electricity is disrupted to a significant degree.”
It also confers on the Minister the power to make directions. 2 This power is only enlivened once the
Premier declares an electricity supply emergency and the Premier may only make such a
declaration if she is satisfied “that the supply of electricity to all or any part of the State is disrupted
to a significant degree” or “that there is a real risk that the supply of electricity to all or any part of
the State may be disrupted to a significant degree”. 3
The Minister has the power to issue directions: 4
            (a) “to restrict the use of electricity in order to reduce demand,
            (b) to require large users of electricity to wholly or partly turn off or shut down any plant
                or equipment for a specified period of time,
            (c) to impose requirements relating to the carrying out of activities that may affect the
                production or supply of electricity,

1
  Electricity Supply Act 1995, s 94D(1).
2
  Electricity Supply Act 1995, s 94B.
3
  Electricity Supply Act 1995, s 94A.
4
  Electricity Supply Act 1995, s 94B(2).

                                                                             NSW ELECTRICIT Y STRAT EGY | 2
NSW Electricity Strategy
(d) to impose other requirements that relate directly to the production, use or supply of
electricity.”
The power is broad: the Minister may give directions to specific persons, the general public or
sections of the community.5 However, the Minister may only make such directions that the Minister
“considers are reasonably necessary to respond to the electricity supply emergency.” 6
Another example of a NSW scheme relevant to this Strategy is the Energy Savings Scheme (ESS),
NSW’s largest energy efficiency program. The ESS is a market-based instrument requiring
Scheme Participants (NSW electricity retailers, certain generators and certain large electricity
consumers) to meet energy savings targets by buying certified Energy Savings Certificates
(ESCs).
Scheme Participants are served by a competitive market to deliver energy savings at least cost.
Through the ESS, households and businesses choosing to implement energy savings projects
(such as installing energy efficient appliances and equipment) can receive a discount or other
financial incentive. The ESS is legislated to operate until 2025 and the current target for each year
between 2019 to 2025 is 8.5 per cent of electricity demand.
The ESS reduces electricity demand to deliver affordability, reliability and emissions benefits for
everyone in NSW. Since its launch in 2009, the ESS has supported projects that will deliver more
than 27,000 gigawatt hours of energy savings. This has reduced the cost of living by saving about
$11 a year on energy bills for a typical NSW household. The ESS is also delivering $5.6 billion in
direct bill savings for households and businesses implementing energy savings projects.
By reducing demand at peak times, the ESS makes energy in NSW more reliable. In 2018, the
ESS reduced peak demand by about 450 megawatts (MW) and deferred the need for nearly $510
million of investment in power stations to supply that demand. It is also deferring an estimated
$213 million of investment in the distribution network which is driven by peak demand. Energy
savings from projects delivered under the ESS to date will avoid approximately 23 million tonnes of
greenhouse gas emissions.
1.2 How electricity is generated and transmitted to electricity
consumers
The electricity industry has four main levels:
1. generation – the production (and storage) of electricity;
2. transmission – the high voltage lines and infrastructure used to transmit electricity from
generators to substations;
3. distribution – the lower voltage electricity lines and other infrastructure which transmits
electricity from substations to electricity consumers; and
4. retail – how businesses sell electricity to households and businesses, including metering
and billing.
1.2.1 Generation
AEMO operates the electricity dispatching system. That system determines which generators
dispatch electricity into the system and when. It operates in the following way: each day is
segmented into trading intervals of five minutes. Generators submit generation dispatch offers to
5
Electricity Supply Act 1995, s 94B(3).
6
Electricity Supply Act 1995, s 94B(1).
NSW ELECTRICIT Y STRAT EGY | 3NSW Electricity Strategy
AEMO, which specify prices at which the generator is willing to dispatch certain amounts of
electricity during trading intervals. 7 Ordinarily, for each dispatch interval, each MW offered is
ranked from cheapest to most expensive. The spot price is set by the price of the last MW required
to satisfy electricity demand. 8
Generators earn revenue from this process based on how much electricity they sell, the spot
market price and transmission loss factors. 9 Loss factors account for the electrical energy that is
lost when electricity is transmitted from generators to consumers. 10
There are a range of generation technologies that have different economic, operating and technical
characteristics. Traditionally, the electricity system in NSW has been powered by coal. Coal
continues to be the primary fuel source for electricity today, generating almost 80 per cent of the
State’s electricity.
Figure 1: NSW electricity generated in 2018/19
NSW Electricity Generated 2018/19 (estimate)
3.4% 1.6% 1.7%
5.3%
1.9%
4.8%
Coal
Hydro
Gas
Wind
Small-scale solar PV
Biomass
Large Scale Solar PV
80.8%
Source: Estimates by Department of Planning, Industry and Environment 2019
Solar and wind generate electricity at low cost and without emissions. However, the ability of these
technologies to dispatch electricity is dependent on the weather and time of day. The share of wind
and solar in the NSW electricity generation mix has tripled in the past five years, with just over
7 per cent of the State’s electricity coming from wind and solar (including rooftop solar). This share
of generation is expected to grow as 14 large-scale renewable energy projects totalling about
2,100 MW currently under construction enter the market and more households install solar panels.
When households or businesses use more electricity at certain times of the day, more electricity
supply needs to be available at the same time to match that demand. Times of peak demand
represent periods during the day when the State uses the most electricity. In NSW, peak demand
7
National Electricity Rules, r 3.8.6.
8
National Electricity Rules, r 3.9.2.
9
National Electricity Rules, r 3.15.6.
10
National Electricity Rules, r 3.6.1-3.6.2.
NSW ELECTRICIT Y STRAT EGY | 4NSW Electricity Strategy
usually happens between mid-afternoon and early evening as people return home from work.
These tend to be the times when the system’s reliability is most at risk. Extreme conditions, such
as a heatwave, can place extra pressure on the system at any time of the day as more households
and businesses use energy-intensive equipment like air conditioners.
During periods of peak demand, renewable electricity generation is variable but can crucially help
add supply. According to AEMO’s 2019 Electricity Statement of Opportunities (ESOO), during
periods of customer supply shortages, wind is operating (on average) at approximately 16 per cent
of its installed capacity, and large-scale solar at 30 per cent. During the heatwave on 10 February
2017, renewable energy generation in NSW delivered 300 MW of electricity between 5pm and
6pm.
Variable renewable energy needs to be complemented by firm and flexible power. Hydroelectricity
meets these requirements by generating and storing electricity at scale. Standard hydro power
generates electricity by releasing water from an elevated reservoir but does not involve pumping
that water up again. Standard hydro is reliant on sufficient water supplies in the upper reservoir, as
there is no capability to reuse this water. Pumped hydro involves pumping water into an elevated
reservoir and releasing it to generate electricity. NSW has two pumped hydro projects –
Shoalhaven (240 MW) and Tumut 3 (1,800 MW) – and numerous smaller, standard hydro projects.
Gas-fired power stations generate electricity on demand with about half the level of emissions from
coal but, given the current high input costs of gas, are typically only operated during periods of
peak demand or when solar and wind are not generating. Gas generation can ramp up quickly,
allowing it to dispatch quickly and currently is used to generate about 5 per cent of NSW’s annual
electricity.
Batteries, as a form of electrical storage, also provide multiple grid services such as frequency
regulation. The cost of batteries has fallen in recent years and is expected to continue to trend
downwards making batteries a more feasible, commercial firming option for wind and solar farms.
It is also appropriate to note that the generation of electricity can release substances that are
harmful to human health, including but not limited to particulate matter (PM), nitrogen oxides (NOx)
and sulfur oxides (SOx). Each year, according to the Health Risk Assessment report 2013 11 overall
air pollution leads to 520 premature deaths and 1,180 hospital admissions in Sydney, and an
estimated $6.4 billion in health costs in the NSW Greater Metropolitan Region.
The electricity sector contributes 88 per cent of SOx emissions and 53 per cent of NOx emissions,
as well as 5 per cent of direct particulate matter (PM 2.5) emissions in the Greater Metropolitan
Region. SOx from power stations mix in the atmosphere to form secondary particles and produce
close to 20 per cent of fine particle pollution at Richmond in Sydney’s north-west each year.
Coal-fired power stations in NSW have controls to filter direct particle pollution under existing
regulation but no comparable controls for NOx or SOx. Historically, SOx from power stations has
been regulated by limiting sulphur content of the coal burnt, rather than by regulating emission
standards. Coal-fired power stations located in all three major generating regions – the Upper
11
Morgan, G, Broome, R and Jalaludin, B (2013), Summary for policy makers of the health risk assessment
on air pollution in Australia. Prepared for the National Environment Protection Council, Canberra,
https://www.environment.gov.au/system/files/pages/dfe7ed5d-1eaf-4ff2-bfe7-dbb7ebaf21a9/files/summary-
policy-makers-hra-air-pollution-australia.pdf
NSW ELECTRICIT Y STRAT EGY | 5NSW Electricity Strategy
Hunter, Central Coast and Lithgow – are likely contributors to fine particle levels in the Greater
Metropolitan Region. 12
In combination, these different forms of electricity generation need to provide sufficient
dispatchable capacity to meet NSW peak demand. The forecast summer maximum peak using 1-
in-10 year demand for NSW in 2019-20 is 14,373 MW 13, representing the maximum amount of
electricity required for dispatch during extreme conditions experienced every 1-in-10 years.
Figure 2: NSW historical annual peak demand
NSW Annual Peak Demand (MW)
16000
14000
Peak Demand (MW)
12000
10000
8000
6000
4000
2000
0
Source: AER regional peak demand statistics
The NSW Government has adopted a technology neutral approach as to how electricity is
generated to meet peak demand. However, both NSW and Commonwealth laws prohibit the
development of nuclear power stations. 14
1.2.2 Transmission
In NSW, the transmission system is owned and operated by TransGrid. TransGrid is licensed
under the Electricity Supply Act 1995 as the transmission operator. 15 Under its licence, TransGrid
12
Scorgie Y, Mazaheri M, Chang L, Ryan L, Fuchs D, Duc H, Monk K and Trieu T (2019), Air Quality and
Public Health Co-benefits of Implementing Energy Efficiency and Clean Energy Measures in New South
Wales Final Report, report prepared by the NSW Office of Environment and Heritage.
13
AEMO, Electricity Statement of Opportunities (2019), https://www.aemo.com.au/-
/media/Files/Electricity/NEM/Planning_and_Forecasting/NEM_ESOO/2019/2019-Electricity-Statement-of-
Opportunities.pdf
14
Uranium Mining and Nuclear Facilities (Prohibitions) Act 1986 (NSW), s 8(2); Environment Protection and
Biodiversity Conservation Act 1999 (Cth), s 21 with s 140A.
15
Electricity Supply Act 1995 NSW, s 93A and ‘Transmission Operator’s Licence’ under the Electricity
Supply Act 1995 (NSW) granted to NSW Electricity Networks Operations Pty Limited (ACN 609 169 959) as
trustee for the NSW Electricity Networks Operations Trust’ (2015) available at:
https://www.ipart.nsw.gov.au/files/sharedassets/website/shared-files/licensing-administrative-licence-
transmission-operator-transgrid/transgrid-operating-license-consolidated-licence-conditions-from-november-
2017.pdf
NSW ELECTRICIT Y STRAT EGY | 6NSW Electricity Strategy
must ensure that its transmission system complies with reliability and performance standards
issued by the NSW Minister for Energy from time to time. 16 The current standard sets out the
maximum allowable amount of expected Unserved Energy (USE) arising from various elements of
the transmission system each year. 17
In lieu of a competitive transmission market, TransGrid earns a regulated return on its investment
in transmission infrastructure and services. There are two key regulatory tests that apply to
TransGrid: first, a 5-yearly revenue determination to determine its regulated return on existing
transmission infrastructure and proposed transmission infrastructure required to meet identified
transmission needs. 18
Secondly, the Regulatory Investment Test for Transmission (RIT-T), which is a cost-benefit
analysis undertaken to approve new, major transmission infrastructure projects. 19 The RIT-T
involves a series of reporting, consultation and dispute processes 20 that typically takes at least one
year to progress, in addition to the time required to undergo other planning and environmental
assessments. 21 TransGrid’s revenue determination may include contingent projects that, if certain
trigger events are satisfied (including typically a successful RIT-T), can be added to its revenue
determination. 22
In April 2019, the Rules were amended to streamline the RIT-T process for three of AEMO’s 2018
Integrated System Plan (ISP) projects – the Queensland-NSW interconnector (QNI), the
Victoria-NSW Interconnector (VNI) and the South Australia-NSW interconnector (EnergyConnect)
– to allow some of the RIT-T steps to run concurrently for these three projects.23
1.2.3 Distribution
As part of its revenue determination, the AER approves the amount that TransGrid can recover
from distributors for the provision of transmission services. 24 Distributors are subject to similar
regulated revenue tests to recover the cost of the distribution services they provide. 25 The AER
approves the tariffs distributors can charge retail customers, including transmission and distribution
costs. 26
1.2.4 Retail and household bills
Households and small businesses buy electricity from a retailer, not the wholesale market.
Retailers offer households and small businesses a retail contract for supplying electricity. A typical
retail bill in 2018-19 comprised of:
1. wholesale costs (38 per cent), being the cost of electricity generation
2. network costs (47 per cent), being the cost of transmission, distribution and metering
16
Ibid, Transmission Operator’s Licence, Condition 3.
17
NSW Transmission Reliability and Performance Standard 2017, Schedule 1, cl 4.
18
National Electricity Rules, r 6A.3.1.
19
National Electricity Rules, r 5.16.1, see also r 5.15.2 and definition of identified need.
20
National Electricity Rules, r 5.16.4.
21
COAG Energy Council (2017), Review of the Regulatory Investment Test for Transmission, available at:
http://www.coagenergycouncil.gov.au/sites/prod.energycouncil/files/publications/documents/RIT-
T%20Review%20report%20%28final%206%20February%202017%29.pdf.
22
National Electricity Rules, r 6A.8.1(b)(4).
23
National Electricity Rules, Part ZZZP.
24
National Electricity Rules, r 6A.24.1(4).
25
National Electricity Rules, Chapter 6.
26
National Electricity Rules, r 6.18.1A, r 6.18.2.
NSW ELECTRICIT Y STRAT EGY | 7NSW Electricity Strategy
3. environmental costs (7 per cent), being direct costs of government schemes like the
renewable energy target
4. retailer and residual costs (9 per cent), being the cost of the retailer services and other
residual costs. 27
Figure 3: Price trends in NSW supply chain components
Retailers can purchase electricity on behalf of their customers through the spot market, which is
subject to significant volatility. Figure 4 below gives an example of price fluctuations in the spot
market over the course of a day.
Figure 4: NSW demand and price on 18th September 2018
Source: AEMC website: https://www.aemc.gov.au/energy-system/electricity/electricity-market/spot-and-contract-markets.
To manage their financial risks and have more certainty over wholesale energy costs, however,
retailers (and large energy users) typically enter into wholesale hedging contracts with generators.
27
AEMC, 2018 Residential Electricity Price Trends, Final report, 21 December 2018.
NSW ELECTRICIT Y STRAT EGY | 8NSW Electricity Strategy
These contracts fix the wholesale price retailers pay for electricity over the course of a year, or
several years. This reduces retailers’ exposure to the highs and lows of the spot market - which
can go as low as minus $1,000 per megawatt hour (MWh), and as high as $14,500/MWh - and
smooths their costs. 28
There are two key types of wholesale hedging contracts. First, a swap contract where a fixed
volume of electricity is traded during a defined period for a fixed price, regardless of the spot price.
The contract is settled through payments between the buyer and the seller based on the difference
between the spot price and the fixed price.
Second, a cap contract where a fixed volume of electricity is traded for a fixed price when the spot
price exceeds a specific price (typically $300/MWh). A cap contract provides buyers with insurance
against high prices, as the seller must pay the buyer the difference between the spot price and the
cap price every time the spot price exceeds the cap price.
1.3 Existing regulations to promote reliability
As with most competitive markets, the NEM relies on price signals and supply/demand imbalance
to trigger investment or divestment in generation. The Rules prescribe a “reliability standard” for
electricity generation and inter-regional transmission to inform the market of actual or forecast
shortfalls in electricity. The reliability standard is described as the maximum expected USE in a
region of the total energy demanded in that region each year. It is currently set at 0.002 per cent.29
In other words, to meet the reliability standard, at least 99.998 per cent of forecast customer
demand for a region must be met each year.
Despite the competitive nature of the NEM, the Rules confer additional powers on AEMO and
obligations on participants to promote reliability of electricity supply.
1.3.1 The RRO
On 1 July 2019, the Retailer Reliability Obligation (RRO) commenced under the NEL. The RRO
requires liable entities – mostly retailers and large energy users – to hold sufficient net contracts to
meet their share of a 1-in-2 year peak demand forecast for each trading interval. 30 A 1-in-2 year
peak demand forecast is peak demand for a region where the likelihood is that the forecast amount
will be exceeded once in any two year period. 31
The RRO operates as follows: each year, AEMO must publish a reliability forecast that sets out
whether or not a breach of the reliability standard is forecast to occur in any NEM region (creating
a “reliability gap”). 32
If, following AEMO’s forecast, the AER is satisfied that there will be a reliability gap in 3 years time,
it may make a T-3 reliability instrument. The T-3 reliability instrument sets out the region and
trading interval(s) causing the reliability gap. 33 This instrument acts as a market signal for new
investment to fill the forecast reliability gap.
28
AEMC, Spot and contract markets (2019), https://www.aemc.gov.au/energy-system/electricity/electricity-
market/spot-and-contract-markets accessed 8 November 2019
29
National Electricity Rules, r 3.9.3C(a).
30
National Electricity (South Australia) Act 1999 (SA) s 14R(2).
31
National Electricity (South Australia) Act 1999 s 14C
32
National Electricity Rules, r 4A.B.1, National Electricity (South Australia) Act 1999 (SA) s 14F-14G(1).
33
National Electricity (South Australia) Act 1999 (SA) s 14K.
NSW ELECTRICIT Y STRAT EGY | 9NSW Electricity Strategy
If the forecast reliability gap identified in the T-3 reliability instrument still exists one year out from
the forecast reliability gap for that same region and trading interval(s), the AER may issue a T-1
reliability instrument. 34 Following the issue of a T-1 reliability instrument, liable entities must report
their net contract positions for the identified reliability gaps to the AER. 35
Once a T-1 reliability instrument has been issued, AEMO is deemed to be the procurer of last
resort and is entitled to enter into contracts to secure electricity reserves under the Reliability and
Emergency Reserve Trader (RERT) scheme in relation to the reliability gap. 36 Under the procurer
of last resort mechanism (due to commence under the Rules on 26 March 2020), the recovery of
AEMO’s RERT costs is distributed to liable entities in proportion to their share of the total amount
of uncontracted MWs that were required to meet their share of the 1-in-2 year peak demand
forecast. 37
1.3.2 The RERT
Under the RERT scheme, AEMO may enter into contracts with generators or consumers to ensure
the reliability standard is met in each region, and to maintain power system security. 38 These
contracts reserve this capacity from bidding into the electricity market for the relevant trading
interval except in accordance with the contract. 39 AEMO may dispatch the reserve capacity to
ensure the reliability of supply in a region meets the reliability standard “if AEMO considers the
latest time for exercising the RERT…has arrived”. 40
AEMO’s costs incurred in contracting for reserves are recoverable by fees imposed on market
customers – predominantly retailers and large energy users. 41 Where, in AEMO’s reasonable
opinion, a region would fail to meet the reliability standard or power system security standard
without AEMO’s intervention, AEMO must recover its net liabilities or profits under the reserve
contracts from market customers. 42 Each market customer’s liability is calculated according to a
formula which distributes the RERT costs in proportion to that market customer’s load in the
relevant trading interval. 43
1.3.3 AEMO’s power to make directions
Under the Rules, AEMO is responsible for maintaining power system security, monitoring the
operating status of the power system and arranging the dispatch of generators, among other
things.44
AEMO may, if it considers that it is necessary to maintain power system security or for reasons of
public safety, direct a registered participant to take one or more relevant actions. Relevant actions
include:
• calling equipment into service;
34
National Electricity (South Australia) Act 1999 (SA) s 14K.
35
National Electricity (South Australia) Act 1999 (SA) s 14P.
36
National Electricity (South Australia) Act 1999 (SA) s 14T(2).
37
National Electricity Amendment (Retailer Reliability Obligation) Rule 2019, r 3.15.9A(g)-(h), r 4A.F.3, r
4A.F.8.
38
National Electricity Rules, r 3.20.3(a)-(b).
39
National Electricity Rules, r 3.20.3(j).
40
National Electricity Rules, r 3.20.7(a).
41
National Electricity Rules, r 3.15.9(a).
42
National Electricity Rules, r 3.15.9(d).
43
National Electricity Rules, r 3.15.9(e).
44
National Electricity Rules, r 4.3.1.
NSW ELECTRICIT Y STRAT EGY | 10NSW Electricity Strategy
• taking equipment out of service;
• increasing or reducing power output;
• shutting down or varying operations; and
• load shedding or any other act necessary to maintain power system security or for reasons
of public safety. 45
Registered participants subject to AEMO’s direction power include generators, large customers
and transmission and distribution providers. 46 AEMO’s powers, unlike the Minister’s powers under
the Electricity Supply Act 1995, do not allow it to make directions to non-market participants.
Part 2: Change in the electricity system
There are five major changes underway in the electricity market:
• Increasing electricity prices. Average electricity bills have increased over the past five
years putting pressure on household and business budgets.
• Power stations are reaching the end of their technical lives. The State’s aging coal-
fired power stations are giving rise to replacement and risk management imperatives.
Replacement, to ensure that there is adequate capacity in the system to address peak
demand events and to ensure price competition in electricity markets. Risk management,
because, as power stations age, they have a greater risk of part failure and therefore
decreasing the reliability of the electricity system.
• Improving economics of renewables. Renewables are now the most economic form of
new generation, with a mix of wind and solar firmed with gas, batteries and pumped hydro
expected to be the most economic form of reliable electricity. 47 This means that the
replacement of existing equipment should result in lower carbon emissions from the
electricity sector and cleaner air in NSW. It also means that electricity costs can be reduced
by developing more firmed renewable generation.
• Congestion in the electricity system. The requirements of the transmission network are
changing. Historically, the electricity system has relied on large generators for its electricity.
However, renewables are often best located at the remote edges of the grid and new
transmission needs to be built to connect these generators into the system.
Congestion in the electricity system has been increasing, driven by these new generators
connecting to the grid. This is undermining (and in some cases preventing) the
development of further new generation because congestion in the electricity system
reduces scope for new generation to connect to the electricity grid. It also increases
transmission loss factors resulting in reductions in the remuneration generators earn from
electricity.
• Changing patterns in the use of electricity. The energy sector has been moving from a
centralised power system to a decentralised power system as more small-scale resources
connect. This corresponds to a move away from a fleet of a few large generators to
numerous small ones. Traditional consumers are now becoming suppliers as businesses
and households change how they manage energy. With the electricity network evolving
from a one-way grid to a two-way grid these changes have created local network
challenges that need to be managed.
45
National Electricity (South Australia) Act 1999 (SA) s 116.
46
National Electricity Rules, definition of Registered Participant.
47
Graham, P.W., Hayward, J, Foster, J., Story, O. and Havas, L. 2018, GenCost 2018. CSIRO, Australia.
NSW ELECTRICIT Y STRAT EGY | 11NSW Electricity Strategy
These trends are developed below.
2.1 Household bill increases
According to the Independent Pricing and Regulatory Tribunal’s (IPART) draft market monitoring
report, average household electricity bills have increased slightly in real terms since price
deregulation in 2014. 48 However, the lowest market offers have increased by less than the cost of
living, showing the value for customers in switching to the best deal.
Customers who have used the NSW Government comparison site, Energy Switch, have saved an
average of $442 over a year.
Figure 5: Estimated average NSW household electricity bills
Source: IPART, “Review of the performance and competitiveness of the NSW electricity market 2018-19 (Draft)”,
October 2019
The wholesale cost of electricity in NSW has increased significantly in the past five years.
However, residential customers have been protected from large bill increases as retailers have
smoothed the impact. As shown in figure 6 below, the wholesale cost of electricity has more than
doubled in the last five years in NSW.
48 IPART, “Review of the performance and competitiveness of the NSW electricity market 2018-19 (Draft)”,
October 2019.
NSW ELECTRICIT Y STRAT EGY | 12NSW Electricity Strategy
Figure 6: Annual volume weighted average spot price of electricity in NSW
Annual volume weighted average spot price in
NSW
100
$ per megawatt hour
80
60
40
20
0
08/09 09/10 10/11 11/12 12/13 13/14 14/15 15/16 16/17 17/18 18/19
Financial year
Source: AER Wholesale market statistics
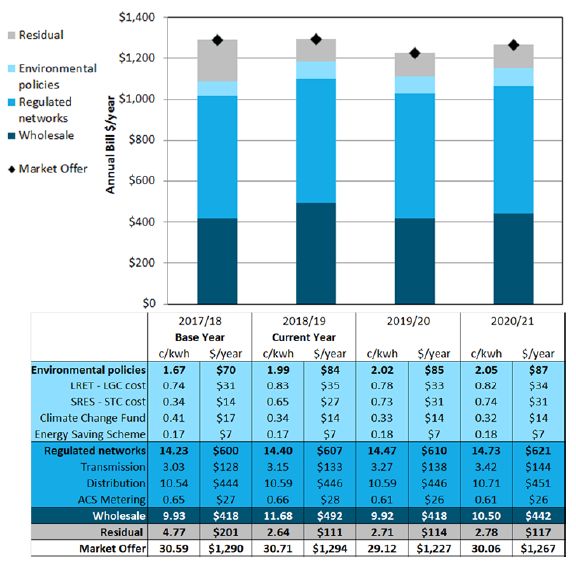
The wholesale cost of generating electricity accounted for 38 per cent of the typical bill in 2018/19.
Regulated network costs accounted for 47 per cent and are expected to increase slightly over the
next two years mainly due to rising transmission network costs. 49
Figure 7: Expected trends in NSW supply chain components from 2017/18 to 2020/21
Source: AEMC. Note: The electricity prices and bills are based on a weighted average of retailer's lowest market offers
for the representative consumer in NSW.
49
AEMC, 2018 Residential Electricity Price Trends, Final report, 21 December 2018
https://www.aemc.gov.au/market-reviews-advice/residential-electricity-price-trends-2018
NSW ELECTRICIT Y STRAT EGY | 13NSW Electricity Strategy
2.2 Coal-fired power stations are reaching the end of their technical
lives
All five operating NSW coal-fired power stations are scheduled for retirement between 2022 and
2043 (based on assumed 50-year technical life), beginning with Liddell Power Station in April 2023,
followed by Vales Point B in 2029, Eraring in 2031, Bayswater in 2035 and Mount Piper in 2043.50
Figure 8: NEM coal-fired generation fleet operating life
Source: AEMO, Integrated System Plan 2019-20 Assumptions Book as at 8 August 2019. Note: Operating life based on
50th year from full operation or announced retirement.
As electricity generators reach the end of their technical lives, their parts become more fragile and
liable to failure. This increases the risk of unplanned outages, reducing available capacity and
adversely impacting the reliability of the electricity system.
For example, in Victoria at AGL’s Loy Yang A power station, one generating unit (550 MW) is
currently offline for long term repairs until December 2019.51 In July 2019, it was reported that
approximately 2,130 MW of thermal power was offline in Victoria resulting in concerns of having
sufficient supply in Victoria for summer 2019-20.52
To illustrate a NSW example, the 10 February 2017 heatwave was exacerbated due to issues with
thermal generators. 53 Coincident with the peak of demand for the day, the following issues
50
AEMO Integrated System Plan 2019-20 Assumptions Book as at August 2019.
51
AGL, July 2019, Repairs underway to bring Loy Yang Unit 2 back to Service, media release, 11 July,
https://www.agl.com.au/about-agl/media-centre/asx-and-media-releases/2019/july/repairs-underway-to-
bring-loy-yang-unit-2-back-to-service
52
Renew Economy, Another coal unit breakdown in Victoria with five thermal units now offline (2019):
https://reneweconomy.com.au/another-coal-unit-breakdown-in-victoria-with-five-thermal-units-now-offline-
37313/, accessed 8 November 2019
53
AEMO, System event report New South Wales 10 February 2017 (2017): https://www.aemo.com.au/-
/media/Files/Electricity/NEM/Market_Notices_and_Events/Power_System_Incident_Reports/2017/Incident-
report-NSW-10-February-2017.pdf
NSW ELECTRICIT Y STRAT EGY | 14NSW Electricity Strategy
occurred which combined to overload the system and resulted in the load shedding of the Tomago
aluminium smelter:
• Tallawarra gas power station (435 MW) was offline due to a fault in the gas turbine;
• Colongra gas power station was offline and unable to start (600 MW) due to low gas
pressure in the fuel supply lines; and
• Two units at the Liddell Power Station (500 MW each) were offline due to forced outages.
2.3 The changing economics of generation
According to the AER’s State of the Energy Market 2018 report, in the five years from 2012 to
2017, over 90 per cent of investment in new generation capacity in the NEM was in wind and solar.
Investment in renewable energy generation was, in the first instance, largely driven by the
Commonwealth Government’s Large-scale Renewable Energy Target (LRET) which is expected to
be met before 2020. Despite the end of the LRET, the investment trend in renewable energy
generation is expected to continue due to improved project economics.
Wind and solar generation are variable in their output and need to be complemented with firm and
flexible technologies, such as pumped hydro, bioenergy, concentrated solar power, demand
management and gas-fired generators. A portfolio of firmed renewables operates in the following
way: because variable renewables generate electricity at a lower marginal cost than other
technologies, they produce electricity when they can (i.e. when the sun is shining, or the wind is
blowing). When variable generators are unable to satisfy demand, other technologies which can
provide electricity on demand (firm generation), including gas and other storage, dispatch
electricity. Such a system is able to satisfy electricity demand so long as there is sufficient firm
generation capacity to meet the system’s electricity demand.
As shown below, wind and solar are cheaper than new coal and gas based on a levelised cost of
electricity generated. Wind and solar generation are also competitive when complemented with
firm generation.
Figure 9: Levelised cost of electricity by type
Source: DPIE estimates based on various reports
The ISP, a whole-of-system roadmap for the efficient development of the NEM over the next
20 years, found that the least-cost transition plan is to retain existing generators for as long as they
can be economically relied on, followed by a replacement portfolio of solar (28 gigawatts (GW)),
NSW ELECTRICIT Y STRAT EGY | 15NSW Electricity Strategy
wind (10.5 GW) and storage (17 GW), complemented by 500 MW of gas plant and transmission
investment. 54
As at October 2019, there are 17,700 MW of large-scale renewable energy projects that have
received planning approval or are progressing through the NSW planning system, which
represents about $24 billion in investment. This includes approximately 11,400 MW from 81 solar
farms worth around $13.4 billion in investment, 3,800 MW from 15 wind farms worth approximately
$4.7 billion and 325 MW from two biogas and cogeneration projects worth approximately
$1.1 billion. It also includes the Snowy 2.0 Stage 2 Main Works, with potential to deliver 2,000 MW
of capacity worth $4.5 billion investment, and the Shoalhaven Scheme expansion, with 235 MW of
capacity at $300 million.
In addition to these renewable projects, there are 1,410 MW of large-scale non-renewable energy
projects with planning approval, worth around $1.5 billion. This includes 1,250 MW of gas projects,
worth $1.25 billion, and 160 MW of coal efficiency upgrades, worth $209 million.
2.4 A congested grid
The existing network in NSW is running out of capacity, representing a significant barrier to the
State’s 48 GW of generation connection enquiries in the pipeline. 55 Market research indicates that
grid connection is the highest concern for Australian energy CEOs 56 and it is estimated that there
is only sufficient capacity to connect 1 in 20 private sector generation proposals in NSW.
54
AEMO, Integrated System Plan for the National Electricity Market (2018), page 5.
55
TransGrid, Submission in the Inquiry into the sustainability of energy supply and resources in NSW (2019).
56
Clean Energy Outlook 2019 (2019):
https://assets.cleanenergycouncil.org.au/documents/resources/reports/clean-energy-outlook/Clean-Energy-
Outlook-Confidence-Index-July-2019.pdf
NSW ELECTRICIT Y STRAT EGY | 16NSW Electricity Strategy
Figure 10: Capacity of the NSW shared transmission network
Source: TransGrid, June 2019. Note: The existing shared transmission capacity between southern NSW (including the Snowy
Mountains) and major load centres of Sydney, Newcastle and Wollongong is heavily utilised at times of peak demand. The peak
utilisation has ranged between 90 per cent and 110 per cent over the last three years, and transmission constraints are expected to
become more frequent as new renewable generation connects in southern NSW.
In addition, as more projects connect to the grid, congestion on the network impacts generator
revenue and results in an inefficient market and ultimately higher wholesale energy prices. When
the network is congested, generators are less likely to have all of their available energy dispatched
into the market. Further, marginal loss factors (which account for the losses in transporting energy
between generators and demand centres and impact the revenue paid to generators) worsen as
congestion increases. For the 2019-20 financial year, AEMO significantly revised down marginal
loss factors for some generators, creating major uncertainty for generation investment.
Further, while NSW benefits from world-class energy resources, many of the areas with the
strongest renewable resource potential are located far away from the existing network, which was
primarily designed to connect coal-fired generators and the Snowy Hydro Scheme. To connect the
scale of new generation required to meet NSW’s future energy needs, it will be critical to efficiently
develop transmission to these new locations.
2.5 Changing patterns in the use of electricity
As increasing numbers of customers purchase systems like rooftop solar and home batteries and
install the digital meters required to support those systems, the electricity system is becoming more
digitised, interactive and decentralised. Many customers are now producers as well as consumers
of electricity, allowing them to engage with electricity businesses in new ways.
Households and businesses with rooftop solar systems are increasingly able to sell excess
electricity back into the grid. Electric vehicles are also forecast to increasingly enter the mix and
change the profile for electricity use and the way battery storage is used. An electricity system that
NSW ELECTRICIT Y STRAT EGY | 17NSW Electricity Strategy
was once linear and based on centralised generation must transition to effectively incorporate
distributed energy resources.
Energy efficiency measures can also reduce the need for additional investment in generation,
transmission and distribution assets and place downward pressure on energy customers’ bills.
Energy efficiency measures reduce energy consumption and maximum demand, even though
these savings can be difficult to measure given that they represent energy use forgone.
Modelling undertaken for TransGrid’s Transmission Annual Planning Report 2019 estimates that
NSW summer peak energy efficiency savings are expected to reach almost 8,000 MW by 2038 as
a result of energy efficiency policies (not including programs funded by the Climate Change Fund).
Figure 11: Projected efficiency savings in NSW summer peak
9000
8000 Savings NSW business
- medium case
Summer peak savings MWh
7000
6000 Savings NSW
residential - medium
5000 case
4000
3000
2000
1000
0
2000
2002
2004
2006
2008
2010
2012
2014
2016
2018
2020
2022
2024
2026
2028
2030
2032
2034
2036
2038
Year
Source: Energy Efficient Strategies, May 2019, ‘Impact of energy efficiency programs on electricity consumption in NSW and the ACT
from 2000 to 2038’.
Distributed energy resources impact the power system in several ways. One is that they shift the
demand profile. During the daytime when demand is moderate, rooftop generation is at its highest,
reducing demand from the grid. In the evening at peak demand, rooftop generation has tapered off,
meaning that rooftop solar has relatively less impact at reducing peak demand pressures on the
system.
Distributed energy resources can also result in distribution network congestion, as power is
exported back to networks that were not designed for two-way power flow. There are also issues
with voltage and frequency control and the ways in which distributed energy responds to system
disturbances. Compounding these issues, AEMO does not have ‘visibility’ of distributed energy
resources, making it difficult to measure the consumption and export from rooftop solar and
balance supply and demand in the system. These impacts make coordinating the integration of
distributed energy resources a major challenge in managing the energy transformation.
NSW ELECTRICIT Y STRAT EGY | 18NSW Electricity Strategy
Part 3: Work underway
3.1 Regulatory reform
3.1.1 Coordination of generation and transmission investment
In 2016, the Council of Australian Governments (COAG) Energy Council asked the AEMC to
undertake biennial reporting on when the transmission planning and investment decision-making
framework needs to change, and what needs changing. The inaugural Coordination of Generation
and Transmission Investment review (COGATI), completed in December 2018, made
recommendations for comprehensive reform to the way investment in generation and transmission
is coordinated.
In February 2019, the AEMC started the second COGATI review. Two of the key recommendations
from the inaugural COGATI final report will be progressed through this second review (COGATI
implementation - access and charging review). They are:
• reforms to the way generators access and use the transmission network; and
• a review of the charging arrangements which enable transmission businesses to recover
the costs of building and maintaining transmission infrastructure, both within and between
regions.
The AEMC has published two discussion papers on 14 October 2019 which:
• outline key design features of the proposed access model including dynamic regional
pricing and transmission hedging contracts; and
• discuss renewable energy zones.
The AEMC will release a final report in December 2019. The proposed COGATI reforms will be
subject to detailed impact analysis and modelling, with rule changes expected to be introduced in
2020. The AEMC is targeting implementation of the reforms by June 2022.
3.1.2 The future of the electricity market
The NSW Government continues to participate in national forums including the COAG Energy
Council, to advocate for clear, national, long-term energy policy that will benefit NSW customers
and support investment in new generation.
The COAG Energy Council has tasked the ESB with developing advice on a long-term, fit-for-
purpose market framework to support reliability that could apply from the mid-2020s. By the end of
2020, the ESB needs to recommend any changes to the existing market design or recommend an
alternative market design to enable the provision of the full range of services to customers
necessary to deliver a secure, reliable and lower emissions electricity system at least-cost.
In addition to the post-2025 market design for the NEM, the ESB has also published the
Converting the ISP into Action Consultation Paper on 17 May 2019 and released its revised Rules
to give effect to the RRO on 5 June 2019.
3.2 Government programs
3.2.1 The NSW Government’s Climate Change Fund programs
Through the Climate Change Fund (CCF), the NSW Government is investing $1.4 billion between
2017 and 2022 to help households and businesses save energy and money, improve energy
reliability and affordability, and improve the resilience of communities across NSW to climate
NSW ELECTRICIT Y STRAT EGY | 19NSW Electricity Strategy
change. Key programs under the CCF that contribute to a reliable, affordable and sustainable
electricity system include the:
• Emerging Energy Program
The $75 million Emerging Energy Program to accelerate the development of large scale,
low emissions, dispatchable electricity supply. The program provides grants to support a
mixture of technologies that will help diversify the NSW energy mix and drive more
competition in the market, ultimately lowering prices for consumers.
• Empowering Homes Program
The $50 million Empowering Homes Program to support the installation of up to 300,000
battery and solar battery system across NSW over the next 10 years. The program will
provide access to no-interest loans to enable NSW homeowners to purchase the systems.
• Regional Community Energy Program
The $30 million Regional Community Energy Program to address challenges and improve
energy reliability, and the integration of renewables, in regional communities. The program
supports regional communities in the transition to a modern electricity market.
• Smart Batteries for Key Government Buildings Program
The $20 million Smart Batteries for Key Government Buildings Program to encourage NSW
Government agencies to increase investment in solar and batteries for their facilities. This
program will enable agencies to reduce their operating costs while also helping to improve
grid security and reliability, particularly during peak demand periods.
• Solar for Low Income Households
The $15 million Solar for Low Income Households Program to deliver increased electricity
bill savings to low income households. The program will install up to 9 MW of rooftop solar
in NSW, providing cleaner and cheaper electricity for up to 3,000 families.
3.2.2 The NSW Transmission Infrastructure Strategy
The NSW Transmission Infrastructure Strategy is the NSW Government’s plan to unlock private
sector investment in priority energy infrastructure projects, which can deliver least-cost energy to
customers to 2040 and beyond. New regional infrastructure could support up to 17,700 MW of new
energy projects, $23 billion in regional investment and 2,000 construction jobs.
The Strategy has three aims: first, boost the State’s interconnection with Victoria, South Australia
and Queensland, and unlock more power from the Snowy Hydro Scheme.
Secondly, increase NSW’s energy capacity by prioritising Renewable Energy Zones in the Central-
West, South West and New England regions of NSW, which will become a driving force to deliver
affordable energy into the future. Unlocking the NSW Renewable Energy Zones will diversify the
State’s energy mix and expand its transmission capabilities, opening new parts of the NEM for
energy generation in locations that can benefit from diverse weather patterns. Strategic
infrastructure upgrades to unlock these priority Renewable Energy Zones will leverage substantial
private sector investment, boost regional economies and build the State’s electricity resilience by
ensuring there are new generation projects coming online to replace retiring power stations over
the next two decades.
Thirdly, work with other States and regulators to streamline regulation and improve conditions for
investment.
NSW ELECTRICIT Y STRAT EGY | 20NSW Electricity Strategy
3.2.3 The Commonwealth’s Underwriting New Generation Investments
program
The Commonwealth Government has established the Underwriting New Generation Investments
program to support targeted investment in new generation that will lower prices, increase
competition and increase reliability in the system.
The program will provide financial support to firm generation capacity as part of the
Commonwealth Government's commitment to lowering electricity prices and increasing reliability in
the system. It will be technology neutral, providing a level playing field to enable the best and
lowest cost generation options to be supported. The program’s objectives are to:
• reduce wholesale electricity prices by increasing competition and supply;
• assist commercial and industrial customers, and smaller retailers to access affordable
energy supply arrangements; and
• improve reliability by increasing the level of firm and firmed capacity in the system.
During December 2018 and January 2019, the Commonwealth Government called for registrations
of interest (ROI) for projects under the program. The Commonwealth Government has shortlisted
12 projects representing a range of fuel types, including:
• six pumped hydro projects;
• five gas projects; and
• one coal plant upgrade project.
Three of the 12 projects are in NSW:
• Australian Industrial Energy - Port Kembla, New South Wales - Gas
• UPC Renewables - Armidale, New South Wales - Renewable Pumped Hydro
• Delta - Lake Macquarie, New South Wales - Coal Upgrade
The multi-phased program will be open over four years to June 2023.
3.2.4 Snowy 2.0
The Commonwealth Government has committed to developing Snowy 2.0 to deliver 2,000 MW of
on-demand generation, up to 175 hours of storage, and keep downward pressure on prices.
The project links two existing Snowy Scheme dams, Tantangara and Talbingo, through tunnels
and an underground power station with pumping capabilities. Hydro-power will be generated by
falling water spinning Snowy 2.0’s reversible turbines, which can also pump water in the opposite
direction. Snowy 2.0’s pumping capabilities work in a ‘closed’ system – water is recycled between
the upper dam (Tantangara) and lower dam (Talbingo) so the same water can be used to generate
power more than once, making the most of available water.
The project is undergoing exploratory works and environmental and planning assessment
processes.
The first power produced from Snowy 2.0 is expected in late 2024-25, with progressive
commissioning of the six units. Snowy 2.0’s operating life is expected to be consistent with the
Snowy Scheme’s existing assets, which continue to operate reliably many decades after
installation.
NSW ELECTRICIT Y STRAT EGY | 21NSW Electricity Strategy
Part 4: The NSW Government’s objectives
The NSW Government has three objectives for the electricity system: reliability, affordability and
sustainability.
4.1 Reliability
4.1.1 The role of Government as the ultimate guarantor of reliability
All electricity market participants have an obligation to their customers and consumers to ensure
that the electricity system remains reliable. However, electricity is an essential service. It is vital for
the provision of essential public services, including transport, health and utilities ranging from lifts
to traffic lights. Accordingly, Governments are the ultimate guarantors of the electricity system’s
reliability. This means that it is the ultimate responsibility of Government to ensure that the market
is designed to reliably supply electricity. It also means that it is the Government’s responsibility to
take action (in a manner consistent with other policy objectives) to address the system’s reliability
when its reliability is improperly risked.
4.1.2 Reliability standards in electricity systems – striking a balance between
reliability and cost
While the electricity system’s reliability is important, it needs to be balanced against the need to
keep costs down. The need to strike this balance reflects that plant, equipment and network
failures happen from time to time, that these failures can coincide, and that it is not possible to
guard against every eventuality. It would, for example, be too costly to back up every generator in
the electricity system, notwithstanding that it is theoretically possible that all of them could suffer
reliability failures at the same time. This balance is struck and crystallised through the reliability
standards and targets required of the system.
4.1.3 Energy Security Target – the NSW Government’s approach to ensuring
reliability
The primary risk to NSW’s electricity reliability is a capacity shortfall. A capacity shortfall might
occur either because a generator has exited the market without having been sufficiently replaced,
or because one or more generators have experienced an unplanned outage (which they are more
likely to do as they age). Accordingly, the Strategy’s approach to reliability is to set a long-term
Energy Security Target (EST) that conveys a clear message to the market about the NSW
Government’s reliability expectations and what action the NSW Government will take to avoid an
electricity supply shortfall.
Three additional points should be made regarding the purpose of the EST. First, the Government
“action” being contemplated here is action to avoid a long-term risk of an electricity emergency
arising from a shortfall in capacity. Different actions are required to avert an immediate risk of an
electricity emergency.
Second, the EST addresses the threshold question of whether additional Government action is
required. It does not address the nature of the Government action. The latter will vary depending
on the scale of the breach. A larger breach not only increases the probability of insufficient
capacity, it also increases the severity of the electricity emergencies that could arise. There are
material differences between capacity emergencies which require AEMO to:
• engage the RERT (and therefore increase bills);
NSW ELECTRICIT Y STRAT EGY | 22You can also read