Northamptonshire COVID-19 Weekly Surveillance Report - Data ...
←
→
Page content transcription
If your browser does not render page correctly, please read the page content below
Northamptonshire COVID-19
               Weekly Surveillance Report
• National lockdown restrictions continue in place across England until further Government review
• A mutant, more transmittable strain of the coronavirus is causing rapid increases in infection rates
• Clinically vulnerable adults who shielded in the first lockdown are being urged to do so again – even if they have received both
  doses of the vaccine
• A total of 3,643 Northamptonshire residents have tested positive for COVID-19 in the last week
• Mixing between households, in spite of national lockdown rules, is still the greatest cause of transmission locally
• Coronavirus related hospital admissions and deaths remain high in the over 60s and one in three beds are occupied by
  patients with the virus
                                              Data up to 17 January 2021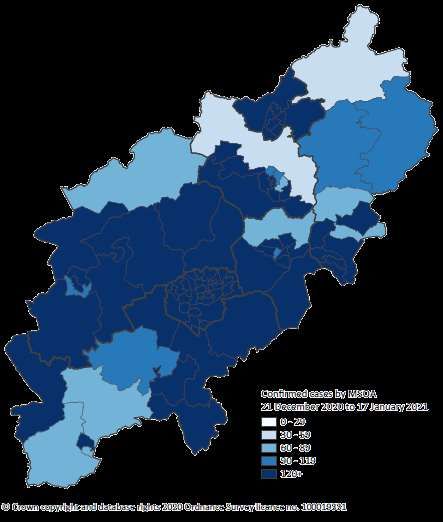
National Lockdown
All residents in           Under the national lockdown restrictions, the Government is ordering everyone to stay at
Northamptonshire and       home. You may only leave the house for limited reasons permitted in law, such as:
across England are         • To shop for essentials
officially being told to   • To work, if you absolutely cannot work from home
‘Stay at Home, Protect     • To exercise once a day
the NHS and Save Lives.’   • To seek medical assistance, for example to get a COVID-19 test
                           • Or to escape domestic abuse
                                                       Full National Lockdown Guidance

2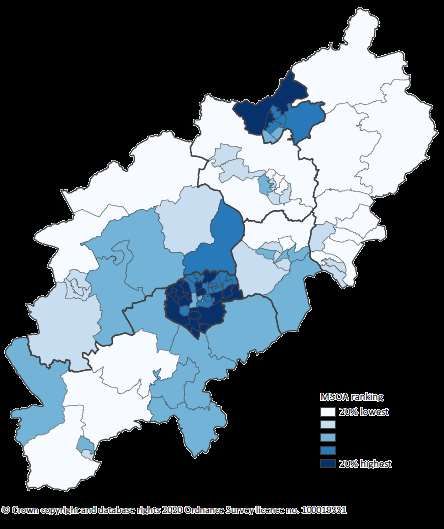
Rapid COVID-19 Testing
• This week two new COVID-19 Rapid Testing Centres opened in Northamptonshire for key workers who are not showing
  symptoms of COVID-19.
• The new community based testing sites are at Lodge Park Sports Centre in Corby and the University of Northampton.
  The test is called a Lateral Flow Test and involves a swab of the mouth and nose and provides a result within 30 minutes.
• The aim of testing people who do not have COVID-19 symptoms is to identify those who may be infectious without being
  aware in order to reduce spread of the virus. For those who test positive, fast action can then be taken to protect
  colleagues and family members of and in reducing any onward risk of transmission.
• Testing slots must be booked online in advance and priority is given to workers in the following sectors: Health or social
  care, transportation, education or childcare (if not receiving regular rapid tests via the workplace), essential shops,
  supermarkets or financial services, food production or processing, warehousing, packing or distribution, essential
  public sector services including waste, bin collections, security, construction, utilities or communications and agency
  workers. It is advisable for those people working in these sectors to take up the opportunity to get tested on a weekly
  basis to help to reduce the spread of the virus.
• Further sites across the county will open over the next three weeks.

3
COVID-19 complacency can kill!
    • COVID can be invisible. Up to 80% of people who have COVID-19 may show no symptoms at all but they still carry the disease at a
      strength which could kill another person. That means you could be casually spreading the disease everywhere you go. That is why you
      should always ‘act as if you have it’ because you may not know you do. Stay at home, Protect the NHS and Save lives. If you must leave
      the house, you must take as many precautions as possible not to transmit this deadly virus. If you test positive, but still feel absolutely
      fine, you must still self-isolate for ten days. Community-based asymptomatic testing sites will be open to those who are unable to work
      from home and particularly those in high-risk workplaces or key worker roles. Testing will be available at sites in Corby and
      Northampton and will be fully operational from 21st January (booking available via NCC website). Further sites across county to come
      on-line over the next 3 weeks.
    • Every touch leaves a trace. Listen out for our radio adverts reminding you all that the virus can be transferred on all surfaces. Think
      before you touch and remember that pedestrian crossing buttons, lift buttons, handrails and car doors are all touch points which may
      be harbouring the coronavirus. When using public transport, shopping, accepting parcels and deliveries (including online shopping), car
      sharing (in bubbles), touching doors, going in and out of buildings – remember these are all potential points of COVID-19 transmission
      and frequent hand washing or sanitising is key to reducing the risk of catching COVID-19 from surfaces. The new variant is spreading
      rapidly so hand washing, face coverings and keeping a distance are all vital.
    • Complacency can kill! The new variant is up to 70% more transmissible. We are in national lockdown and compliance with Government
      restrictions and regulations is essential if we are to see our positive case rates continue to come down. Thank you to each and every one
      of you who is staying at home and following the rules – it’s working but we have a long way to go still. Keep at it and we will beat this!

4
Total and Weekly Summary
    A total of 34,385 positive cases have been identified in Northamptonshire to date. Of this number, 3,643 were
    identified in the last week, 11th to 17th January 2021.

                                                          This graph shows the total number of people who have tested
                                                          positive for COVID-19 in Northamptonshire each week since
                                                          26th October 2020.
                                                          Weekly case numbers have increased significantly over the
                                                          last month. Although cases in the latest week have
                                                          decreased compared to the previous week’s record high, the
                                                          latest weekly case total shows a 88% increase when
                                                          compared to the week of 14th December 2020.
                                                          The latest week’s figures are likely to increase further as data
                                                          for the most recent days are subject to reporting delays.

5
Total Cases by District and Borough
                                                                            This table shows the total number of people who
                                                                            have tested positive for COVID-19 up to 17th
                                              Cases in week                 January 2021 in each of Northamptonshire’s
                             Total cases to                  Change from
    Area                                       11 Jan to 17                 seven districts and boroughs.
                              17 Jan 2021                   previous week
                                                Jan 2021
                                                                            Northamptonshire’s total weekly cases shows an
    Northamptonshire            34,385           3,643        Decrease      increase of 88% when compared to the week of
    Corby                        3,369            457         Decrease      14th December 2020.
    Daventry                     3,177            327         Decrease
                                                                            Northamptonshire and all districts and boroughs
    East Northamptonshire        3,280            275         Decrease      have seen a decrease in case numbers when
    Kettering                    3,974            455         Decrease      compared to the previous week. These decreases
                                                                            are good news but we must work together to
    Northampton                 13,427           1,422        Decrease      maintain this trend.
    South Northamptonshire       3,818            346         Decrease
                                                                            Please note that extreme caution must be applied
    Wellingborough               3,340            361         Decrease
                                                                            when viewing week on week changes. To see the
                                                                            overall changes in areas in context please see
                                                                            slides 13, 14 and 15.

6
Rates of Cases by District and Borough
                                                                                                        The data in this table show us what the total and
                                                                                       Compared to
                                   Cumulative rate   Rate per      Compared to                          most recent week’s positive COVID-19 case numbers
                                                                                      England rate 8
    Area                            per 100,000 to 100,000 8 Jan county rate 8 Jan                      for our districts and boroughs would look like if each
                                                                                       Jan to 14 Jan
                                     14 Jan 2021 to 14 Jan 2021 to 14 Jan 2021                          area had the exact same population size (100,000).
                                                                                           2021

    Northamptonshire                   4,404           521.2              -               Similar       This helps us to compare geographic areas with
    Corby                              4,466           697.9          Sig higher         Sig higher
                                                                                                        different sized populations more accurately.

    Daventry                           3,570           407.2          Sig lower          Sig lower      Northamptonshire’s infection rate per 100,000
    East Northamptonshire              3,379           330.1          Sig lower          Sig lower
                                                                                                        population for the most recent week is 521.2,
                                                                                                        which is similar to the national average.
    Kettering                          3,742           428.4          Sig lower          Sig lower
    Northampton                        5,766           691.0          Sig higher         Sig higher     All district and borough’s infection rates except for
                                                                                                        Northampton and Corby’s are significantly lower
    South Northamptonshire             3,923           418.0          Sig lower          Sig lower
                                                                                                        than or similar to the national average.
    Wellingborough                     4,045           473.0           Similar            Similar       Northampton and Corby’s rates are significantly
Source: Gov.uk Coronavirus Dashboard                                                                    higher than the national average.
                                               *Please note that the word sig means ‘significant’,
                                               which is a statistical term that simply means that the
                                               research is valid.

7
Deaths Within 28 Days of Positive Test

                                                                                          This table shows total number of deaths of
                                                         Deaths in week
                                         Total deaths to                   Change from    people who had a positive test result for
      Area                                               11 Jan to 17 Jan
                                          17 Jan 2021                     previous week   COVID-19 and died within 28 days of the first
                                                              2021
                                                                                          positive test, reported up to 17th January
                                                                                          2021 for each of Northamptonshire’s seven
      Northamptonshire                       1,068            70           Increase
                                                                                          districts and boroughs.
      Corby                                    96             11           Increase
                                                                                          Northamptonshire as a whole, Corby,
      Daventry                                107              7           Increase       Daventry, Kettering and South
      East Northamptonshire                   151              5           Decrease       Northamptonshire have seen an increase in
                                                                                          deaths compared to the previous week.
      Kettering                               133             11           Increase
      Northampton                             386             22          No change       *People who died more than 28 days after
                                                                                          their first positive test are not included,
      South Northamptonshire                   91              5           Increase       whether or not COVID-19 was the cause of
      Wellingborough                          104              9           Decrease       death.

      Source: Gov.uk Coronavirus Dashboard

8
Rate of Weekly Lab Confirmed Cases
                                                                                                           This graph includes all testing data. Recent data
                                                                                                           shows that Northamptonshire’s rate of cases in
                                                                                                           the last seven days continue to rise and now
                                                                                                           slightly levelling up with the England average.
                                                                                                           With the exception of Northampton and Corby,
                                                                                                           all districts and boroughs have weekly total rates
                                                                                                           below the England average.

                                                                                                           Northampton and Corby’s case rate have
                                                                                                           increased ahead of the national average but in
                                                                                                           recent days have seen a downward trend.
                                                                                                           Corby has seen a particularly sharp increase of
                                                                                                           515% when compared to the rate on 14th
                                                                                                           December 2020 and now has the highest rate
                                                                                                           in the county, followed closely by
                                                                                                           Northampton.
                                                                                                           Case rates in all districts and boroughs remain
                                                                                                           concerningly high.
    Source: Gov.uk Coronavirus Dashboard.

* These are 7-day rolling total numbers of cases as a rate per 100,000 population – this is done to even out the fluctuations we see in testing volumes on
weekdays vs weekends.

9
Recent Cases by Age and Gender
This graph shows the number of positive test results for
COVID-19 in Northamptonshire over the last 28 days by
gender and by ten-year age band.
Overall, more women than men tested positive for COVID-
19 in the last 28 days.
The age group with the most positive tests was 20 to 29
year olds for both men and women. Case numbers are
currently highest amongst working age adults.
Over the last 4-week period there have been further
increases in numbers of cases amongst people aged 60+.
This is of particular concern as these age groups tend to be
at greater risk of more severe disease, observed hospital
admission and death.
*Please refer to the gov.uk coronavirus dashboard heat map for more information on cases in specific age groups.
10Rate of Weekly Lab Confirmed Cases in
Ages 60+
This graph includes testing data for people
aged 60+. It shows that the rate of
confirmed cases for people aged 60+ in
Northamptonshire has started to fall in the
last week following the sharp rise seen since
Christmas.
Northampton and Corby’s case rates for
ages 60+ are currently higher than the
Northamptonshire average. Corby’s case
rate for ages 60+ saw a particularly sharp
increase in recent weeks, and while it has
since declined it remains the highest in the
county.
Case rates in all districts and boroughs
remain high but have decreased or
plateaued in the last week.
* These are 7-day rolling total numbers of cases as a rate per 100,000 population – this is done to even out the fluctuations we see in testing volumes on
weekdays vs weekends.
11Hospital Beds Occupied by Confirmed
COVID-19 Patients This chart shows the trend in numbers of beds at
Northampton and Kettering General Hospitals
occupied by COVID-19 patients since 1st August
2020.
It shows that the number of beds occupied due to
COVID-19 remained relatively steady over the late
summer through to mid-October, at which point
numbers of patients in hospital began to increase
sharply.
Although case rates went down during the second
national lockdown, the numbers of patients in
hospital due to COVID-19 continued to rise. There
has been a further sharp rise in hospital bed
occupancy following a brief decline in the run-up
to Christmas. The latest data shows that a total of
411 COVID-19 patients occupied hospital beds in
Northamptonshire on 19th January 2021, which is
only slightly below the record high of 422 seen on
13th January 2021.
12Cases by Community – Last 28 Days The chart shows the local communities within Northamptonshire where COVID-19 infections over the last 28 days are highest. Knowing the areas with the highest case numbers in the last 28 days help us to prioritise and focus our support locally. 13
Case Rates by Community – Last 28 Days per 100,000
 population

  These graphics show
  what positive COVID-
  19 case numbers over
  the last 28 days would
  look like if each local
  community had the
  exact same size
  population (100,000).

  The map illustrates the
  28-day infection rate
  per 100,000
  population across the
  whole county.

* Please note that the numbers shown on this page represent the best possible estimate we can make from a wider range of numbers, because there is always a
margin of error when calculating cases per 100,000 population – particularly where actual case numbers are small.

 14
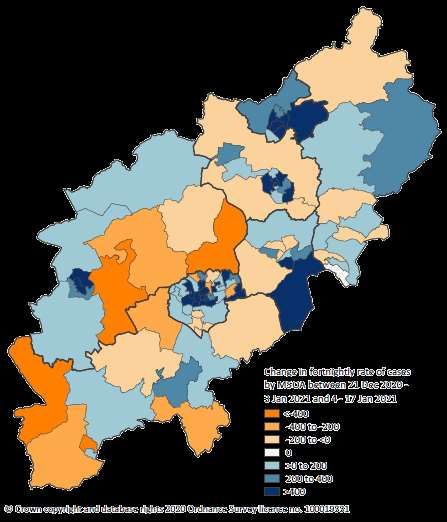
Change in Case Rates by Community – Fortnightly
 per 100,000 population

                                          Rank    Name
 If each community had the exact
                                             1.   Corby Kingswood (Cor)
 same size population (100,000) in
                                             2.   Town Centre & Semilong (Nton)
 Northamptonshire, this graphic
                                             3.   St Michael's Road (Nton)
 shows how COVID-19 case numbers
 in the last 14 days would have              4.   Corby Lodge Park (Cor)
 changed in each community                   5.   Cliftonville & Rushmere (Nton)
 compared to the previous 14 days.           6.   King's Heath & Spencer (Nton)
                                             7.   Irchester, Wollaston & Bozeat (Wboro)
 The 15 areas with the greatest              8.   Kettering Central East (Kett)
 increases in case rates are listed          9.   Kettering Avondale Grange (Kett)
 next to the map.                           10.   Kingsley Park & Racecourse (Nton)
                                            11.   Kettering Town & West (Kett)
 Areas with the greatest increases in       12.   Corby Village & Weldon (Cor)
 rates of infection show us where           13.   Eastfield (Nton)
 we need to prioritise and focus our        14.   Daventry North (Dav)
 support locally.                           15.   Stornton & Sixfields (Nton)

* Please note that the numbers shown on this page represent the best possible estimate we can make from a wider range of numbers, because there is always a
margin of error when calculating cases per 100,000 population – particularly where actual case numbers are small.

 15
Summary of Outbreaks 18/01/2021
Two or more cases linked by place and time to that setting. Totals are 28 day counts for care homes and hospitals, and 14
day counts for all other locations.
In the last 28 days Corby Daventry East Northants Kettering Northampton South Northants Wellingborough County total Case total
Outbreaks 7 7 4 6 26 3 6 59 630
Care home/service 6 5 4 5 19 2 4 45 472
Childcare 0 1 0 0 1 0 0 2 10
Workplace 1 1 0 1 3 1 2 9 128
Education 0 0 0 0 0 0 0 0 0
Hospital/hospice 0 0 0 0 3 0 0 3 20
Other 0 0 0 0 0 0 0 0 0
• Please note that this summary covers all situations classified as ‘active’. An active situation has had at least 1 positive case within the previous 28 days.
• Outbreaks are pended if there are no new cases reported for Care H/Heath care in 14 days and 7 days for others.
• Although outbreaks have increased this week and are related to a particular setting - it is important to note that the majority of cases are due to community
household transmission.
16Winter Flu - Protecting the Immune System
Winter Flu immunisation uptake up to end of week 01 (4-10 Jan 2021)
This data represents 91.3% of GP practices uploading their data for week 01. Please note that individuals can appear in more than one
cohort, e.g. pregnant and in risk category.
Number of further
Total Number eligible Number of immunisations
Target Group immunisations required to Target %
people given
meet target
Over 65 120,746 98,139 Target met 75%
Under 65 at risk 93,760 49,457 20,863 75%
Pregnant Women 5,798 2,203 2,146 75%
2 and 3 year olds 17,653 9,494 3,746 75%
The table below shows that the current progress for flu uptake has improved in all eligible categories compared to week 01 in 2020.
Total Combined At Risk
STP Year 65 and over Population 6months to All Pregnant Women All Aged 2- 3
under 65 years
Northamptonshire STP 2020/21 81.3% 52.7% 38.0% 53.8%
Northamptonshire STP 2019/20 69.8% 41.1% 35.3% 37.2%
Northamptonshire STP Change +11.5% +11.6% +2.7% +16.6%
17Public Health Measures • Public Health Northamptonshire, Environmental Health Departments within District and Borough Councils, Northamptonshire County Council and Northants Police will use enforcement powers where there is non-compliance in relation to COVID-19 Regulations. • The Health Protection (Coronavirus, Restrictions) (All Tiers) (England) Regulations 2020 are currently in force imposing Tier 4 restrictions nationally since 6th January 2021. • There are a number of established forums within Northamptonshire to discuss and agree a consistent approach to these Regulations. • Although there are a variety of agencies enforcing these restrictions, we have established a Joint Enforcement Team to target non- compliance which includes a multi-agency approach to interventions. • We will continue to engage with our community to ensure compliance with the objective of supporting public health and reducing the transmission rate of COVID-19. • However, gatherings in private dwellings; undertaking non-essential journeys; a failure to wear face coverings and failure to self- isolate when required to do so will result in the use of proportionate enforcement powers aimed at protecting public health which can include the service of Fixed Penalty Notices. 18
We Are All In This Together

• To find out more information about local testing sites visit: Northamptonshire COVID-19 Testing Update.
• Tests can be booked online at NHS COVID-19 or by calling 119. Home testing kits can also be ordered subject to
  availability.
• It is vital that when you leave the house to be tested you must go straight to the testing centre and return home
  immediately to self- isolate until you get your results.
• Advice on how to access a COVID-19 test can be found here: COVID-19 Guidance on Getting Tested.

19
Partners Working on the COVID-19 Response
In Northamptonshire all system colleagues have come together to fight the virus: the police, fire officers, pharmacists, our Clinical Commissioning Group
and hospital colleagues. The definitions below will explain the roles of the other groups involved.

PHE – Public Health England
An executive agency of the Department of Health and Social Care (DHSC) which is the expert national public health agency which fulfils the Secretary of
State for Health and Social Care’s statutory duty to protect health and address inequalities, and executes his power to promote the health and wellbeing of
the nation. We work with the Midlands PHE Office.

Local Public Health Teams
Part of Local Authorities (Upper tier and unitary) since 2013, led by Directors of Public Health with a number of specific statutory responsibilities, including
health protection and local control of infectious diseases including immunisation and related functions.

Joint Biosecurity Centre (JBC)
The JBC aims to provide evidence-based, independent analysis, assessment and advice to inform local and national decision-making in response to COVID-
19 outbreaks. This includes:
• helping to inform action on testing, contact tracing and local outbreak management in England
• informing an assessment of the risks to UK public health from inbound international travel
• advising on the COVID-19 alert level
acting as the main point of liaison between Local Authorities and the Chief Medical Officer and Secretary of State.
Environmental Health Officers
Work within District and Borough Local Authorities and are responsible for monitoring and enforcing health and hygiene legislation. They are working
closely with Public Health Northamptonshire on COVID-19 workplace outbreaks, with the COVID-19 Schools Cell and Northamptonshire County Council’s
Test and Trace service.

20
Help, Guidance and Fines

     • Government Financial support is now available for eligible individuals who have to
       self-isolate for up to 14 days. Details of financial support can be found here.

     • Northamptonshire County Council has put together a Self-isolation support pack for
       residents.

     • Those who do not follow Test and Trace guidance, or those who breach self-isolation,
       or lockdown legislation will be fined £1,000.

21
You can also read