Northcote - town square workshop - Kaipātiki Local Board 23 February 2022 - Auckland Council
←
→
Page content transcription
If your browser does not render page correctly, please read the page content below
Northcote – town
square workshop
Kaipātiki Local Board
23 February 2022

Town Centre Masterplan

                     Hobsonville – The Airfields
                     Programme Business Case
                     and supporting masterplan

                     March 2020
Masterplan Refresh
Realignment of Ernie Mays Street and co-locating community centre and town
square adjacent to Cadness Reserve
HNZ Development
Stage 5
Northcote Intermediate School
HNZ Development
Stage 1
Iwa
4
Compared to the Benchmark
9 5
Masterplan - realignment of
8
7
Tāhi
7
Rua
7
• add a page with current MP / diagrams Tekau mā tāhi
10
Ernie Mays Street allows the
10
area around the library to be
Tekau
7
1
Whā
2
increased, and used for the
7
Whitu
7
town square, community
Rima
facility and open space.
3
Ono
supermarket
1 Community and Library Hub Building
2 Town Square
3 Supermarket
4 Te Ara Awataha
5 Cadness Reserve
6 Greenslade Reserve
Mostly Town Centre (27m height) 7 Mixed-use development site
2.9 hectares (approx.) 8 Existing Library Building
20,000 sqm 9 Existing Supermarket
10 Residential
750 (approx.)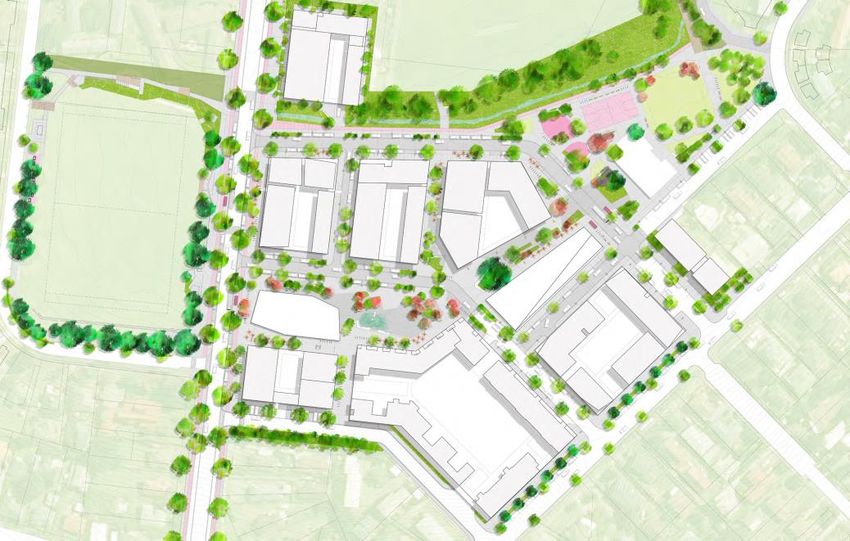
Masterplan Refresh
    Benefits of co-locating the town square and community facility

•     Places the town square closer to the centre of the Northcote community
•     Creates a stronger connection to Te Ara Awataha
•     Creates synergies between community facility and town square providing greater
                                                             Hobsonville – The Airfields
      flexibility and operational efficiencies               Programme Business Case
                                                             and supporting masterplan
•     Creates a clear visual sightline to Lake Road along the realigned and widened Ernie
                                                             March 2020
      Mays Street
•     Adjacent to the proposed public transport links
Masterplan Refresh - Key Moves

1. Extend existing library to       2. Co-locate new town square                3. Maximise permeability and connections
create new Community Hub            (1,500sqm) with Community Hub               between town centre, Te Ara Awataha and
                                                                                Cadness Reserve

4. Connect Ernie Mays Street from Lake   5. Implement streetscape upgrades            6. Define town centre and College
to College roads for multiple modes      for existing perimeter streets (Lake         Road development lots and Essential
including public transport               Rd, College Rd and Kilham Ave)               Outcomes (see next slide)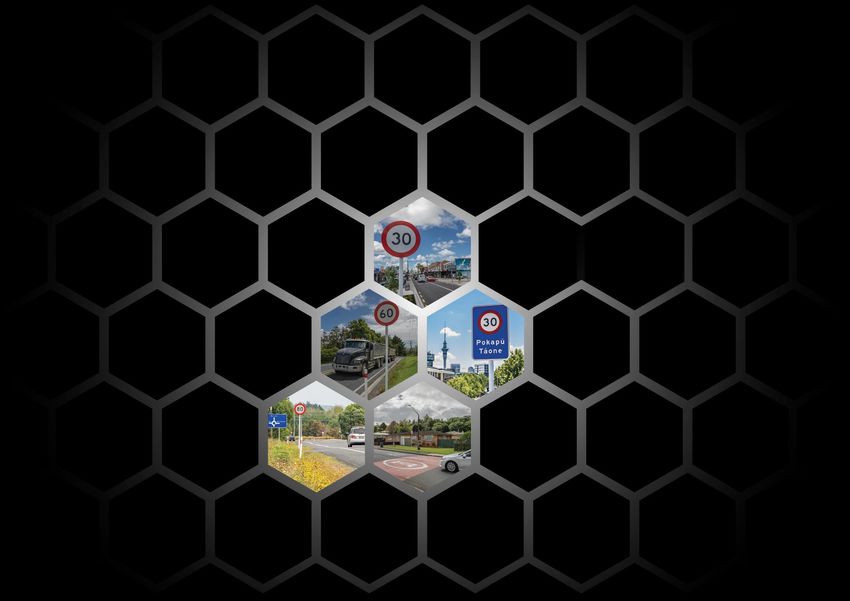
Lake Road town centre development - Essential outcomes

                                                                                                                            4. A clearly identifiable retail
1. A regenerated town centre that        2. A mixed use town centre with a          3. A legible and connected
                                                                                                                            ‘main street’ – Pearn Place – with
reflects and strengthens the             balance of retail, apartments and          movement / street network,
                                                                                                                            pedestrian priority
character of Northcote                   community uses                             prioritizing active modes

5. High amenity town centre         6. Building height and massing       7. All perimeter street edges /   8. A well integrated       9. Considered and flexible
green streets and public spaces     focused in areas, so retail street   interfaces specifically           supermarket, located to    approach to car parking
                                    and public spaces are not overly     addressed                         support the retail main
                                    shaded                                                                 street
Next steps

•    Procure design team
•    Workshops on design brief for Community hub, Cadness Reserve and town square
•    Local board approve design brief
                                                        Hobsonville – The Airfields
•    Concept design phase – with community and stakeholder input/workshops
                                                        Programme Business Case
                                                                 and supporting masterplan
•    Local board approve concept design
                                                                 March 2020
•    Detailed design, consenting and construction

           Design                                                             Detailed design
                             Design brief        Concept design                                 Construction
        procurement                                                           and consenting
                            April-Jun 2022       July-Dec 2022                                     2024+
        March 2022                                                                 2023
Speed management
plan 2023-26

Overview for
Kaipātiki Local
Board
23.02.2022
Annie Ferguson

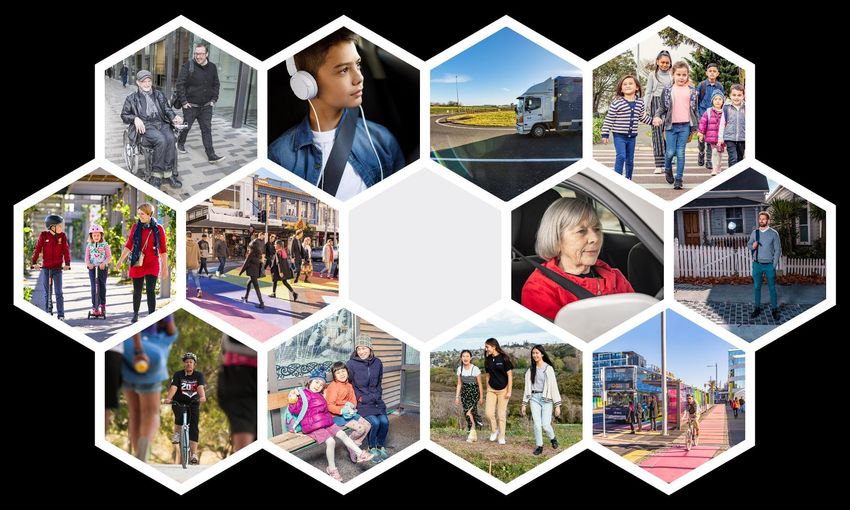
Purpose –

1. To share an overview of the proposed speed
   management plan 2023-26
2. To hear comments and questions from local
   board members
3. To outline how local boards can share their local
   knowledge and insights

The
    vision

3
Strategic drivers A significant opportunity to achieve Vision Zero outcomes and support more use of lower-carbon modes. Delivers on recommendations in Road Safety Business Improvement Review to accelerate speed management under proposed rule changes.
Safety and climate goals are indivisible

“Efforts to reduce speed
will have a beneficial
impact on air quality and
climate change as well as
being vital to reduce road
traffic deaths and injuries”
Stockholm Declaration, outcome document
of the Third Global Ministerial Conference
on Road Safety -2020

                                             Image adapted from Sustainable and Safe,
                                             World Resources Institute 2018
Where we are now
New Zealand’s rank in international road safety performance:
Road fatalities per billion vehicle kilometres travelled
If NZ had delivered a rate
of fatalities to match
Victoria in Australia,
124 less New Zealanders
would have perished on
NZ roads in each of the
last three years*
* Howard, Eric. Auckland Road Safety Business Improvement Review 2021.
Based on mean DSI comparative performance over 2017-2020 and based
in 2020 populations.
6 Source: Road Safety Annual Report 2020, International Transport ForumThe facts: A typical Auckland road death or serious injury (DSI) WHEN? WHY? System failure A weekday afternoon. Two in three crashes are caused by 3-6pm on a weekday is the most system failure, not reckless behaviour. common time for a DSI to occur WHO? WHERE? Someone outside 50km/h arterial road close to home, a vehicle with no crash history Two in three serious injuries are someone walking, cycling, scooting or motorcycling. Young people, older people, Māori and people walking, cycling and motorcycling are over- represented in road harm in Auckland. References (clockwise from top): WHEN: The most common time for Auckland deaths or serious injuries from 2016-2020 was during weekday mornings (6am-9am) and afternoons (3pm-6pm), with the afternoon peaks being higher. WHY: Mackie, H. 2017. Serious injury crashes: How do they differ from fatal crashes? What is the nature of injuries resulting from them? An AA research foundation NZ study found that in around two thirds of crashes where vehicle occupants were killed or seriously injured, the drivers were generally following the rules of the road, but made a mistake. These unintentional errors leading to serious harm were termed 'system failures' by researchers. WHERE: 58% of Auckland DSI from 2016- 2020 was a 50km/hr arterial roads. Burdett, B, Starkey, N and Charlton, S. 2017. The close to home effect in road crashes. This University of Waikato research shows New Zealanders are more likely to be injured close to home, with roads within 11 km of home accounting for half of all travel and 62% of all crashes. Safety Science vol 98. Road to Zero Action Plan 2020-2022. WHO: Ministry of Health overnight hospitalisation data in Koorey, G. 2021. Safety of people traveling outside vehicles deep dive 2021.
We promote good choices
    but plan for mistakes
    Most crashes are caused by a momentary lapse such as
    micro-sleeps or errors of judgement. Serious harm occurs
    when that happens without a safe system.                                                                                              The most skilled drivers (licenced race and
                                                                                                                                          rally car drivers) have the most crashes on
                                                                                                                                          public roads
             Around 25% of men and 10% of
             women in New Zealand suffer from
             Obstructive Sleep Apnoea (OSA).
                                                                                                                                     2021 research showed two out of three
                                                                                                                                     NZ drivers take medication likely to cause
                                                                                                                                     impairment.
       97% of New Zealanders say their own
       driving is good or excellent and 44% of
       other New Zealanders’ driving is poor
       or very poor.
                                                                                                                                           In-depth Monash University study found
                                                                                                                                           the most common cause of driver
                 AUT research suggests more than one in 10 New Zealand                                                                     inattention was having inward thoughts
                 workers might be experiencing burnout: physical or mental
                 problems due to stress or overwork.

     References (clockwise from top): Job, Soames. 2020. The Psychology and Politics of Speed, Speed and Speed Management in Road Safety Policy, Speed Input Paper, European
     Commission Executive Seminar. https://www.nzta.govt.nz/safety/driving-safely/medication/. Monash University, 2020, Enhanced crash investigation study.
     https://www.nzherald.co.nz/lifestyle/feeling-the-burnout-more-than-1-in-10-new-zealanders-are-stressed-at-work/OJCIQBYZGSI6NULKP4FOCCIGHQ/. Reference: 2021 Public
8    Perceptions of NZ Road Safety: Penalties and Enforcement
     https://www.healthnavigator.org.nz/health-a-z/o/obstructive-sleep-apnoea/
From historical experiment… The story of our 50km/hr speed limits starts more than 90 years ago, when cars looked like this and we followed Britain’s decision to try a 30 m.p.h (48km/h) speed limit. Prior to 30 m.p.h, Britain had experimented with no speed limits, which had led to a spate of road deaths. Evening Post, Wellington, 21 and 23 November 1936 In 1936, local bylaws to lower speed limits when going through town, passing schools, intersection crossings and ‘notoriously dangerous spots’ were abolished for a 30 miles an hour (48km/h) national default. “The decision of the Minister of Transport (Mr. Semple) to remove local restrictions is no doubt based on a similar step taken in Britain last year” “England, it was remarked by one who has been there, had gone back to 30 m.p.h after removing all speed limits. This did not say that England was satisfied with the 30 miles limit, but was merely endeavouring to get back towards something safer than it had”
To evidence-based risk management
We use risk management every day, mixing people with
low risks and physically separating people from fatal risks.

One year on, Auckland roads where speed limits
were changed on June 2020 have had a 67%
reduction in fatalities while deaths increased across
Auckland overall.

                                                               Low electrical   Higher electrical
                                                               current          current

         Low height             Higher height
A safe road system: why speed matters
“Speed is the pathogen, insofar as kinetic energy
is the causative agent of injury”
Survivability rates vary based on a number of factors and scenarios. AT takes a preventative approach with respect to the survivability of our
most vulnerable road users. Data taken from Research Report AP-R560 published in March 2018 by Austroads – the Association of
11 Australian and New Zealand Road Transport and Traffic Authorities. Quote on top of page from Peden, M and Breen J. 2020 Managing
speed and links with other policy areas, Speed and Speed Management in Road Safety Policy, Speed Input Paper, European Commission
Executive Seminar.If we could see the risk of speed, roads might look like this: Unprompted, New Zealanders say speed is our biggest road safety issue. Reference: 2021 Public Perceptions of NZ Road Safety: Penalties and Enforcement
Interim speed management plan 2023-26
     Working objectives
     Outputs: What we make                                Results:                                            Benefits:
                                                          Shorter term outcomes                               Longer term outcomes
     Primary outputs:                                     •   Build on success of safe speeds programme       • Less road death and serious injury
                                                              by leading change and engagement
     1. An approved interim Speed Management Plan                                                             • Increased safe active mode use, including
                                                              partnership with communities
        2023-2026 including implementation plan and                                                             to school
        geospatial map                                    •   Accelerate safe speed limit setting following
                                                              the new Rule and Road Safety Business           • Less greenhouse gas emissions due to reduced
     2. Budget and co-funding approved to deliver first                                                         vehicle kilometres travelled
                                                              Improvement Review 2021
        implementation plan
                                                          •   Safe speeds protect people outside vehicles     • Increased community understanding and
     3. Three-year speed management programme                                                                   support of speed management
                                                              and encourage active mode use
     Interim outputs: (key interim outputs only)                                                              • Improved equity in road safety outcomes
                                                          •   Principles based approach to speed
     1. Develop and deliver an aligned                        management where safe speed limits are            including for Māori
        communications and engagement plan with key           supported by engineering, enforcement and
                                                                                                              • Improve public health outcomes through active
        partners                                              education interventions
                                                                                                                mode shift and less road noise
     2. Research to understand customer benefits,         •   Tāmaki Makaurau Transport Safety
        health and climate change, and economic                                                               • Improved journey time reliability
                                                              Governance Group partners deliver a
        impact                                                comprehensive, cohesive and collective
     3. AT’s speed limits migrated to national speed          communications and engagement plan
                                                                                                                         Note: Blue text shows outcomes linked to Road to Zero.
        limit register                                    •   Robust monitoring data used to identify
     4. Enhanced monitoring and evaluation system             and deliver further engineering, enforcement
                                                              and education interventions post speed limit
     5. Data analysis on equity in road harm                  changes

13
Primary benefit: safety
Working performance indicators
Output indicator Lead performance indicator Benefits (lag) indicator
• Kilometres of network treated with speed • % of road network where speed limits • # overall DSI reduction**
limits to align with Safe and Appropriate align with Safe and Appropriate Speed
• # of pedestrian and cyclist DSIs**
Speed
• Mean speed of vehicles (urban, rural,
• # of motorcyclist DSIs**
• Kilometres of high risk roads treated with urban centres)
speed limits to align with Safe and • # of ACC entitlement claims related to
• % of road network covered by
Appropriate Speed* walking and cycling injuries (motor
automated safety cameras
vehicle involved)
• % of schools with 30km/h speed limits
• # of DSIs where the speed limit does
• % of schools with 60km/h speed limits or
not align with the Safe and Appropriate
lower***
Speed
• Mobile speed camera deployment
activity (hours)
• Number of Police operations targeting
restraints, impairment, distraction and
speed offences
Note: Blue text are Road to Zero indicators. Black text align with Waka Kotahi Speed and Infrastructure Programme.
* In this indicator ‘high risk’ means ‘high’ or ‘medium high’ collective risk in Urban KiwiRap and at the time when the speed changes were made.
‘Safe and Appropriate Speed’ in these indicators refer to what was defined as such at the time when speed changes were made. Posted speeds
lower than the Safe and Appropriate Speed also meet this indicator. These are cumulative indicators based on adding the total kilometres of
roads together across the duration of the programme.
** When reporting on these indicators we will explore using Ministry of Health data in additional to Crash Analysis System data to provide a more
complete picture of death and serious injury.
*** Awaiting update to Road to Zero indicators following release of new Speed Management Guide guidance on school speed limits
14Co-benefits
Working performance indicators
Benefit Output indicator Lead performance indicator Benefits (lag) indicator
(links to AT
objectives and
business cases)
Climate change • Climate change and health research • Perceived safety of walking and cycling (by • Reduced greenhouse gas emissions by xx%
(links to climate quantifies potential benefits rural, urban, urban centres, & around schools)
change strategic • Safety indicators • Reduced vehicle kilometres travelled or
spotlight) increase in safe active mode use
Equity • Equity data analysis completed on who is • Consultation document includes voices of • Improved equitable transport safety outcomes
(links to supporting over-represented in road harm including impacted communities for Māori and all road users
Māori wellbeing Māori road safety outcomes • Explore options to better represent feedback
outcomes business by population demographics and road harm
objective)
Health • Safety indicators • Increase safe active mode use • Public health benefits through transport mode
(links to walking and • Climate change and health research • Increase in active mode use to school shifts
cycling programme quantifies potential benefits • Reduced traffic noise by xx%
business cases)
Operational • Safety indicators • Safety indicators • Increased journey time reliability
(links to optimisation
business case)
Leading change • Customer benefits research • % of the general public who understand the • Community understanding and support of speed
(links to Whirinaki, • Delivering a partnership based risk associated with driving speed management
building trust, mana communications and engagement approach • % of the general public who agree that they
and confidence with communities are likely to get caught when driving over the
strategic spotlight) • Tāmaki Makaurau Transport Safety posted speed limit
Governance Group collective • % of the general public who agree that safety
communications and engagement plan cameras are an important intervention to
reduce the number of road deaths
Note: Blue text is Road to Zero indicator. Black text are additional indicators that may need to be refined and data sources established.
15Draft working principles
These principles are intended to remain consistent across the interim and 10-year plan.
Tiakitanga, the safety of people, is the first priority in speed management.
Speed management work supports climate change, health, equity, and operational co-benefits.
Speed limits are supported by infrastructure planning, design and operation, effective deterrence, and
community engagement.
Speed management considers the functions of roads and streets* - movement, place, strategic modes - and
how many people travel outside vehicles.
We manage safety risks and use lower ends of speed limit ranges unless safety infrastructure allows otherwise.
Engineering treatments focus on places with high risk, operating speed, active mode or co-benefit priority.
We work in partnership in governance, design, delivery, enforcement and monitoring.
We continuously monitor all changes and respond agilely with further treatments when needed.
*AT’s Future Connect and Roads and Streets Framework tools to be used.Draft working focus areas These focus areas guide location selection in the interim speed management plan: • Areas around community destinations and places with high active mode priority. • Rural and urban roads with higher risk of death or serious injury. • Places where speed calming engineering or safe infrastructure is being funded by other parties. • Places where there is community demand for safe speeds. • Places where safe speeds complement other infrastructure investment.
How to share local knowledge and
insights

      Online map
      Go to haveyoursay.at.govt.nz/auckland-speed-management-plan-partner-
      knowledgebase
      Please mark on the online map the areas or roads where you are aware of speed
      issues, and, which are not covered by existing proposals.

      Written feedback
      Local boards may choose to delegate the provision of formal feedback to one
      member, or provide feedback via a business report by 31 March 2022.
Tēnā koutou Thank you For more information, please contact: Programme Director, Nathan Cammock Nathan.Cammock@at.govt.nz or Transport Safety Technical Lead, Ping Sim ping.sim@at.govt.nz
You can also read