NSW Business Conditions - December 2020 - Agribusiness Regional ...
←
→
Page content transcription
If your browser does not render page correctly, please read the page content below
NSW Business Conditions
                                 December 2020
      Quarterly snapshot of the NSW economy informed by
                                  the businesses of NSW
NSW THIS QUARTER
Overview: The NSW Business Confidence Index reached positive territory in December 2020 for the first time since
the June quarter in 2018 (p. 4). This strong performance came before new COVID-19 restrictions were introduced over
the Christmas-New Year period. The restrictions are expected to reduce confidence and business conditions,
particularly for affected regions and industries.

The improvement in business confidence in December 2020 reflected growing optimism about the economic situation
as major restrictions from earlier in 2020 were lifted. Business communities responded positively to the reopening of
both the NSW-Victoria and NSW-Queensland borders, with the heavily impacted Murray and New England and North
West regions showing the strongest rebound compared to September.

Each of the key measures assessed in our survey showed improvement. With government restrictions easing,
consumer spending continued to recover, helping more businesses to increase sales revenue and profitability. This
better operating environment helped more businesses to hire staff and increase capital spending, compared to the
September quarter.

However, full recovery remains a long way off. Businesses continue to struggle financially, with more reporting
decreases in staff and reduced capital spending than reported increases. It will require further strengthening in
consumer spending for these businesses to operate at a capacity level where they begin to rehire and reinvest. One
quarter of respondents reported a high risk of business failure when support measures such as JobKeeper end.

State and industry development: Despite overall improvement, regions directly impacted by the recent southern and
northern border closures tracked behind the rest of the state. Regions that are most reliant on interstate and
international visitors, including Illawarra, Newcastle, and Eastern Sydney (including the CBD and Northern Beaches),
reported relatively lower activity than other parts of the state. This suggests that businesses in these regions have less
capacity to absorb a further hit from a reimposition of stricter restrictions should the December-January 2021 COVID-
19 outbreak worsen.

Accommodation, food services and retail continued to bounce back after being hardest hit in the June quarter. Arts and
recreation services are falling behind relative to the rest of the economy, as restrictions still in place severely affect their
operations.

While the December survey showed signs of recovery, the survey period preceded the implementation of tighter
restrictions within NSW and in the other states in late-December. These restrictions are expected to slow business
activity, with the regions and industries already most severely impacted at greatest risk of further deterioration.

Detailed survey results, including regional and industry-level data, can be found at
https://www.businessnsw.com/advocacy/surveys/business-surveys.

Survey contact: Thian Thiumsak | thian.thiumsak@businessnsw.com

BUSINESS NSW
Formerly the NSW Business Chamber, Business
NSW is the peak policy and advocacy body which
has been representing businesses in NSW since
1826. Business NSW is one of Australia’s largest
business support groups with a direct
membership of 20,000 businesses. Business
NSW works with government and industry groups,
as well as business and community leaders, to
provide a voice for our members. Operating
across a metropolitan and regional network,
Business NSW represents the needs of business
at a local, state and federal level.

THE NSW ECONOMY

 NSW unemployment                                87% of NSW jobs lost*                            6.8% increase in NSW
 rate 6.5%                                       have been recovered                              State Final Demand*
 23,853 people re-joined the NSW                 Compared to 83% for the whole of                 The second strongest rebound in
 labour force in November while                  Australia                                        Australia in the September quarter
 participation continued to strengthen
                                                 *based on employed persons in November           *Q3 2020 compared to Q2 2020

                                                                                                  The bottom line

                                                 Card Spending*                                   Business confidence was increasing
 Gross State Product* to                                                                          in December, but new restrictions on
 fall ¾ per cent in 2020-21                      grew 13%                                         people’s movements and cross-
                                                 Despite continued solid goods                    border travel may jeopardise the
 Before rebound to 2 ½ per cent in                                                                anticipated recovery.
                                                 spending, services spending has
 2021-22
                                                 been negatively impacted from the
 *NSW Treasury forecast                          new restrictions.
                                                 *The period covers the 4 weeks to 8 January
                                                 2021 with growth compared with the same time
                                                 last year

 Source: ABS, NSW Treasury, Business NSW, Commonwealth Bank.

 NSW INDUSTRY INDICATORS

      NSW retail turnover                         NSW visitor arrivals                          NSW building approvals
Per cent                                  000s                                              $Bn

15
                                                           Visitor arrivals: NSW            5                         Non-residential
                                          450
                     Growth (YoY)                                                                                     Residential
                                          400
10                                                                                          4
                                          350
 5                                        300
                                                                                            3
                                          250
 0
                                          200
                                                                                            2
 -5                                       150

                                          100                                               1
-10
                                           50

-15                                         0                                               0

           Note: Seasonally adjusted             Note: Arrivals by state of main stay,                     Note: By value,
                                                  unadjusted for seasonal variation                      Seasonally Adjusted

 Source: ABS
SURVEY RESULTS
Conditions were improving ahead of new restrictions over Christmas and New Year
Performance of the NSW economy
50
25.1
30 21.2
10
-10
-30
-50
Current Expected
-70
-90
Staff numbers and capital spending
20
10
0
-4.3
-10
-7.0
-20
-30
Number of Employees Capital Spending
-40
-50
Individual business performance
50
40
30 19.0
20
10
0
-10
-20
-9.8
-30 -20.4
-40
-50 Operating Costs Sales Revenue
-60
-70 Profits
-80
-90
Note: Index scores are calculated as the percentage of respondents reporting an increase minus the percentage reporting a decrease. A positive
number implies improving business conditions (except for operating costs for which it implies cost pressures) whereas a negative number implies
weaker conditions. There were 546 respondents to the survey.KEY FINDINGS
• Performance of the economy
The NSW business confidence index turned positive for the first time since the quarter of June 2018, with more
businesses viewing the economy as getting stronger (46.7 per cent) than viewed it as getting weaker (25.5 per
cent) (p.4). However, this robust recovery came before the reimposition of restrictions due to the new Greater
Sydney COVID-19 clusters, which could potentially deteriorate confidence and conditions.
• Businesses at risk
Despite overall increases in confidence, 23 per cent of businesses state that they are at a high risk of failure when
supports such as JobKeeper, tax relief, interest waivers and other measures end (p. 7). This vulnerability will hang
over the small business sector for much of the year and will need to be factored into decisions around when and
how support measures are withdrawn.
• Business expansion
An increasing number of businesses are looking to expand their capacity to meet demand, with more businesses
prioritising expansion (38.4 per cent) than those who are prioritising downsizing their business (29.9 per cent) for
the first time since the December quarter of 2019 (p. 6).
• Business performance
The proportion of businesses reporting higher revenue and profit over the three-month period continued to grow
from the September quarter (p. 4) . However, these businesses remain a minority. Compared to the July-
September period, 41.6 per cent of businesses indicated revenue was lower in October-December, and 48.1 per
cent indicated profit was down over the same period. More businesses reported rising operating costs (37.4 per
cent) than reported a fall (18.3 per cent).
• Hiring challenges
Hiring still lags improvements in other key measures (p. 4). Only 16.7 per cent of respondents reported increased
staffing levels over the December quarter, though this represents an improvement over the September quarter
(11.4 per cent). There has been a modest increase in businesses reporting increased capital spending over the
previous quarter (28.8 per cent in December compared to 23.6 per cent in September).
COMMENTS FROM BUSINESSES
“Our business is starting to recover with borders now open and restrictions
easing. This was only possible due to the huge support from government with
financial assistance with JobKeeper.”
Transport, Postal and Warehousing business, New England and North West
“We are now in a position where we are growing our business. We would not
be able to consider doing so without the financial supports we received. We
have been focused on growing our business next year.”
Education and Training business, Greater Sydney
“My business relies on tourism. Although there has been an increase in
regional tourism I am still struggling to get customers at the rate I need
them.”
Arts and Recreation Services business, Central WestTHE BUSINESS ENVIRONMENT
Business priorities*
90
70 Dec-20 Sep-20
50
30
10
-10
Growing revenue Reducing business Hiring people with the Expanding the Downsizing my
costs right skills/capabilities capacity of my business
business to meet
demand
*Index scores calculated as the percentage of respondents indicating the priority was more important minus those indicating the priority was less
important. A positive number implies a priority is becoming more important whereas a negative number implies a priority is becoming less
important.
Factors weighing on business*
20
0
-20
Dec-20 Sep-20
-40
Regulatory environment Access to finance Weather-related events Business solvency
*Index scores calculated as the percentage of respondents indicating the factor was more favourable minus those indicating the factor was less
favourable. A positive number implies an improvement whereas a negative number implies a deterioration.
Business costs*
60
Dec-20 Sep-20
50
40
30
20
10
0
*Index scores calculated as the percentage of respondents indicating the cost was less affordable minus those indicating the cost was more
affordable. A positive number implies increasing cost pressures whereas a negative number implies falling costs.COVID PULSE
Business NSW is asking a series of COVID-related questions to track business attitudes over the recovery period. The
observations for December are presented below.
When thinking about your business, how optimistic are you about the
impact of COVID-19 compared to three months ago?
45% 42%
40% Dec-20 Sep-20
35%
30%
30%
25%
20%
15% 13%
11%
10%
5%
4%
0%
Much more optimistic More optimistic About the same More pessimistic Much more
pessimistic
What is the risk your business will face serious challenges when support
measures such as JobKeeper, tax relief, interest waivers and other measures
end?
50%
45%
40% 36% Dec-20 Sep-20
35%
30% 27%
25%
20% 23%
14%
15%
10%
5%
0%
High risk - my business Medium risk - it will be a Low risk - my business is No risk - my business is
may fail at this time challenging time but my well-placed but things will strong and will not notice
business will see it through become harder any impactsREGIONAL PERFORMANCE
Business Confidence#
Unemployment Youth
Region December 2020 Past Four
Quarter Quarters rate* Unemployment rate*
(Index) (Index)
NSW 21.2 (n=546) -34.5 (n=3924) 6.5% 13.2%
Central Coast 22.2 (n=19) -28.5 (n=137) 5.3% 9.9%
Capital Region 13.8 (n=33) -54.0 (n=226) 4.3% 7.1%
Central West 24.0 (n=26) -37.2 (n=172) 4.2% 8.9%
Coffs Harbour – Grafton 33.3 (n=16) -31.5 (n=130) 8.3% 13.7%
Far West and Orana 11.1 (n=10) -29.8 (n=84) 1.8% 3.9%
Hunter Valley 15.8 (n=22) -30.5 (n=190) 5.7% 14.6%
Illawarra 4.8 (n=24) -46.0 (n=189) 7.0% 16.1%
Mid North Coast 58.8 (n=19) -41.2 (n=170) 7.9% 16.1%
Murray 41.2 (n=18) -24.4 (n=172) 4.6% 7.0%
New England and North West 17.9 (n=40) -34.5 (n=194) 6.4% 13.4%
Newcastle and Lake Macquarie 31.6 (n=19) -28.8 (n=212) 7.6% 17.5%
Richmond – Tweed 31.7 (n=43) -25.9 (n=243) 5.0% 9.5%
Riverina 21.4 (n=15) -33.1 (n=127) 5.4% 6.3%
Southern Highlands and Shoalhaven 40.9 (n=23) -25.2 (n=123) 4.7% 8.4%
Sydney 14.1 (n=125) -36.3 (n=1449) 6.0% 12.9%
Eastern Sydney^ 12.5 (n=89) -37.0 (n=1045)
Western Sydney^ 20.0 (n=36) -34.2 (n=403)
*Data updated as of 12 January 2021, annual averages used for regional unemployment rates (excluding NSW). This averaging method obscures the full impact of
COVID-19 on regional labour markets. #Index is calculated as the percentage of respondents reporting a stronger economy minus the percentage reporting a
weaker economy. A positive number implies improving conditions while a negative number implies conditions are weaker. ^Eastern Sydney includes Eastern City,
North and South districts; Western Sydney refers to Western and Central cities as designated by the Greater Sydney Commission. Full regional results available at:
https://www.businessnsw.com/advocacy/surveys/business-surveys.
CONFIDENCE MAP Richmond
- Tweed
Confidence map
weighting is based Coffs
on business New England Harbour-
and North West Grafton
confidence levels in
the December Far West and Orana
quarter relative to the
NSW average.
Mid North
Coast
Hunter
Newcastle
Central West Central Coast
Murray Sydney
Illawarra
Riverina
Southern Highlands
and Shoalhaven
Capital Region
Below Average Above
Average Average
Source: ABS, Business NSW Business Conditions Survey
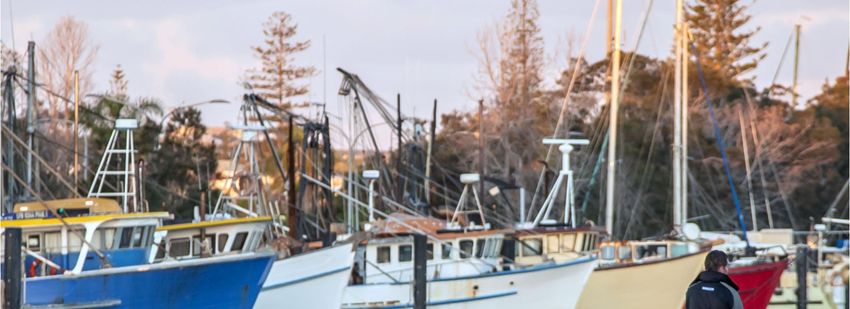
Cover image by Lynda HintonYou can also read