Nutrient and BOD Overloading in Fresh Waters
←
→
Page content transcription
If your browser does not render page correctly, please read the page content below
Lecture 10

         Nutrient and BOD Overloading
                in Fresh Waters
 Last Time
 1.Nutrients and Nutrient Overloading

 Today
 2. Organic Matter (“OM”) discharge and BOD Overloading
         a. general watershed effects
         b. point sources
                                                     GG425, wk5 L10, S2015

DOC content and biological activity.

Nutrient overloading to fresh water, as discussed in last lecture
can take numerous forms, such as:

a. fertilizers
b. sewage
c. detergents/cleaning agents
d. excessive topsoil erosion

All 4 forms will increase total organic carbon (TOC) in the
environment from fertilization, but sewage discharge also results
in TOC increases directly from the OM content of the waste.

                                                     GG425, wk5 L10, S2015

                                                                             1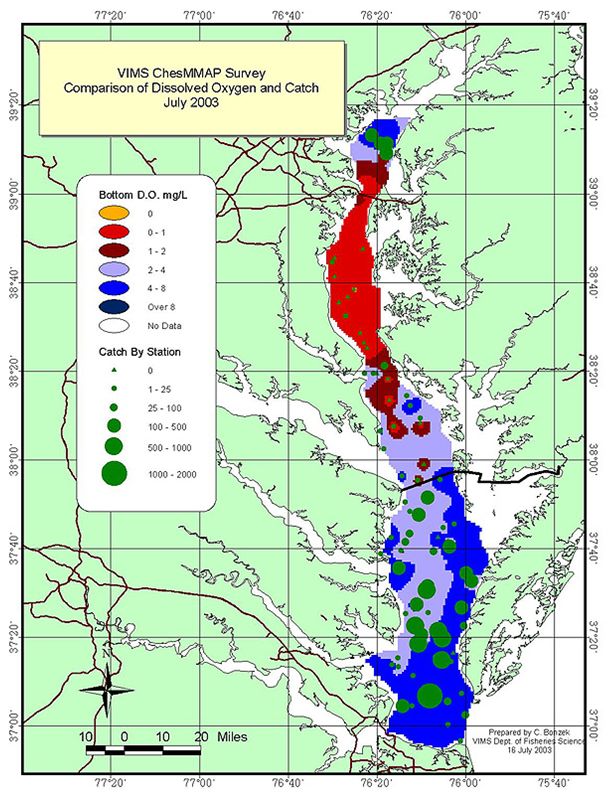
DOC content and biological activity.

Organic Matter can be also introduced into the environment as:

a. point sources
         which cause more localized shifts in water quality, at least
initially before dispersion.

b. dispersed sources
       which watershed-wide shifts in water quality.

                                                       GG425, wk5 L10, S2015

Variations in Environmental OM Concentrations

In general:

higher rate of biological productivity (photosynthesis and
respiration) = higher natural TOC in an environment.

Water soluble components of TOC will dissolve, creating higher
DOC where biological productivity is higher.

Some pollutant DOC follows the same pattern (i.e., pollutant
DOC that results from increased biological activity per unit area
of watershed, such as industrial agriculture and urban
effluents).

                                                       GG425, wk5 L10, S2015

                                                                               2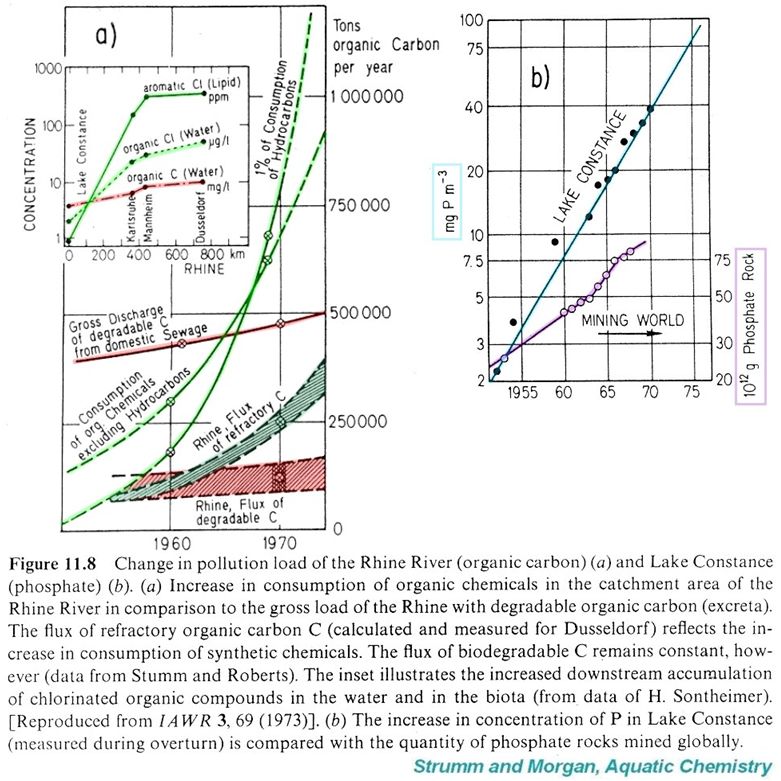
dispersed OM/Nutrient sources

     The concentration of natural
     and pollutive DOC is also
     inversely proportional to the
     flow rate of a river.

     There is a loose correlation
     between number of human
     inhabitants in a watershed and
     DOC concentration.

     The effects of human DOC
     loading are worse where low
     flow rivers traverse heavily
     populated areas.

                    GG425, wk5 L10, S2015

N   The Human DOC load
    largely comes from two
    sources:

    1. human organic wastes

    2. Nutrient wastes.

    Note that Nutrient loading
P
    of a watershed in also
    proportional to population

                    GG425, wk5 L10, S2015

                                            3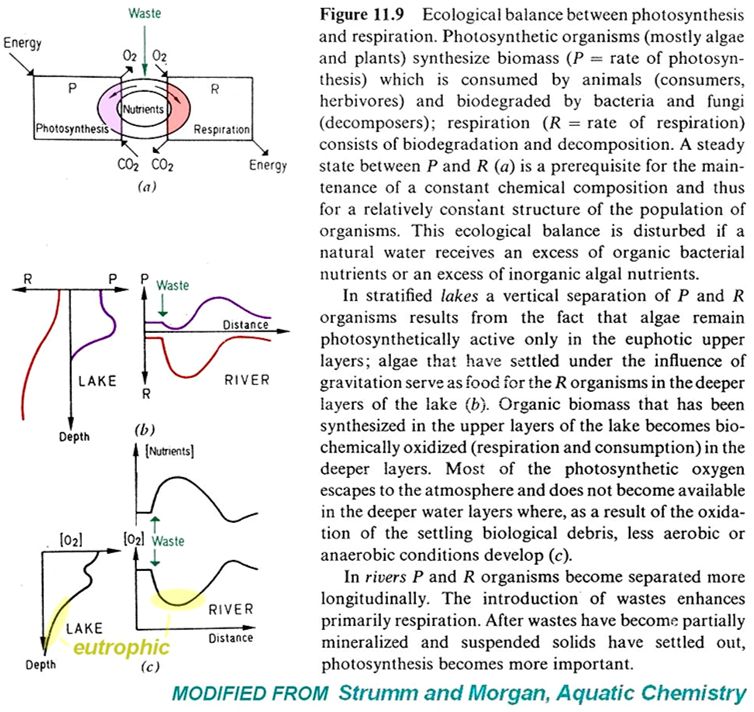
All DOC, whether natural or from human sources, is
 partially decomposed by respiration.

 More often than not it isn’t all transformed to DIC, leaving
 modified DOC behind, which can still place a BOD stress on the
 environment.

 Also...

 The more labile pollutive DOC compounds are reduced in
 concentration by respirative decomposition
    (which makes sense, since the biologicaly-mediated
    digestion of organic matter is used as a waste-control
    measure in some environments).

 The more refractory pollutive DOC compounds are not reduced
 in concentration by respirative decomposition, which causes
 them to accumulate in the environment.             GG425, wk5 L10, S2015

DOC and P loading in the Rhine river and Lake Constance          This has caused
                                                                 increased P and DOC.
                                                                 Biologically-labile DOC
                                                                 compounds did not
                                                                 increase much over this
                                                                 period of this study
                                                                 even though inert DOC
                                                                 (refractory compounds)
                                                                 increased steadily.
                                                                 Reactive DOC
                                                                 decomposition
                                                                 provides a means for
                                                                 rivers to acquire large
                              Notice that DOC loading
                              corresponded to an increase in P
                                                                 concentrations of
                              concentration in lake Constance    refractory DOC
                              (in the upper Rhine drainage).     compounds without
                                                                 others, which can have
                                                                 a large effect on water
                                                                 quality

                                                                     GG425, wk5 L10, S2015

                                                                                             4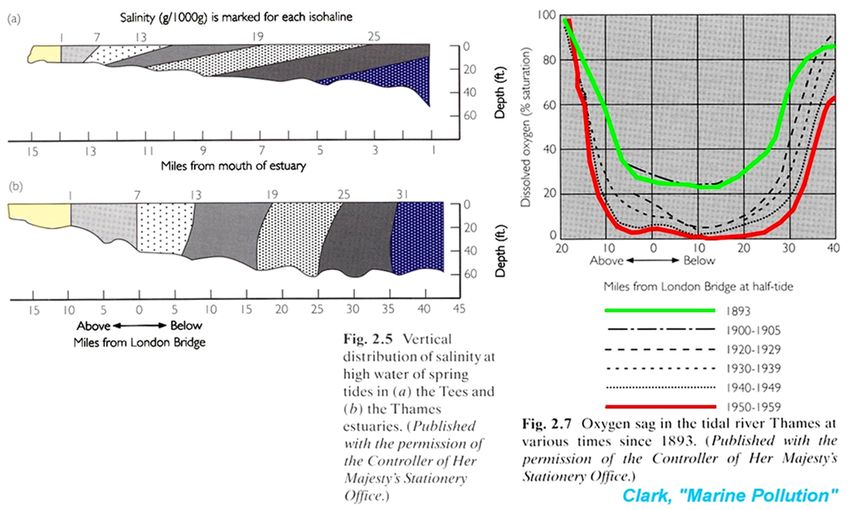
Nutrient laden OM overloading of Rhine drainage surface waters
led to a pronounced dissolved O2 depletion during the 1970's.

The effect is much like we saw in lakes last time, although the
problem was identified and amended before O2 was depleted to
eutrophic levels.
                                                   GG425, wk5 L10, S2015

excessive topsoil erosion
Soils and diverse flora such as occurs in
natural forests strongly regulate OM and
nutrient output to surface and ground waters
of a watershed through biosphere-geosphere
cycling.

Deforested watersheds lose this ability, so
that in addition to enhanced soil erosion, one
often finds increased DOC and nutrient
loading of local surface water reservoirs in the
decade or so after the forest was removed.

In this example:
DOC increase and
associated pH decrease
results in large increases
of (plant toxic) Al in the
same river after
deforestation.
                                                   GG425, wk5 L10, S2015

                                                                           5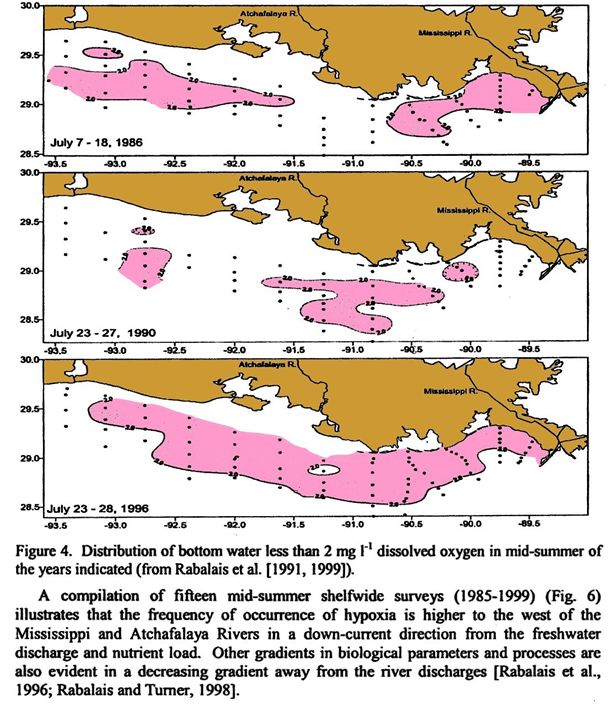
Point source loading of
urban wastes into rivers and lakes
High BOD wastes
containing contaminant
levels of nutrients like
N and P and/or
DOC/POC produces
some additional effects
that can be predicted
using our Redfield ratio
stoichiometry and the
physics of water flow.
This figure gives the
schematic the
relationship between
photosynthesis,
respiration and DOx in
a lake and a river near
a point-source waste
outfall.
GG425, wk5 L10, S2015
OM point source loading in a lake:
point source nutrient loading enhances surface photosynthetic
productivity, even when there are significant particulate levels in
the waste (particularly if they settle out quickly).
This sort of BOD loading also speeds the rate of eutrophism.
While there will be some radial distribution of enhanced activity
around the point source of waste effluent, this is generally
obscured by currents in the lake.
GG425, wk5 L10, S2015
6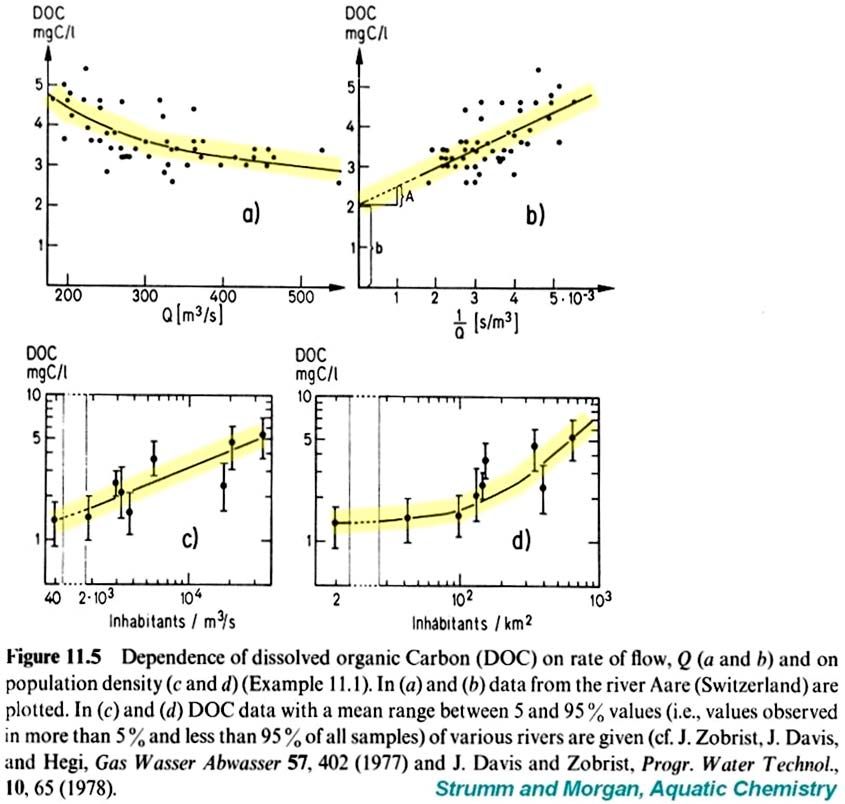
OM point source loading in a river:

                                                            GG425, wk5 L10, S2015

Particulates are kept suspended during flow past the point-source. The
waters are turbid so BOD loading causes photosynthesis to initially
diminish (or cease).

Decomposition of the waste releases DIN and DIP into the waters.

The nutrient load will cause an algal bloom in the water.

This will cause downstream turbidity even if the waste stream isn't
high in particulates, with subsequent diminishment of the amount of
photosynthesis relative to the unpolluted condition.

Downstream of the point source respiration continues unchecked and
therefore without photosynthetic replenishment [O2] and pE decreases.

If the waste has very high BOD the river can go eutrophic.

At some point further down river (once the particulates have settled
appreciably) photosynthesis takes over again and can even exceed
respiration, casing an upward "bump" in [O2].            GG425, wk5 L10, S2015

                                                                                    7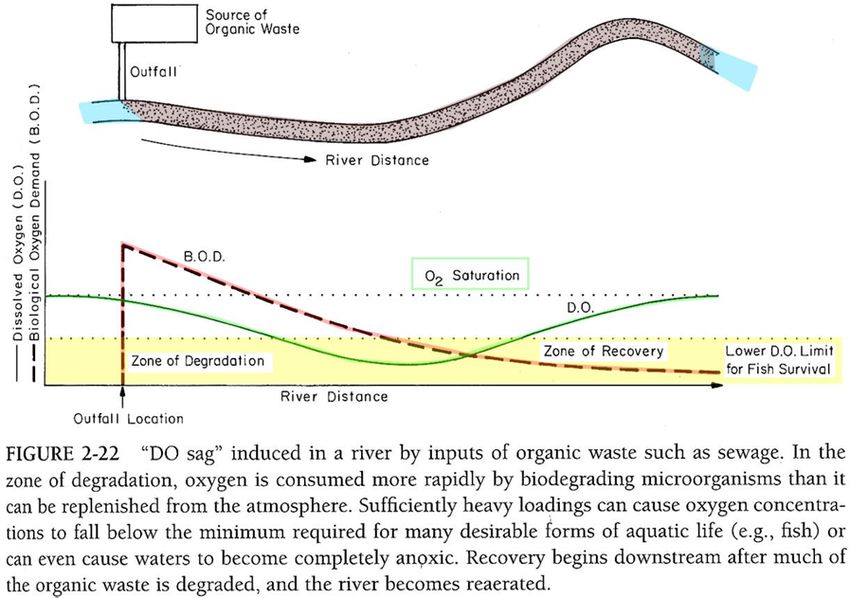
The biological and chemical effects of point source waste
 loading of this type can make water treatment for human
 consumption from this source very challenging.

                                                                           GG425, wk5 L10, S2015

DOx - dissolved O2
Before understanding the effect of high BOD waste on water quality, let’s
review the concept of gas saturation.
        Gas saturation is governed by Henry’s law (see week 5).
        [O2 (aq)] = (KHO2)( PO2)      KHO2 is highly temperature dependent
O2 mg/L= 8.6 at 25°C and 14.6 at 0°C
   Nomogram for sea level and “average” barometric pressure.

                                                               DOx % saturation values can
                                                               be determined for a given
                                                               temperature using this
                                                               “nomogram”.
                                                               Draw a straight line between a
                                                               DOx mg/l value and the water
                                                               temperature in degrees C.
                                                               The percent saturation is read
                                                               where the line intercepts the
                                                               saturation scale.

  http://waterontheweb.org/under/waterquality/oxygen.html                  GG425, wk5 L10, S2015

                                                                                                   8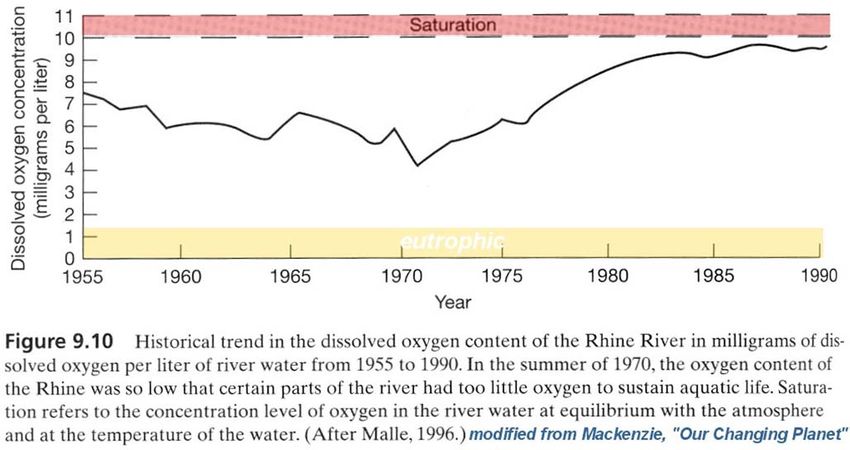
DOx - dissolved O2
Some terminology related to dissolved oxygen:
Definition:
Hypoxia is "low oxygen."
• In aquatic ecosystems, hypoxia occurs when dissolved
oxygen falls below 2 mg/L, which is about the lowest level
needed for healthy benthic (bottom dwelling) communities.
• Most organisms living above the bottom, such as fish,
need >4 mg/L.
• Hypoxic areas are sometimes called "dead zones",
because only organisms that can live without oxygen (such
as anaerobic microbes) live in these areas.
• Hypoxia is primarily a problem in estuaries, coastal
waters, and some freshwater lakes.
Definition:
Anoxia is a complete lack of oxygen (0 mg/L)
GG425, wk5 L10, S2015
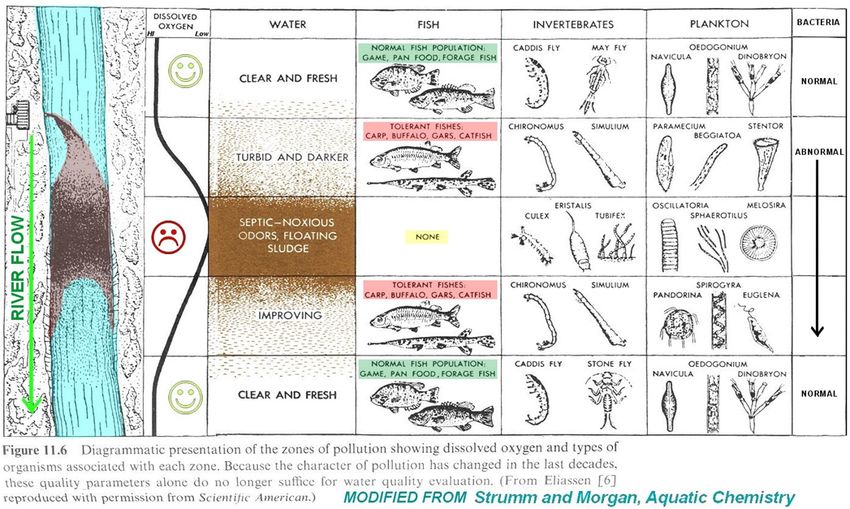
The qualitative evolution of DOx (dissolved oxygen) flow a
pulse of oxidizable BOD pollutant is depicted in this figure:
The simplest quantitative treatment of DOx evolution is the
“Streeter-Phelps” model, originally developed to study
sewage effluent plumes in space and time.
GG425, wk5 L10, S2015
9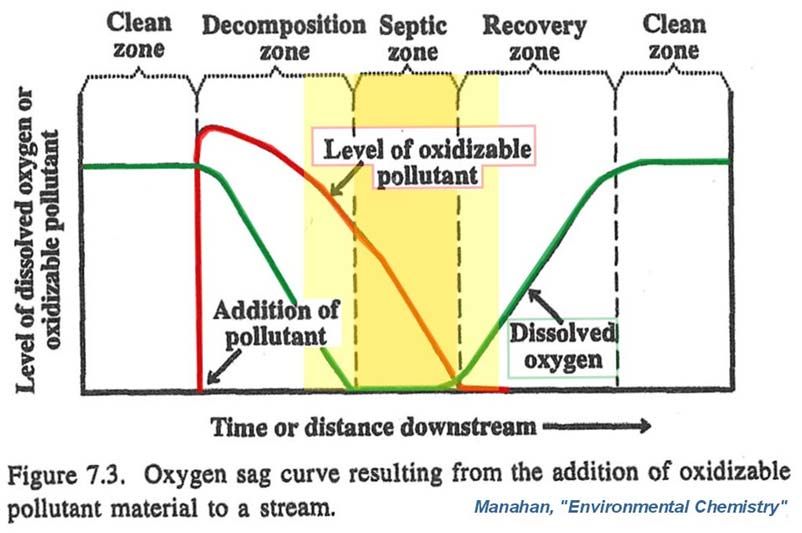
Let’s look at a simplified version of the “Streeter-Phelps”
model in this example problem.

   After mixing of a sewage effluent plume completely with
   river water, the total organic carbon content of the river
   water is 6 mg/L.

   If the ambient temperature is 25º C, will the river water
   become hypoxic by complete TOC digestion?

                                                    GG425, wk5 L10, S2015

Solution:

The DOx concentration for 100% air saturated water at sea
level is 8.6 O2 mg/L at 25°C.

TOC = 6 mg/L

If the TOC is algal protoplasm, the Redfield Ratio in mass
equivalents tells us 140 mg of O2 are consumed by complete
decomposition of 100 mg of TOC (see box model last Lecture)

   6 mg TOC            x     140 mg O2           = 8.4 mg O2
      L                      100 mg TOC                consumed

)O2 = 8.6-8.4 = 0.2 mg/L = 2.3% saturation.

YES, this is Hypoxic
                                                    GG425, wk5 L10, S2015

                                                                            10
Why is this overly simplistic?
The calculation implicitly assumes the OM will be consumed
instantly, but we know that this is not the case.
OM degradation will proceed following a reaction rate law.
Plus, as degradation proceeds diffusion and mixing in the river
will partially replenish the oxygen consumed.
Assuming that all of the OM is degradable....
If OM degradation (and thus oxygen consumption) is fast,
compared to reaeration, then the river will become hypoxic.
If OM degradation is slow compared to reaeration then the
waters will not become hypoxic.
GG425, wk5 L10, S2015
A BETTER CALCULATION!
Biological Oxygen Demand (BOD) = amount of O2 required by
bacteria to oxidize readily degradable total organic carbon .
Mole BOD: mol O2 = 1:1 for CH2O + O2 ↔ CO2 + H2O
Mole BOD: mol O2 = 1:1.4 for redfield ratio eqn
BOD is traditionally measured in a 5 day incubation that
measures total oxygen consumption, although change in total
organic carbon can be measured instead.
The rate of organic matter oxidation in the water follows a 1st
order kinetic rate law, so the temporal evolution of BOD can be
written as:
BOD = BOD0 (e-kt) [where “0” indicates the initial value]
GG425, wk5 L10, S2015
11A BETTER CALCULATION!
BOD = BOD0 (e-kt) [where “0” indicates the initial value]
A common application of this equation is evaluation of the
impacts of sewage treatment waste water release, where the
oxygen consumption-organic carbon oxidation rate constant (k)
is typically ~0.2 mg/day.
Now we can write a 1-D advection diffusion equation from the
evolution of DO with distance down the river (see next slide)
GG425, wk5 L10, S2015
dO2/dt = diffusive O2 transport - advective O2 transport - reactions
where the reactions include a reaeration term + a BOD term.
Let’s assume the advection rate in the river is high, so that we
can ignore the diffusive term for simplicity’s sake.
Let’s also assume steady-state conditions of flow, TOC
discharge and aeration, or else the calculation get’s nasty.
0 = -v(dC/dx) + A(O2 SAT - O2) - kBOD
A is the reaeration rate constant k is the BOD decay rate constant.
If we transform this into the time domain using x = v*t and substitute
in the exponential expression for the BOD decay with time, then the
solution for this differential equation is:
O2 = O2 SAT - [k(BOD0)/(A-k)][e-kt - e-At]
GG425, wk5 L10, S2015
12Let’s estimate O2 levels for re-aeration at 10%, 1% and 0% of the
BOD decomposition rate, such that A ~ 0.02, 0.002, and 0
For 5 days and A ~ 0.02
O2 = 8.6 - [0.2(6*1.4)/(0.02-0.2)][e-0.2*5 - e-0.02*5] = 3.6 (not quite
hypoxic = 41% saturation)
In 10 days...
O2 = 2.2 (hypoxic = 26% saturation)
A O2 A O2 A O2
5 days 0.02 3.6 0.002 3.3 0 3.29
10 days 0.02 2.2 0.002 1.4 0 1.33
so given k = 0.2, hypoxia results after 10 days but not after 5.
A higher aeration term could perhaps prevent hypoxia entirely.
A more labile OM discharge would increase chances of hypoxia
A less labile OM discharge would decrease chances of hypoxia
GG425, wk5 L10, S2015
Estuarine Eutrophication/Hypoxia
The Thames River estuary in London experiences along-stream stratification because
competition between river and tidal flows keep waters in this region for long periods of
time. The flow regime gives rise to a vertical salinity profile (we will discuss the more
common salt wedge salinity profile of the Tees next week).
For many years this unfortunate
river stagnation location caused a
serious water quality decline as
pollution from London's population
and industries expanded. GG425, wk5 L10, S2015
13High BOD in effluents to the Thames Estuary causes a DOx
"sag" that has existed since the late 19th century, and worsened
progressively from 1890 to 1960, allowing waters to go culturally
eutrophic.
After about 1950 more stringent controls on effluent discharge
has reversed the downward trend in quality, and many fish,
long absent from the Thames, are now returning.
GG425, wk5 L10, S2015
Hypoxia in coastal marine areas
Globally,
low-oxygen
zones are
becoming
increasingly
common in
estuaries
and the
coastal
ocean from
increased
nutrient load
(mainly N
The evolution of hypoxia in the in the Mississippi
and P) from river delta and Gulf of Mexico in the last 20 years
human
activity.
GG425, wk5 L10, S2015
14Chesapeake Bay Hypoxia
Note the very diminished
quantity of fish caught in
hypoxic zones (green
circles).
http://www.vims.edu/newsmedia/press_release/hypoxia.html GG425, wk5 L10, S2015
Gulf of Mexico Hypoxia Note the increase in hypoxic areas
with time, and their occurrence in
the down-current direction from the
Mississippi river
GG425, wk5 L10, S2015
15You can also read