Nutrizione ed età evolutiva - Prof. Claudio Maffeis UOC Pediatria ad Indirizzo Diabetologico - Veneto Nutrizione
←
→
Page content transcription
If your browser does not render page correctly, please read the page content below

Nutrizione ed età evolutiva

                Prof. Claudio Maffeis

       UOC Pediatria ad Indirizzo Diabetologico
             e Malattie del Metabolismo
       Centro Regionale Diabetologia Pediatrica
Università e Azienda Ospedaliera Universitaria Integrata
                        Verona

             E mail: claudio.maffeis@univr.it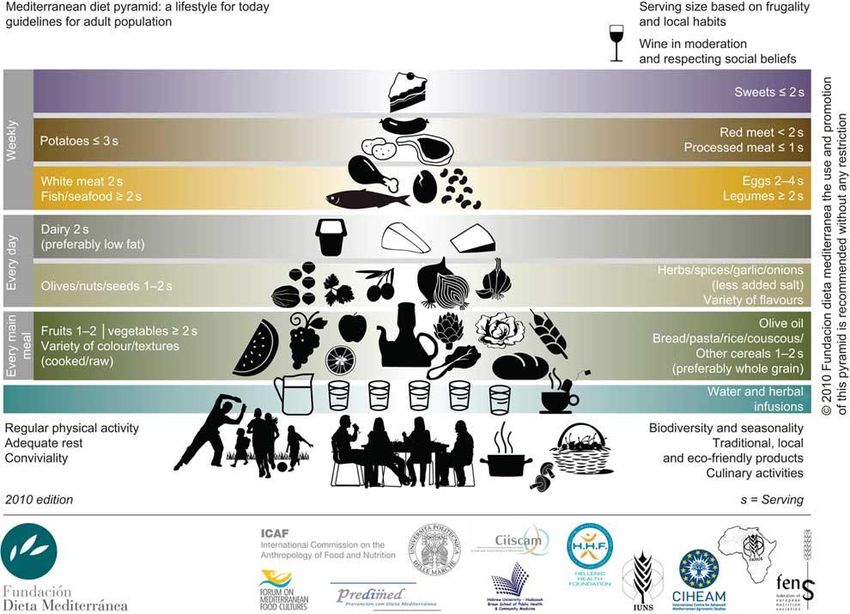
crescita
nutrizione   sviluppo
             salute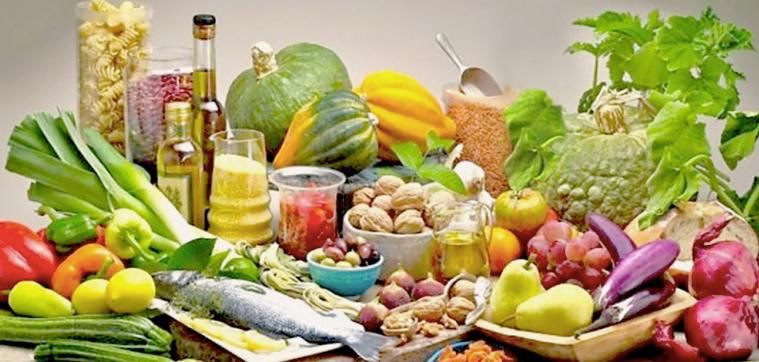
NUMERO DI DECESSI PER LE 10 PRINCIPALI
CAUSE DI MORTE IN ITALIA. Anni 2003 e 2014
Indagine Okkio alla Salute
Prevalenza obesità bambini 8-9 anni
Han JC, et al. Lancet . 2010; 375(9727): 1737–1748
Adolescent BMI Trajectory and Risk of
  Diabetes versus Coronary Disease

                        Tirosh A, et al. NEJM 2011;364:1315-25
Odds ratio to have the metabolic syndrome in subjects with a W/Hr
 >0.5 within normal-weight, overweight, and obese BMI categories
 Childhood Obesity Group of the Italian Society of Pediatric Endocrinology & Diabetology

                                        H
 W
                                                                            Risk to develop
                                                      Metabolic syndrome
                                                                           metabolic syndrome

            Independent variables                      No          Yes         OR (95% CI)

  Normal weight with W/Hr 0.5                         13           1       4.01 (0.49-32.97)

  Over weight with W/Hr 0.5                           72          16       8.16 (3.87-17.23) **

  Obese with W/Hr >0.5                                 208         67      12.11 (7.08-20.71) **

  W/Hr = waist/height ratio * P < .05. ** P < .001.                          Maffeis C, et al. J Pediatr 2008
Body-Mass Index in 2.3 Million Adolescents and Cardiovascular Death in Adulthood

                                                                Twig G, et al. NEJM 2016
global prevalence and trends of overweight
                   and obesity among preschool children.

de Onis M et al. Am J Clin Nutr 2010;92:1257-1264
Prevalence of overweight and obesity
in 2-6-year-old Italian children
Overweight
25,0%
20,0%
15,0% males
females
10,0% totale
5,0%
0,0%
National reference I.O.T.F. C.D.C.
Obesity
18,0%
16,0%
14,0%
12,0%
males
10,0%
females
8,0%
totale
6,0%
4,0%
2,0%
0,0%
National reference I.O.T.F. C.D.C
Maffeis C et al. Obes Res, 2006Infant obesity: are we ready to make this diagnosis?
Risk of obesity at age 6 months, given obese status at age 24 months
Obese at 24 months Normal weight
at 24 months
100
subjects
(%)
Normal weight
50 at 6 months
Obese at 6 months
0
McCormick DP et al. J Pediatr 2010; 157:15-9Fattori di rischio di obesità
Peso alla nascita
Peso a termine (kg)
2.5 4.5Odds ratio for childhood obesity by infant weight gain
between 0 and 1 year adjusted for sex, age, a weight
Lakshman R, et al. Circulation 2012;126:1770-9.Velocità di crescita primo anno
12
Peso (kg)
8
4
0
45 55 65 75
Lunghezza (cm)fetal & perinatal programming
other Maternal
optimal good undernutrition, poor
healthy maternal
maternal placental obesity, placental
mother abnormalities
nutrition function diabetes, … function
alcohol, smoking
adequate fetal inadequate fetal
nutrition nutrition
PREGNANCY Programming:
optimal Appetite high low
fetal Growth birth birth
LACTATION growth Hormonal milieu weight weight
Energy expend.
low plane of post-natal
post-natal nutrition overnutrition
thin adult obese adult
Cripps et al. Clin Sci 2005, modifiedestimates of FFM, FM, and FM percent in European-American
boys (closed symbols) and girls (open symbols)
from infancy through early adulthood
Veldhuis JD, et al. Endocr Rev 2005energy and nutrient requirements
energy nutrients
350 carbohydrate
3000
kcal/day g/day
250
2000
150 protein
1000 50
lipid
0
0 6 12 18 0 6 12 18
Age (years) Age (years)adipocyte differentiation
multipotent determined immature
mature
mesenchymal unipotential multilocular
adipocyte
stem cell preadipocyte adipocyte
skeletal
muscle
(-)
Insulin
IGF-I
PPARgamma
Glucocorticoid
C/EBPalpha
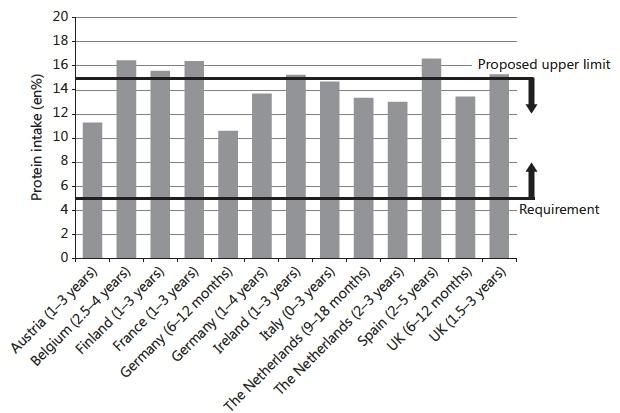
NutrientsNutritional Challenges and Opportunities during the Weaning Period and in Young Childhood
Protein intake
Alles MS, et al. Ann Nutr Metab 2014;64:284–293LARN 2014 lipidi
Età Obiettivo Livello adeguato di Intervallo di
(anni) nutrizionale per assunzione riferimento per
la prevenzione l’assunzione di
nutrienti
0,5 – 1 Lipidi totali 40% En.
SFA < 10% En.
PUFA 5-10% En.
PUFA n-6 4-8% En.
PUFA n-3 EPA-DHA 250 mg + 0,5-2% En.
DHA 100 mg
Ac. grassi trans Il meno possib.
1 – 17 Lipidi totali 1-3 aa. 35-40% En.
>4aa. 20-35% En.
SFA < 10% En.
PUFA 5-10% En.
PUFA n-6 4-8% En.
PUFA n-3 EPA-DHA 250 mg 0,5-2% En.
+1-2 aa. + DHA 100 mg
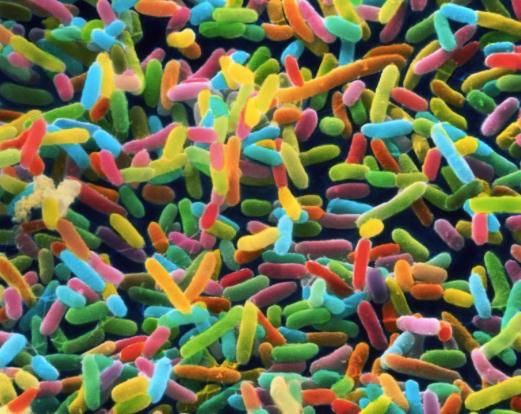
Ac. grassi trans Il meno possib.Related mechanisms involved in the iteractions among
dietary intake, the gastrointestinal microbiota, and obesity
Graham C, et al. Nutr Rev 2015;73:376-85Carboidrati
Grado di Sottogruppo Componenti Digeribilità
polimeriz-
zazione
Monosaccaridi Glucosio, galattosio, fruttosio +
Zuccheri Disaccaridi Saccarosio, maltosio, lattosio
+
Polialcoli Sorbitolo, mannitolo, xilitolo,
lattitolo, eritritolo, ecc. +/-
Malto-oligosaccaridi Maltodestrine +
Oligosaccaridi
Altri oligosaccaridi FOS, GOS, oligosaccaridi da
legumi, polidestrosio
Glicogeno Glicogeno +
Amido Amilosio, amilopectina
Polisaccaridi +
Amido resistente RS1, RS2, RS3, RS4
Polisaccaridi non Cellulosa, emicellulose, pectine,
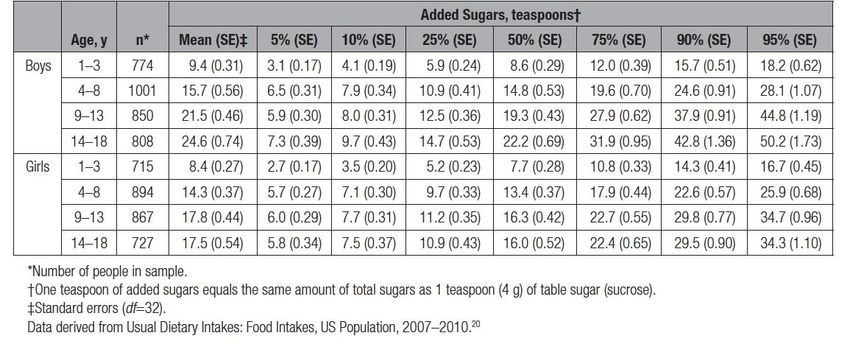
amidacei (fibra alim.) Gomme, inulinaVos MB, et al. Circulation 2016 (in press)
RACCOMANDAZIONI

1. < 8 once di bevanda zuccherata/settimana
2. < 25 g (100 kcal; 6 zucchiaini da the di zucchero/die)
3. No zucchero aggiunto prima dei 2 anni di età

                                    Vos MB, et al. Circulation 2016 (in press)
LARN 2014 carboidrati e fibra
Intervallo di
Obiettivo nutrizionale per la prevenzione riferimento per
l’assunzione di
macronutrienti
Carboidrati totali Prediligere alimenti a basso GI 45-60% energia totale
Limitare gli alimenti in cui la riduzione del
GI è ottenuta aumentando il contenuto di
fruttosio o lipidi
Zuccheri < 15% dell’energia totale nd
Limitare uso del fruttosio come
dolcificante (anche bevande contenenti
sciroppo di mais)
Fibra alimentare Preferire cibi naturalmente ricchi in fibra 8,4 g/1000 kcal
(cereali integrali, legumi, frutta, verdura) (assunzione adeguata)Nutriente Assunzione Assunzione Livello massimo
raccomandata adeguata tollerabile
Vitamina D
Lattante - 10 ug (400 UI) 40 ug (1600 UI)
1 – 3 anni 15 ug (600 UI) - 65 ug (2600 UI)
Ca
Lattante - 260 mg nd
1 – 3 anni 600 mg - nd
Na
Lattanti - 400 mg nd
1 – 3 anni - 700 mg nd
Fe
Lattanti 11 mg - nd
1 – 3 anni 8 mg - nd
Zn
Lattanti 3 mg - nd
1 – 3 anni 5 mg - 7 mgNutritional Challenges and Opportunities during the Weaning Period and in Young Childhood
Vitamin D intake
Alles MS, et al. Ann Nutr Metab 2014;64:284–293Nutritional Challenges and Opportunities during the Weaning Period and in Young Childhood
iron intake
Alles MS, et al. Ann Nutr Metab 2014;64:284–293Nutritional Challenges and Opportunities during the Weaning Period and in Young Childhood
Sodium intake
Alles MS, et al. Ann Nutr Metab 2014;64:284–293Nutritional Challenges and Opportunities during the Weaning Period and in Young Childhood
Vegetable intake
Alles MS, et al. Ann Nutr Metab 2014;64:284–293Obesity
“…. Obesity is a chronic, relapsing, neurochemical disease
that occurs in genetically susceptible people.
Obesity may be conceptualized as an epidemiological
disease with food as an agent that acts on the host
to produce disease.
As with most treatments for weight loss, a plateau is
reached when the body’s neurochemical counter regulatory
systems counterbalance the weight loss...”
Current treatment do not cure obesity and thus are only
palliative. In particular, diets do not cure obesity.
Bray GA JAMA 2003The Socioecological Framework
Caprio S, et al Obesity 2008Two-year Follow-up in 21,784 Overweight Children
and Adolescents With Lifestyle Intervention
129 treatment centers 5 centers with the highest success rate
SDS BMI SDS BMI SDS BMI SDS BMI
lost of reduction reduction lost of reduction reduction
follow-up 0.5 follow-up 0.5
100 100
(%) (%)
80 80
60 60
40 40
20 20
0 0
6 12 24 6 12 24 6 12 24 6 12 24 6 12 24 6 12 24
time (months) time (months)
Reinehr T, et al Obesity 2009Childhood and Adolescence Obesity:
Principles of Treatment
Main Change of Diet
Target behavior Exercise
drugs (?) surgery (?)
Motivation
Adherence
Open questions:
Efficacy
MaintenanceThe Long-Term Effect of Energy Restricted Diets for Treating Obesity
Thickness of the lines approximates the weight
of the study based on number of subjects.
Langeveld M, DeVries JH. Obesity 2015;8:1529-38DIETA MEDITERRANEA PORZIONI VARIETA’ NUMERO E COMPOSIZIONE PASTI
Bach-Faig A, Serra-Majem L, et al Public Health Nutr 2011
Weight Loss with a Low-Carbohydrate, Mediterranean, or Low-Fat Diet

                                                   Shai I, et al, NEJM 2008
Fat mass and fat-free mass changes induced by 4 diets with different
macronutrient composition. The POUNDS LOST trial
protein fat carbohydrate
high medium high low highest lowest
O
Fat mass
Fat mass -2
& fat-free Fat-free mass
-4
mass
changes -6
(kg)
-8
P = ns P = ns P = ns
-10
De Souza RJ, et al. Am J Clin Nutr 2012;95:614Optimal Macronutrient Content of the Diet for Adolescents
With Prediabetes: RESIST a Randomised Control Trial
Glycemic status and anthropometry by dietary group.
HP
HP
HC HC
HP diet: CHO 40%, Protein 30%, Fat 30%
HC diet: CHO 55%, Protein 15%, Fat 30%
Garnett SP, et al. JCEM 2013;98:2116-25JAMA. 2005;293:43- 53.
The 24-h Energy Intake of Obese Adolescents Is Spontaneously
Reduced after Intensive Exercise: A RCT in Calorimetric Chambers

Energy consumption (KJ) distribution between meals for each experimental session
    (SED: sedentary; LIE: Low-Intensity Exercise; HIE: High-Intensity exercise).

                                                               Thivel D, et al. PlosOne 2012
Diet macronutrient composition reported before treatment
predicts BMI change in obese children: the role of lipids
Maffeis C, et al. Eur J Clin Nutr 2012;66:1066-8.Conclusioni Le abitudini nutrizionali acquisite nell’infanzia sono fondamentali per una composizione corporea ottimale e per la prevenzione delle malattie croniche non trasmissibili L’obesità è la patologia nutrizionale più comune nel bambino e nell’adolescente La prevenzione ed il trattamento nutrizionale dell’obesità hanno come obiettivo l’aderenza alla dieta mediterranea insieme ad una pratica dell’attività motoria aderente alle raccomandazioni
UNIVERITA’ e AZIENDA OSPEDALIERA UNIVERSITARIA INTEGRATA VERONA

UOC PEDIATRIA INDIRIZZO DIABETOLOGICO E MALATTIE DEL METABOLISMO
You can also read