AFT PHARMACEUTICALS Investor Presentation: H1 FY2019 November 2018

Page created by Joshua Hudson
 
CONTINUE READING
AFT PHARMACEUTICALS Investor Presentation: H1 FY2019 November 2018
AFT PHARMACEUTICALS
Investor Presentation: H1 FY2019
November 2018
AFT PHARMACEUTICALS Investor Presentation: H1 FY2019 November 2018
IMPORTANT NOTICE

This presentation has been prepared by AFT Pharmaceuticals Limited (“AFT”), to provide a general overview of AFT. It is not
prepared for any other purpose and must not be provided to any person other than the intended recipient.

All amounts are disclosed in New Zealand dollars (NZ$) unless otherwise indicated. All references to FY20XX appearing in this
presentation are to the financial year ending 31 March, unless otherwise indicated.

This presentation is not a recommendation or other form of financial advice. While reasonable care has been taken in compiling this
presentation, none of AFT nor its subsidiaries, directors, employees, agents or advisers (to the maximum extent permitted by law)
gives any warranty or representation (express or implied) of the accuracy, completeness or reliability of the information contained in
it nor takes any responsibility for it. The information in this presentation has not been and will not be independently verified or
audited.

This presentation may contain certain forward-looking statements and comments about future events, including with respect to the
financial condition, results, operations and business of AFT. These statements are based on management’s current expectations
and the actual events or results may differ materially and adversely from these expectations. Recipients are cautioned not to place
undue reliance on forward-looking statements.

Past performance information given in this presentation is provided for illustrative purposes only, should not be relied upon, and is
not an indication of future performance.

Investor Presentation                                                                                                                    1
November 2018
AFT PHARMACEUTICALS Investor Presentation: H1 FY2019 November 2018
H1 FY2019 HIGHLIGHTS

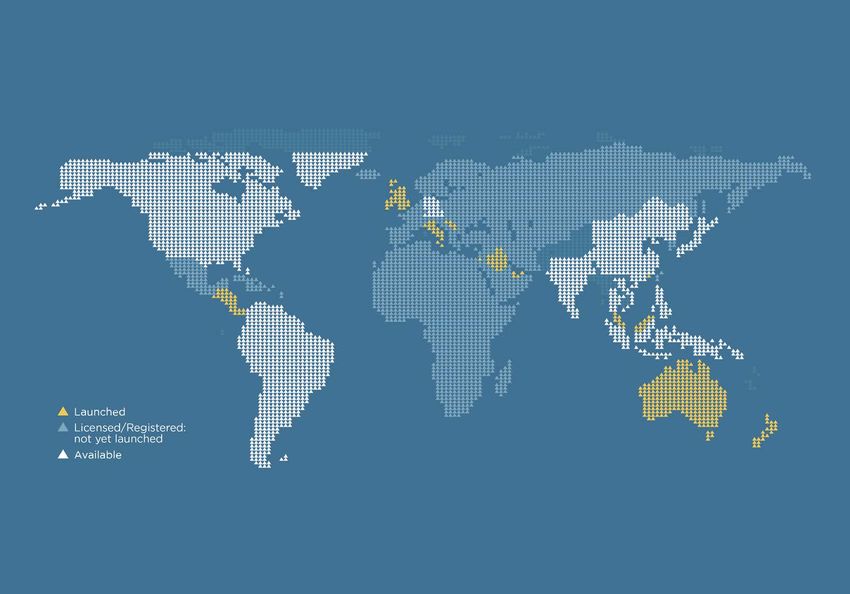
 128                    countries that Maxigesic is licensed in – up from 125 at the end of FY2018

 15                     countries that Maxigesic is launched and sold in

 5                      number of clinical studies AFT have running in FY2019

 $40.2m                 total income for H1 FY2019*

 $7.4m                  available cash as at 30 September 2018 – up from $6.8m at the
                        end of FY2018.

Investor Presentation                                                                                      2
                          * Total income comprises Operating Revenue of $38.0m and Other Income of $2.2m
November 2018
Italy – successful launch and
     MAXIGESIC GLOBAL UPDATE                                                       Nordics – launch pending 4Q
                                                                                               FY19
                                                                                                                                       sales growing still
                                                        BE/LX & FR– launches pending
                                                                     4Q18                        Germany – licensing                 Eastern Europe and Balkans –
                                                          NL – licensing discussions            negotiations underway                   launches pending FY19
                                          UK – launched            underway
Licensing discussions starting
     for USA & Canada                                                                                                                     Licensed in Russia
                                      IE – launched
                                                                                                                                            Korea - Licensing negotiations
                                                                                                                                                      underway

                                                                                                                                                 Licenced in Taiwan

                                                                                                                                                     Iraq -Kurdistan launch
                                                                                                                                                            underway

                                                                                                                                                    UAE – sales growth still
                                 Spain& Portugal – launch                                                                                                  strong
                                      pending 4Q 18
                                                                                                                                                    HK launch 4Q FY19
      Mexico – launch
      pending 4Q 18
                                                                                                                                              Singapore/Brunei – launched
                                                                                                                                                    including OTC

                                                                                                                                                    Malaysia – launched

   CACM – launch underway

                                                                                         Indonesia and Philippines –
                                                                                      licensing discussions underway

                                                                                    Australia – sales growing strongly
                                                                                       post codeine rescheduling.
                                                                                        No #1 Para-Ibu Combo
                                                                                                                         New Zealand – increasing
                                                  Brazil - Licensing negotiations                                            sales and codeine
                                                              underway                                                    rescheduling confirmed.
                                                                                                                          Maxigesic PE launched
MAXIGESIC HIGHLIGHTS

Additional out-licensing and distribution agreements for Maxigesic oral dose forms have been
secured to increase the number of countries to 128.

Numerous Maxigesic registrations underway which are required before many launches can occur
              EU registrations confirmed in 25 countries. Remaining 3 underway.
              Most of the remaining countries use EU registration as a reference standard
              Additional dose forms (IV and Oral Liquid) regulatory filings initiated.

Maxigesic IV successful FDA pre NDA filing meeting.

Maxigesic Oral FDA registration expected in calendar 2019.

SUMMARY: Drive sales by
             [1] Increasing sales in Australia post codeine switch
             [2] Increasing sales in existing territories
             [3] Launches in new territories
             [4] Launch additional dose forms starting in FY20

Investor Presentation                                                                          4
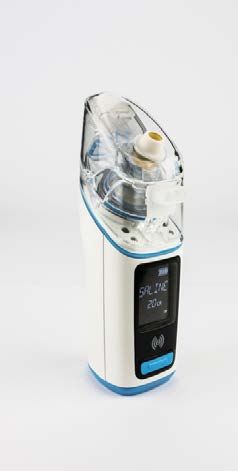
November 2018
NASOSURF NEBULISER: Future growth strategy

                          A handheld ultrasonic nasal mesh nebuliser for the
    Product
                          intranasal delivery of medication and treatment of
   description                                                                      The NasoSURF Nebuliser has desirable features
                          chronic sinusitis
                                                                                   over currently marketed nebulisers, which are not
                                                                                              approved for delivery of specific drugs
                        • To expand our existing hospital product ranges locally    intranasally and do not possess a number of the
                        • Significant global potential                                       advantages of the NasoSURF Nebuliser
   Rationale for
                        • First drug delivery indication a significant potential
  investment in
                          market – US$1.2B in USA alone [Based upon market
     product
                          research studies in USA and UK]

                        • Registered as Class I Device with FDA as planned
  Current status        • Completed Human Factor Studies
                        • Targeting Class IIA Device filing Apr/May 19
                                                                                                           Sales will be generated from

                        • FDA Pre-IND meeting completed                                                    1)   device sales,
                        • Development pathway clarified with FDA                                           2) a per use charge
                        • Human factor studies identified some redesign                                       administered through
                          requirements                                                                        RFID (radio frequency
                                                                                                              identifier) cards, and
                        • Distribution studies underway
  Our medium                                                                                               3) consumables
   term plans           • IND opening with redesigned device now FY2020
                        • First Drug PK studies targeted to commence in FY2020
                          after opening IND
                        • First Drug Clinical Studies targeted to start FY2020
                          after opening IND
                        • Licensing negotiations during FY2020

Investor Presentation                                                                                                                     6
November 2018
REVENUE BY REGION AND CHANNEL
Operating revenue by region, H1 FY2019 versus H1 FY2018

NZ$000's Half Year to 30 September                          H1 FY2019          % of total                    H1 FY2018    % of total

Australia                                                         21,601             56.8%                      20,206        55.3%
  YoY growth                                                          7%

New Zealand                                                       12,565             33.0%                      14,113        38.6%
  YoY growth                                                        -11%

Rest of World                                                      2,760              7.3%                       1,624            4.4%
  YoY growth                                                         70%

Southeast Asia                                                     1,118              2.9%                         618            1.7%
  YoY growth                                                         81%

Total Operating Revenue                                           38,045             100%                       36,561            100%
  YoY growth                                                          4%

Operating revenue by channel by region, H1 FY2019
         Australia                New Zealand                 Rest of World                  Southeast Asia                       Group

              11.1%                                                  -6.1%                            0.1%
                                                                                                                                         17.0%
                                            32.4%
                                                                                        45.5%
                      28.1%   50.3%                                                                                       59.2%
                                                                                                                  54.4%
 60.7%                                                                                                                                       23.7%

                                         17.3%
                                                                  93.9%

 Investor Presentation                    Ove r-the -c o unte r       Ho s p ita l      P re s c rip tio n
                                                                                                                                                     7
 November 2018
REVENUE GROWTH

     Operating revenue by region, H1 FY2019 – H1 FY2018

     H1 FY2018                                      FY2018 Annual                             H1 FY2019
     22.5                                                                                     22.5

                                                    45.0
     15.0                                                                                     15.0
$m

                                                    30.0

                                               $m

                                                                                         $m
      7.5                                                                                      7.5
                                                    15.0
                                                                                                               7% -11% 70% 81%

       -                                              -                                         -

                      Au s tra lia             Ne w Ze a la nd       Re s t o f Wo rld              S o uth e a s t As ia

                                        4.4%               1.6%                 3.1%                  2.9%                       7.3%
           1.7%

                                                                           33.8%
                                     38.6%
              55.3%                                                                                                         33.0%
                                                             61.4%                                       56.8%

 Investor Presentation                                                                                                                  8
 November 2018
SUMMARY P&L

NZ$'000's Half Year to 30 September             H1 FY2019       % of   H1 FY2018        % of
                                                            revenue                 revenue
Revenue                                          38,045                   36,561
Cost of Sales                                   (20,292)      53.3%      (22,256)     60.9%
Gross Profit                                     17,753       46.7%       14,305      39.1%

Other Income                                      2,430        6.4%        1,014       2.8%
Selling and distribution expenses               (14,234)      37.4%      (12,771)     34.9%
General and administrative expenses              (3,489)       9.2%       (3,618)      9.9%
Research and development expenses                (2,225)       5.8%       (4,982)     13.6%
Equity accounted loss of joint venture entity      (344)       0.9%         (616)      1.7%
Operating Loss                                     (109)                  (6,668)

Finance Income                                       16                       96
Finance Costs                                    (2,481)                  (1,590)
Other gains / (Losses)                           (1,690)                   1,589
Loss before tax                                  (4,264)                  (6,573)

Tax benefit/(expense)                                76                     (300)
Loss after tax                                   (4,188)                  (6,873)

  Investor Presentation                                                                        9
  November 2018
SUMMARY BALANCE SHEET                  Unaudited       Audited      Unaudited
NZ$'000's                              30 Sept '19   31 March '18   30 Sept '18
ASSETS
Current Assets
Inventories                               27,815        24,412         23,697
Trade and other receivables               12,993        16,954         14,954
Cash and cash equivalents                  7,400         6,770          7,197
Derivative assets                            481           176            127
Total current assets                      48,689        48,312         45,975
Non-current Assets
Property, plant and equipment                335           330            374
Intangible assets                          7,089         5,118          2,744
Deferred income tax assets                   800           708            342
Investment in joint venture entity         2,493         2,135          1,808
Total assets                              59,406        56,603         51,243
LIABILITIES
Current liabilities
Trade and other payables                  11,628        17,391         13,245
Provisions                                 2,880         1,098          1,424
Current income tax liability                   -           118              -
Total current liabilities                 14,508        18,607         14,669
Non-current liabilities
Interest bearing liabilities              41,938        30,654         23,244
Total liabilities                         56,446        49,261         37,913
Equity
Share Capital                             63,743        63,743         63,743
Retained earnings                        (62,289)      (57,644)       (51,349)
Share options reserve                        521           430            399
Redeemable Preference Share Reserve          879           483            291
Foreign currency translation reserve         106           330            246
Total equity                               2,960         7,342         13,330

Total liabilities and equity              59,406        56,603         51,243
Investor Presentation                                                             10
November 2018
SUMMARY CASHFLOW STATEMENT

NZ$'000's Half Year to 30 September                       H1 FY2018   H1 FY2017

Net cash used in operating activities                      (4,339)       (7,678)

Net cash used in investing activities                      (2,821)       (2,144)

Net cash generated from financing activities                7,417          745

Net increase in cash                                         257        (9,077)

Impact of foreign exchange on cash and cash equivalents      373           294

Opening cash and cash equivalents                           6,770       15,905

Closing cash and cash equivalents                           7,400        7,122

 Investor Presentation                                                             11
 November 2018
SUMMARY OF NEAR TERM PLANS
                Drive Increased International Sales
                Phased launches of Maxigesic in additional countries including larger EU
                territories and North America

                Drive Increased Upfront Payments
                Further licensing agreements for Maxigesic and Maxigesic IV in larger markets
                including North America

                Drive Local Australian Key Market Sales
                Build on Maxigesic market share and sales post codeine changes
                Register and launch line extensions starting in FY2020
                Build further revenues of OTC product sales in Australia

                Drive Revenues to Achieve Break Even
                Break even targeted in the FY2019 time frame from increased higher margin
                product sales in home markets; increased licensing income from existing and
                new agreements; increased Maxigesic sales from existing and new markets
                Control of costs

                Drive Value of NasoSURF and Pascomer Projects
                Completing the key development targets for NasoSURF
                Initiating human clinical studies program for Pascomer

Investor Presentation                                                                           12
November 2018
You can also read