ONEBILLION MATH SOFTWARE - DAVID LIVINGSTONE COMMUNITY SCHOOL AUGUST 2018 RESEARCHER: DR. LINDA DERIVIERE
←
→
Page content transcription
If your browser does not render page correctly, please read the page content below

Onebillion Math Software
David Livingstone Community School

             August 2018
     Researcher: Dr. Linda DeRiviere
            University of Winnipeg

                                     Nurturing Capacity
                                     Founding Sponsor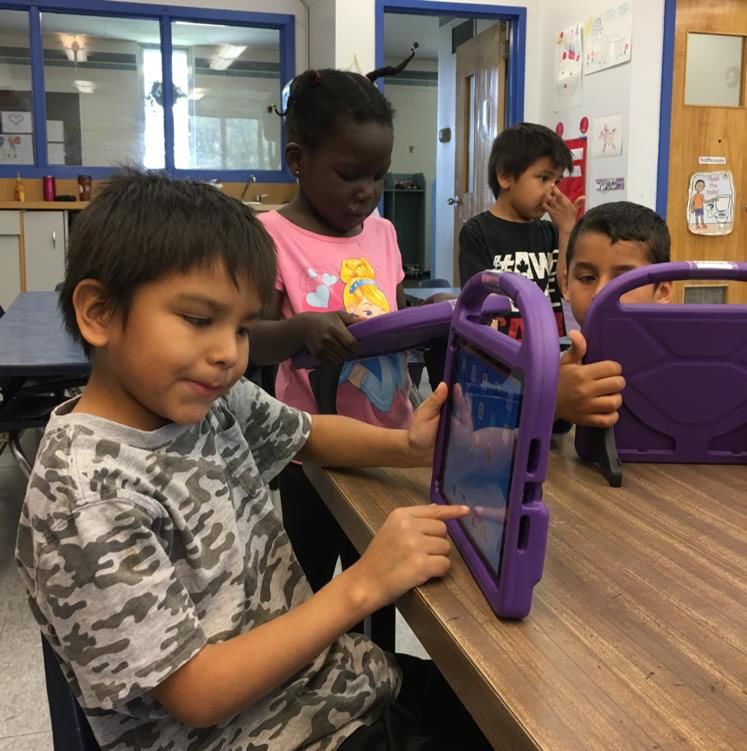
Preface

Nurturing Capacity: Building Community Success
Indspire supports communities to improve educational outcomes through the
documentation and evaluation of their innovative practices. This community-led process
is supported by an Indspire-funded Indigenous scholar, who works with programs on the
ground to provide training on data collection and evaluation methodology.
For more info, please contact nurturingcapacity@indspire.ca | 1.855.463.7747 x230

Project Abstract

This evaluation assesses how using Onebillion’s math software affected the math
abilities of an experimental group of 19 kindergarten students at David Livingstone
Community School in the Lord Selkirk Park area of Winnipeg, Canada. Over a period of
nine weeks between April 3rd and May 31st, 2018, the students’ mathematics abilities
were tested before and after the Onebillion intervention; these results were then
quantified and compared those of a control group (n=18) who had been receiving
standard face-to-face instruction. The material covered by the experimental group and
the control group was consistent with the provincial curriculum for math instruction at
that grade level. The selected study design allowed us to evaluate whether the tablet-
based math app helped the experimental group outperform the age-matched control
group in terms of learning achievements. The post-test results revealed improved
performance by both groups, with the experimental group outperforming the control
group on all indicators by a statistically significant margin. These results are discussed
in relation to the Onebillion math app’s potential to stimulate student interest in math,
optimize their learning experience, and help develop their math competence. Ultimately,
the goal of this study was to explore a potentially effective and engaging tool for
improving academic standards in the early years and eventually closing the high school
graduation gap, which persists in large part due to poor performance in mathematics.

                                                                                         2
Project Holder

The Chipman Family Foundation
415 Laidlaw Blvd.
Winnipeg, Manitoba, CA R3P 0K8

  Susan Millican                       Timothy Millican
  susanmillican@shaw.ca                timothymillican@gmail.com
  204.227.8691                         647.302.0612

Project Lead

Timothy Cox
Principal
David Livingstone Community School
270 Flora Avenue
Winnipeg, Manitoba R2W 2P2
Email: tcox@wsd1.org Telephone: 204-586-8346

Patricia Mainville
Vice-Principal
David Livingstone Community School
270 Flora Avenue
Winnipeg, Manitoba R2W 2P2
Email: pmainville@wsd1.org Telephone: 204-586-8346

Acknowledgements

The author would like to express gratitude to the following individuals at David
Livingstone Community School for their generous support during the evaluation study:
Timothy Cox, Principal; Patricia Mainville, Vice-Principal; and teachers: Sandra
Pederson, Karen Pellaers, Heather MacKenzie, and Amanda Almdal. Special thanks
are due to Timothy Millican for his assistance during the pre- and post-testing phases,
and Susan Millican for securing funding for the acquisition of iPads through the
Chipman Family Foundation at the Winnipeg Foundation. I am most grateful for Kris
Pikl’s excellent research assistance, copy editing, and invaluable feedback.

                                                                                          3
Table of Contents
Preface ........................................................................................................................... 2
  Nurturing Capacity: Building Community Success ................................................ 2
Project Abstract ............................................................................................................ 2
Project Holder ................................................................................................................ 3
Project Lead ................................................................................................................... 3
Acknowledgements....................................................................................................... 3
Executive Summary ...................................................................................................... 6
  Key Findings .............................................................................................................. 6
Context ........................................................................................................................... 8
 Table 1: Context in Which the Project was Realized ............................................ 10
History of the Project .................................................................................................. 11
  Socio-Economic Geography of the Area ............................................................... 12
Brief Review of the Background Literature on Tablet-Based Math Interventions . 14
Activities Accomplished ............................................................................................. 15
Project Model ............................................................................................................... 17
  Logic Model Used for the Project ........................................................................... 18
Performance Indicators and Measures ..................................................................... 19
Evaluation .................................................................................................................... 20
  Evaluation Framework: Planned Data Collection ................................................. 20
  Table 2: Sources of Actual Data Collection ........................................................... 21
  Table 3: Experimental Design ................................................................................. 22
Evaluation Outcomes: Summary of Key Findings ................................................... 22
  Table 4: Comparisons of Experimental and Control Group Results ................... 23
  Highlights of Findings ............................................................................................. 24
Study Limitations ........................................................................................................ 27
Outcomes: Most Significant Accomplishments and Lessons Learned ................. 28
Next Steps for the Project .......................................................................................... 29
References ................................................................................................................... 30
APPENDIX A: PROJECT MODEL ............................................................................... 33
MODULES COVERED IN THE ONEBILLION MATH CURRICULUM APP ................. 33
 Table A-1: Number of Students Who Reached Curricular Targets in the Learning
 Pathway Divisional Assessments .......................................................................... 34
 Table A-2: Experimental and Control Groups: Areas of Math Skills
 Improvements from Pre-test to Post-Test, as Determined by Cohen’s d Size
 Effects....................................................................................................................... 35

                                                                                                                                   4
Table A-3: Cross-Tabulations of Pre-Test and Post-Test Average Scores by
Gender, Age, and Classroom.................................................................................. 36

                                                                                                             5
Executive Summary

Over the past few decades, there has been growing interest in tablet-based math apps
as a best practice in math education. This evaluation measures the effects of
Onebillion’s tablet-based math software on an experimental group of 19 kindergarten
students at David Livingstone Community School in the Lord Selkirk Park area of
Winnipeg, Canada. Over a period of nine weeks between April 3rd and May 31st, 2018,
the experimental group’s mathematics abilities were tested before and after the
Onebillion math app intervention; these results were then quantified and compared to
those of an age-matched control group (n=18) who had been taught the same material
via the standard, face-to-face instructional approach. This study design was selected
because it allowed us to evaluate whether practicing on a tablet-based math app could
help young students realize greater learning gains than traditional classroom instruction.
Our findings showed that both groups demonstrated improved performance on their
post-tests, with the experimental group outperforming the control group on all indicators
by a statistically significant margin. These results are discussed in relation to the
Onebillion math app’s potential to stimulate student interest in math, optimize their
learning experience, and help them develop math competence. Ultimately, the goal of
this intervention was to help improve academic standards in the early years and to
eventually close the high school graduation gap, which continues to persist in large part
due to poor performance in mathematics.

Key Findings

This study produced a number of encouraging findings.
   -   As expected, the experimental group showed a greater overall % change than
       the control group in average score from the pre-test to the post-test at +30.4% to
       +10.3%, respectively. Notably, while the experimental group scored only slightly
       higher than the control group in the pre-test (2.7 points higher average points or
       11.6%), their scores were considerably higher in the post-test (8.2 points, or
       31.9% higher than the control group’s average score).
   -   The most significant outcome of this study was the huge improvement in learning
       and test performance made by those students in the experimental group who had
       struggled on the pre-test (a score of 50% or lower). Despite the relatively short
       seven-week span between the pre- and post-test, these students’ post-test
       scores increased by an average of 49.5% (range: 12.5-154.5%). In fact, these
       students performed better than the stronger experimental group students (pre-
       test scores exceeding 50%) who achieved a 15.4% average increase on the
       post-test (range: 2.4-33.3%). These results exceeded expectations by far, and
       they are consistent with other research that has reported similar substantial
       learning improvements in students who struggle in math.
   -   Improvements in the experimental group’s math skills were in the areas of
       pattern recognition (e.g. triangle, triangle, rectangle); early pre-proportional
       reasoning (e.g. same as, more than, fewer than); simple arithmetical learning

                                                                                          6
(e.g. one more than/one less than; two less than); basic arithmetic visualization
(e.g. I have 8 cats and take away 3); number recognition and counting to 20; and
telling time on a clock. Many students in the experimental group performed these
tasks at a Grade 1 level or higher, while the control group showed improvement
in areas mostly related to the kindergarten math curriculum (e.g. counting to ten;
size attributes, number recognition, etc.).
- Some gender differences were also observed. The girls in the experimental
group outperformed the boys in both tests (Pre-test: 5.3 points higher; Post-test:
2.7 points higher). However, the gap between the boys and girls narrowed after
the post-test, which suggests that the boys made significant learning gains from
practicing with the math app. Similarly, the girls in the control group also
outperformed their male counterparts in both tests (Pre-test: 5.3 points higher;
Post-test: 5.9 points higher), but, unlike the experimental group, the gap did not
close following the post-test.
- Post-test results were much more strongly related to the number of ‘stars’
awarded to students after completing one of the 10 modules than they were to
student attendance. While there was a small and insignificant correlation
between school attendance rates and post-test scores in the experimental group,
there was also a statistically significant positive correlation between post-test
scores and the number of stars awarded to the student. This finding suggests
that the individualized learning opportunities offered by tablet-based interventions
can help to accommodate diverse student needs and circumstances, such as
spotty attendance rates, while still helping to develop math proficiency.
Another significant outcome was that the Onebillion app challenged students in the
experimental group to perform above their grade level. Examples of areas where this
was observed include:
- Positional words, such as left, right, and middle;
- Grade 1 counting and basic arithmetic learning, e.g., 2 less than 5; arithmetic
visualization, e.g., I have 4 fish and I add 4 more. How many fish do I now have;
- Equal sharing, e.g., I have 6 candies. How do I share them equally between 2
children; and
- Skip counting, ordinal numbers, and telling time on an analogue clock.
In helping them exceed the curricular requirements for their grade level, the Onebillion
app helped to prepare these students to enter Grade 1 with confidence in their
mathematical abilities.
7Onebillion Math Software at David Livingstone Community School
Context
Over the past few decades, mobile technologies, including tablet-based math
applications (apps), have received increasing attention for their usefulness in improving
the educational outcomes of young children, particularly those in high-poverty regions
(Outhwaite et al., 2017; Pitchford et al., 2018; Pitchford, 2015). Younger students are
naturally drawn toward these technologies, and educational publishing companies have
responded accordingly. The literature identifies a number of key advantages to these
learning tools, including: individualized learning opportunities that can accommodate
diverse learning needs; access to a large range of practice problems that are delivered
in a playful format; built-in
student assessment data and
immediate feedback (both
positive and negative), which
tends to improve student
engagement; and relatively
minimal required adult
supervision, which is
especially important in large
classrooms (Evans et al.,
2014; Pitchford, 2015; Stacy et
al., 2017). Notably, barriers to
implementation have included
insufficient school funding to
cover the costs of acquiring
and maintaining the tablets,
unreliable internet availability
in some regions (e.g. Northern
Manitoba), low rates of school
attendance in some areas,
and inadequate support for
educator training and
preparation (Okolo & Diedrich, 2014; Stacy et al., 2017).
For its part, Onebillion is a London, UK-based charity and not-for-profit educational
publishing company that develops tablet-based numeracy software for primary school
children between the ages of 3 and 6. As its name suggests, the Onebillion
intervention’s main objective is to reach one billion marginalized children throughout the
world, and it launched this effort by successfully pilot-testing its math app via
randomized control trials in Malawi, a country in the developing world (Pitchford, 2015),
and in Nottingham, a below-average income area in the U.K. (Outhwaite et al., 2017).
Since these initial trials, the Onebillion math app has been localized into more than 50
languages, and it has been adopted by schools throughout Malawi, as well as in other
pilot projects in South Africa, Cambodia, Ethiopia, and Uganda. In addition to its
8advantages as an educational tool, downloading the app to a touch-screen device, such
as an iPad, is a relatively easy and user-friendly process (see
https://onebillion.org/apps), which has likely contributed to its appeal. Thus, this
educational software is totally transferable to many different social and economic
contexts, and it can be accessed and used by people with a wide range of technological
abilities.
While Onebillion also offers a math app for children ages 4-6, the app used in this study
was the one designed for 3-5 year olds. This app is described by its developers as
being child-centered in design and consisting of a number of different measures of early
years mathematical ability, such as: sorting and matching; counting (to 3, 5, 7, 10 etc.);
comparing items; recognizing different sizes, lengths, patterns, and shapes; and simple
addition and subtraction. In addition, the content is interactive, colorful, animated, and
non-language based, as the student is verbally guided through the exercises by
instructions provided by an audio narrator. The software aims to develop the user’s
memory and visual attention to detail, manual coordination, and ability to count
precisely, among many other competencies. Moreover, the Onebillion math app
satisfies the provincial curriculum requirements for kindergarten mathematics (Manitoba
Education and Advanced Learning, 2014), which makes it suitable for use in
conventional classrooms.
9Table 1 outlines the context in which the project was realized at David Livingstone
Community School in Winnipeg, Canada.
Table 1: Context in Which the Project was Realized
Description N= %
Indigenous language groups n/a - -
Province and region Winnipeg, Manitoba, - -
Canada
Number of students the organization Nursery to Grade 8 338
serves each year: Elementary: Nursery to 272
David Livingstone Community School Grade 6
(1)
Average number of people the
organization serves each year Students, siblings and
(measured by the approximate parents/guardians
1,500
population in Lord Selkirk Park in the
2011 Census)
Percentage of elementary students who
245 90.0%
are Indigenous (1)
Percentage of elementary students who
24 8.4%
are new Canadians (2)
Percentage of elementary students in
21 7.7%
care (1)
Development focus of the Onebillion Early years:
- -
math app software kindergarten
Number of elementary school Onebillion at David
participants in the program evaluation Livingstone School 37 13.6%
(kindergarten classes)
Years in operation The school opened in 1922 96
-
years
Learning Environment School readiness in numeracy.
Category of Indigenous educational Indigenous ways of knowing: experiential,
practice applies to this project hands-on learning; formal and informal
knowledge.
(1) Personal communication with Patricia Mainville, Vice-Principal, David Livingstone School.
(2) Retrieved from the Winnipeg School Division’s Student Demographic Report, 2016-17.
10History of the Project
The Onebillion math app was introduced to David Livingstone Community School
through Timothy Millican and Chipman Family Foundation Director, Susan Millican,
whose organization generously funded the acquisition of 20 iPad tablets. Through
Indspire and the Winnipeg Foundation, connections were made with Timothy Cox
(Principal) and Patricia Mainville (Vice-Principal) at David Livingstone Community
School. When asked what had piqued his interest in doing a pilot-test with the app in
Winnipeg, Mr. Millican explained:
“Like much of the world, significant disparities in the distribution of resources are
endemic to Manitoba; such disparities inevitably result in unenviable—and
perhaps avoidable— impacts on the educational experiences of many Manitoban
children. After reading about the success of the Onebillion program in Malawi, it
occurred to me that—although they were very different environments—the
principles at play should well remain the same. It seemed that, as in Africa and the
United Kingdom, the Onebillion program held the promise of having a
demonstrable, affordable impact on the first experiences of many young students
with mathematical curricula. Accordingly, and at the very least, it struck me as
worthwhile to arrange to evaluate this possibility within the context academic
research. Subsequently, I contacted Andrew Ashe (Onebillion's CEO), who was
happy to provide free licenses for the Onebillion software and to encourage our
independent review of its efficacy.” (Personal communication with Timothy Millican,
June 11, 2018).
Thus, the theory behind the pilot-test was that the Onebillion tablet-based math app
could potentially offer an innovative approach to improving math proficiency due to its
ability to provide students with individualized instruction based on their unique needs.
The app allows students to practice the material in each unit as much as they would
like, but they cannot move on to the next unit until they have demonstrated mastery of
the material by passing a quiz with 100% accuracy. Furthermore, the software also
provides positive academic feedback as the student works through each unit, which is
an integral element in developing student motivation and mathematics proficiency (Kiru
et al., 2018). Consequently, it was expected that allowing students to use the app to
practice their math skills at their own pace would result in higher mathematics scores
and more confidence with regards to academic activities in general.
Learning through a hands-on approach is consistent with Indigenous ways of knowing.
For example, using physical materials while learning mathematical concepts promotes
mastery of skills, and showing practical applications of complex ideas helps to build self-
esteem in students. A hands-on approach teaches students how to develop strategies
and creative solutions to solve problems or tasks, and it encourages them to embrace
challenges rather than give up. In addition, the use of concrete examples in teaching
basic math skills helps students become more independent as learners and instills
feelings of success with regards to their own math performance. This is particularly
important for students from low-income neighborhoods, as there is a well-established
11and strong correlation between socioeconomic status and math test scores (Anders et
al., 2012). For this pilot project, it was strongly believed that using the Onebillion app to
allow each student to go at their own pace would narrow the gaps in academic
achievement resulting from socio-economic status, EAL (English as an Additional
Language) status, or individual academic strengths.
Socio-Economic Geography of the Area
The Lord Selkirk Park community surrounding David Livingstone Community School is
increasingly becoming more diverse as a result of the rapidly growing population of
urban Indigenous peoples—primarily First Nations and Métis—and new Canadians,
who together represent the fastest growing populations in both the immediate
neighbourhoods and Canada as a whole. Indeed, Indigenous people represent 11% of
Winnipeg’s population and account for 20.6% of inner-city residents, while new
Canadians comprise almost one quarter of inner-city residents (City of Winnipeg,
2015a). In Lord Selkirk Park, Indigenous people and visible minorities represent 55.7%
and 13.9% of the population, respectively. According to the 2011 Census, Lord Selkirk
Park’s population of recent immigrants mainly consisted of people from the Philippines
(37.0%), Iraq (18.5%), and various African nations (44.4%) (City of Winnipeg, 2015b),
with newcomers from Syria having become increasingly prominent in recent years.
Despite the local cultural richness and diversity, these surrounding neighbourhoods are
high-poverty areas that struggle with social inequities, such as inadequate housing and
high unemployment that negatively affect the learning environment for local students. In
the 2011 Census, 59.3% of households in Lord Selkirk Park qualified as low-income1,
reporting a median household income of $17,252 compared to $57,925 for the City of
Winnipeg as a whole. Furthermore, 53.1% of household income in the Lord Selkirk Park
area was derived from government transfer payments (City of Winnipeg: 11.6%) (City of
Winnipeg, 2015b). Winnipeg is located in a province (Manitoba) that is frequently
referred to as the child poverty capital of Canada, as 62% of First Nation children live
below the poverty line compared to 15% of non-Indigenous children (Macdonald, &
Wilson, 2013). Approximately two-thirds of elementary students at David Livingstone
Community School live in single-parent families, and 66.9% live in families with incomes
below LICO (Winnipeg School Division, 2016-17 Demographic Report, 2017).
Not only are Indigenous youth hampered by the enormous economic disadvantages
associated with poverty, but they also experience higher school dropout and pushout
rates than children and youth in more affluent neighbourhoods. These challenges are
particularly significant in the Winnipeg community because it has the largest Indigenous
population of all the major Canadian cities, with 50% being younger than 25 years of
age (Statistics Canada, 2013b). Moreover, as a percentage of all Indigenous peoples in
Winnipeg, the number of Indigenous youth under the age of 18 is more than double that
1
Based on Statistics Canada’s 2011 after-tax low-income measure (LIM-AT).
12of their non-Indigenous counterparts (35.4% and 17.2%, respectively) (Statistics
Canada, 2013a, 2013b).
A Manitoba study found that high school completion rates in the poorest urban families
(i.e. lowest income quintile) could be as low as 55.3%, which stands in sharp contrast to
the 98.5% completion rate recorded in the highest income quintile (Brownell et al., 2012,
p. 207). In Winnipeg, students who fail to complete high school frequently come from
Indigenous families. In addition to being forced to contend with the barriers associated
with poverty, these students also face numerous barriers in the educational system,
such as an absence of cultural content and high levels of distrust resulting from the
legacy of residential schools. In Lord Selkirk Park, 56.6% of the population has no post-
secondary certificate or high school diploma, and only 8.2% of the population aged 15
years and over holds a bachelor’s degree or higher (City of Winnipeg, 2015b). Likewise,
in Winnipeg, a large gap persists in university completion rates between Indigenous and
non-Indigenous people at 12.3% and 30.4%, respectively (Statistics Canada 2013a,
2013b, 2010; Hallett, 2006). Thus, this disparity results in the potential loss of economic
and social contributions from the fastest growing segment of the community.
13Brief Review of the Background Literature on Tablet-Based Math Interventions
Studies conducted in a range of countries have consistently demonstrated that student
difficulty with math is a shared educational policy problem. In response to this global
problem, Pitchford (2015) has argued that “radical shifts in the teaching of mathematics
are needed […] to raise academic standards” (p.2). A relatively new area of research
has focused on students’ early years academic development using tablet-based
interventions (Bruhn et al., 2017; Cumming et al., 2014; Gunderson et al., 2017) and
computerized interventions in kindergarten classrooms (Praet & Desoete, 2014).
Evidence-based studies in this area have consistently found these instructional
strategies to be beneficial in creating a strong foundation in mathematical thinking in
young children (Hawkins et al., 2016; Kiger et al., 2012; Outhwaite et al., 2017; Park et
al., 2016). For example, Pitchford (2015) conducted a randomized control trial to
examine the effectiveness of the Onebillion tablet-based math intervention in over 300
primary school children in an impoverished region of Malawi. Her findings revealed that
the students who had used the math app for 30 minutes each day for 8 weeks showed
greater gains than the students in the control group, who had simply received standard,
face-to-face instruction. In another example, Riconscente (2013) found that fourth grade
students who played an iPad fractions game over a 5-day period showed 15% more
improvement in their fractions test scores than the control group. Moreover, the game
also had the effect of improving their attitudes toward fractions, producing a statistically
significant increase of 10%.
Other studies suggest that students from low-income areas can benefit from early years
tablet-based math interventions, as they frequently trail behind their middle-to-high
income counterparts at the start of kindergarten (Park et al., 2016; Schacter et al.,
2016). It is well-established that math proficiency during the early educational years is a
key predictor of later academic achievement in both math and other science,
technology, engineering and mathematics (STEM) fields as well (Park et al. 2016).
Knowledge of mathematical concepts tends to be acquired on a cumulative basis, with
each new concept becoming a building block on which the next will rely. Therefore, it is
critical that students keep up with the incremental progression involved in mathematical
instruction, as disruptions to this progression are likely to reinforce math anxiety and
resistance toward academic activities, which in turn can cause struggling students to fall
further and further behind their classmates. The necessity to keep pace becomes ever
more critical as students begin to enter the higher grades because the disengagement
and academic apathy that result from falling too far behind inevitably become significant
obstacles to finishing high school (Beilock & Maloney, 2015; Duncan et al., 2007).
Other studies have noted that the complexity and conceptual challenges of math require
greater amounts of mental resources than reading (Stacy et al., 2017), and some
researchers have even suggested that early math performance may be a significant
predictor of later literacy skills (Duncan et al., 2007; Purpura et al., 2017). Thus, it is not
surprising that students who have difficulties with math (and literacy) require more
support than other students in finishing high school. The need for continuity in math
skills can be supported by using tablet-based math interventions in the early years, as
such interventions will help ensure that students do not fall behind as a result of failing
14to learn all the necessary steps. Consequently, the use of tablet-based math
interventions may strongly predict math and reading achievements in the middle and
high school years (Park et al., 2016; Purpura et al., 2017).
Nevertheless, longitudinal studies are required in order to test this predictive
relationship in more depth, as it remains unclear whether early years math measures
adequately account for language skills; since elementary level math is highly language-
based, it may serve as a proxy measure for language skills, which in turn could put EAL
students at a disadvantage. Moreover, reading and math assessments may capture
more complex skills, such as critical thinking and comprehension (Purpura et al., 2017),
which are both critical to future academic performance. As such, tablet-based
technologies could become an indispensable tool that would help teachers address the
gaps in the educational experience of EAL and other students with language-based
challenges who need extra help to catch up to their peers.
Researchers have also noted that the inaccessibility of core curricula, including math, is
a critically important challenge for students with disabilities (Burton et al., 2013;
Cumming et al., 2014; Okolo & Diedrich, 2014; Pitchford et al., 2018). Evidence-based
research, including randomized control trials, has demonstrated the positive effects of
using technology to support students who have mathematics learning disabilities,
broader cognitive disabilities, or general difficulties in learning mathematics (Burton et
al., 2013; Cihak et al., 2010; Kiru et al., 2018). In one such study, Burton et al. (2013)
found that a tablet-based intervention was effective in helping students with behavioral
challenges stay on task, which ultimately led to improvements in their academic
performance.
Activities Accomplished
The researchers obtained permission to conduct their study, which utilized an
experimental research design, from the Winnipeg School Division and David
Livingstone Community School. Written consent was obtained from the children’s
parents or legal guardians, resulting in a total sample of 39 students from four
kindergarten classrooms at the school. To assess their starting knowledge base, all 39
students participated in the pre-test exercise, which was a traditional paper and pencil
test that was administered by the evaluator with the assistance of a Learning Support
Teacher and a volunteer research assistant. The pre-testing stage took place on April
3rd, 4th, and 6th, 2018. Since two students who were assigned to the control group
moved to a different school after pre-testing, the post-testing stage, which was
conducted on May 24th, 29th, and 31st, 2018, only consisted of 37 students.
The pre- and post-tests, which were designed by the Onebillion software publishing
company, consisted of 50 questions that were administered in 15 minute sessions over
a three-day period. Most students only required two sessions to complete the test, but
15testing was conducted in shorter sessions as needed. Pre- and post-testing was
conducted individually with each child in the hallway next to their kindergarten
classroom. The adults responsible for administering the tests refrained from identifying
or correcting wrong answers; instead, their interactions with the students were restricted
to encouraging them to answer the questions to the best of their ability and telling them
they were doing a good job.
The 50 questions on the pre-test and post-test reflected the range of numeracy skills
that students are expected to learn in kindergarten. Furthermore, the tests focused on
different measures of early years mathematical ability, including language concepts and
terms specific to mathematics (e.g., ‘more’ or ‘less’, ‘take away’, ‘fewer’, and ‘near’). For
example, one question that focused on the language-based components of early
mathematics asked the student to identify “Which cup has the most water?” (Purpura et
al., 2017). Other measures included: sorting and matching; counting (to 3, 5, 7, 10,
etc.); comparing items; recognizing different sizes, line lengths, patterns, and shapes;
and manipulating numbers through simple addition and subtraction. The students
received 1 point for each correct answer to a maximum of 50 points.
The experimental group consisted of 19 students taken from two half-day kindergarten
classrooms (a morning class and an afternoon class). Another 18 students in the other
two half-day kindergarten classrooms (the control group) received regular math
instruction over the same 7-week period. With their classroom teacher’s supervision,
guidance, and encouragement, the experimental group students practised math
concepts using the Onebillion app, which had been uploaded to individually-assigned
iPads, for 15-20 minutes each school day over a seven-week period between April 6th
and May 24th. Onebillion’s math software developed for 3-5 years of age was deemed
appropriate to these students’ developmental capacities. In addition to administering the
tablet-based intervention and keeping track of each student’s daily use, the teacher also
recorded attendance during the experimental period using a register provided in the
Onebillion package of materials and maintained a star chart that indicated how many
modules each student had completed. Since the math app is able to keep track of the
topic that the child was working on, they were able to pick up where they left off each
day. At the end of the 7-week period, the students in both groups were given a post-test
in three 15 minute sessions over a 3-day period or in shorter sessions as needed. The
evaluator administered the test at the school, and she received the assistance of the
same Learning Support Teacher and volunteer research assistant.
To supplement the researchers’ findings, they compared the results of the assessment
tools in the tablet-based math intervention to the Learning Pathway divisional math
assessments conducted in November, February, and June of 2018 for each student in
both groups (see Table A-1 in the Appendix).
Although the research design was experimental and quantitatively focused, the
evaluator also conducted qualitative interviews with the experimental group’s classroom
teacher and the school’s Vice-Principal. In addition, the parental consent form asked
parents or guardians if they would be interested in participating in a 15-minute interview
16with the evaluator, either by telephone or in-person at the school. All parents declined to
participate, however.
Materials Developed: N/A
Project Model
(see Appendix A). The project model is a screenshot from the math apps.
17Logic Model Used for the Project
Planned Work
Inputs: Staff resources: Principal, Vice-Principal, 3 Kindergarten teachers,
Resources a Learning Support Teacher, information technology staff to
Human & configure the iPads and upload math app software to iPads,
Financial volunteer assistant to administer pre- and post-tests.
Other inputs include: supplies and printed materials, 20 iPads,
Onebillion math software, school infrastructure required to deliver
the program, such as classroom space, desks, and chairs.
Funding for the acquisition of 20 iPads from the Chipman Family
Foundation at the Winnipeg Foundation.
Strategies/Major Daily lessons in mathematics using the Onebillion software, which
Activities emphasizes a number of different measures of early years
mathematical ability, such as: sorting and matching; counting (to
3, 5, 7, 10 etc.); comparing items; recognizing different sizes, line
lengths, patterns, and shapes; and simple addition and
subtraction;
Kindergarten students in the experimental group use the math app
for 20 minutes per school day over a period of seven weeks.
Intended Results
Outputs Immediate countable results/performance indicators
39 students participate in a pre-test and post-test; 19 students use
the math app for 15-20 minutes each school day over a 7-week
period; student attendance rate; number of stars/certificates
awarded to each student.
Outcomes (related to the objectives/mission of the program)
Short-Term students learn numeracy skills that prepare them for Grade 1 in
Outcomes terms of meeting the Learning Pathway divisional requirements;
Opportunities are provided for students to catch-up on missed or
misunderstood math lessons from the previous school year;
The math software stimulates student interest in math and
optimizes their learning experience; students improve their fine
and gross motor skills; students become confident and proud
learners; students learn independence; students develop a
positive outlook about school and learning new skills; students are
comfortable practising math using the tablet-based technology;
school attendance rates improve.
Intermediate Students develop math competence and confidence as evidenced
Term Outcomes by improved math marks in the primary school years;
Students are more engaged in their academic studies/schooling;
School attendance rates improve;
Improve academic standards and outcomes in the early years;
Student curiosity about academics in general or other subject-
matter (e.g. reading/writing) is nurtured.
18Ultimate Goals Long-term (the student’s educational and life outcomes)
or Impact The experimental group students’ math skills exceed those of
age-matched peers throughout their years of schooling;
The program generates resilient children who have a high
probability of reaching their academic potential in elementary
school and performing at or above grade level;
Positive spillover effects are passed on to siblings and other
family members and other social networks;
Reduced school push-out/drop-out rates: participants graduate
from high school and have opportunities to pursue higher
education;
Students exhibit a desire for lifelong learning;
Improved math literacy and educational outcomes of Indigenous
people in the high poverty areas of Winnipeg.
Social impacts: community capacity/social capital expands in
high-poverty areas of Winnipeg.
Performance Indicators and Measures
The researchers determined that the most meaningful way to measure the success of
this intervention would be to utilize an experimental design consisting of an
experimental group (i.e., the students who used the Onebillion math app) and a control
group (i.e., the students who received standard face-to-face instruction). This task was
accomplished with a group of 37 kindergarten students at David Livingstone Community
School in the Winnipeg School Division.
The researchers adopted a number of performance indicators in examining the pre-test
and post-test scores, including:
- Change in the average scores of all students in each group from pre-test to post-
test.
- A comparison of statistically significant differences between the scores of the
experimental and control groups.
- Statistically significant differences between the two groups at the pre-test stage.
For example, if the experimental group is already strong in math, they may
progress at a faster rate than the control group.
- Comparison of average score differences between pre-test and post-test for high
and low performers in both groups.
- Gender and age (born earlier versus later in the year) comparisons in average
performance.
- Differences between the morning and afternoon classes for both groups.
19- The role that attendance rate may have played in the results for the experimental
group.
- In the experimental group, the correlation between post-test scores and
stars/certificates earned after completing each of the ten modules.
- Exploring potential links between the Learning Pathway divisional assessments
and the learning outcomes of the control and experimental groups.
If statistically significant differences between the experimental and control groups are
observed for a number of these performance measures, it becomes possible to
tentatively attribute these positive academic outcomes to the Onebillion math app.
Although the researchers anticipated positive outcomes, the present study explored
whether a shorter intervention of seven weeks could result in significant improvements
in math competencies in the experimental group. The researchers hypothesized that
they would observe small improvements in the control group; however, as indicated in
the logic model, the end measure of academic success will be whether or not there is a
significant improvement in high school completion rates and subsequent enrollment in
post-secondary studies. Unfortunately, this data will not be available for many years to
come. Similarly, the sustainability of student learning as they enter grade one will
remain unknown unless a longitudinal study is undertaken.
As a final data-collection measure, the researchers invited the experimental group’s
kindergarten teacher and administrators at David Livingstone Community School to
participate in semi-structured interviews at the end of the program. The objective of
these interviews was to gain insight into the student/teacher experiences with the
tabled-based math intervention. The interviews consisted of seven groupings of specific
questions, although the researchers encouraged participants to deviate outside of this
line of questioning if they preferred. Each interview took approximately 30 minutes to
complete, and each interviewee’s observations were analyzed and recorded
qualitatively in order to further support our quantitative findings.
Evaluation
Evaluation Framework: Planned Data Collection
The evaluator participated in an initial telephone conference call with the Nurturing
Capacity Program Coordinator from Indspire, the Director of the Chipman Family
Foundation, and the Administrators and Teachers at David Livingstone Community
School. During this meeting, it was decided that the best way to accomplish this
evaluation was by utilizing an experimental design. In addition, a number of necessary
modifications were identified. For example, nursery students would be excluded
because they were not academically prepared to participate, the wording of the tests
was identified as being in need of further refinement in order to address cultural and
20language issues, and the random assignment of students to the experimental and
control groups was deemed impractical.
On November 6th, 2017, an in-person meeting was scheduled between the evaluator
and key stakeholders at the school. The agenda included a review of the
parent/guardian consent form, a discussion of the wording in the student assessments
(pre-test and post-test), and whether the Learning Pathway divisional assessments
would be available for comparison with the results of the experimental study. In addition,
the researchers reviewed the request for project approval that was subsequently
submitted to the Winnipeg School Division, and they also discussed a list of potential
school stakeholders and other individuals (e.g. parents or guardians) who might be
interviewed for the qualitative component of the evaluation.
Student assessments were initially scheduled for late January and mid-March, although
the timeline was later revised to early April and late May. The data collection sources
are listed in Table 2.
Table 2: Sources of Actual Data Collection
Name/number Position/Role Methods
19 students in the morning Kindergarten Quantitative analysis: Experimental Group
and afternoon classes in students
Room 20
Girls: 9; Boys: 10
20 students in the morning Kindergarten Quantitative analysis: Control Group
and afternoon classes in students
Room 21
Girls: 13; Boys: 7
(2 girls left the study prior to
the post-test)
Ms. Pedersen Room 20 Qualitative interview with homeroom
Teacher teacher of the Experimental Group
Ms. Mainville Vice-Principal Qualitative interview
Mr. Millican Project initiator Email correspondence and in-person
communication regarding the Onebillion
math app and history of the project, i.e. the
decision to pilot test the Onebillion math
app in Winnipeg.
Qualitative interview questions were designed to collect data on what worked well in the
tablet-based intervention, how well the students responded, and whether this
technology built on the strengths of the provincial math curriculum. Furthermore, the
researchers were also interested to find out what challenges were encountered, what
lessons were learned, and which causal factors contributed to the program’s successes.
21The concept behind the experimental design in Table 3 is that daily individualized
practice at a pace dictated by the student over a seven-week period would cause the
experimental group to realize greater gains than the control group with respect to math
competency.
Table 3: Experimental Design
Kindergarten Pre-test (1) Experimental Group Post-test (1)
Students' 3-15 minute Uses the tablet-based math app 3-15 minute
Assigned # sessions 15-20 minutes each weekday sessions
Experimental April 2, 3, & 6, From April 6-May 24, 2018 May 24, 29 &
Group 2018 19 students use math app 31
All Students All Students
1. X X – Math tablet APP for 3-5 year olds X
2. X X – Math tablet APP for 3-5 year olds X
3. X X – Math tablet APP for 3-5 year olds X
… X X – Math tablet APP for 3-5 year olds X
19. X X – Math tablet APP for 3-5 year olds X
Control Group
20. X Standard pedagogical instruction X
21. X Standard pedagogical instruction X
22. X Standard pedagogical instruction X
… X Standard pedagogical instruction X
37. X Standard pedagogical instruction X
(1) Using the assessment tool provide by the Onebillion organization
Evaluation Outcomes: Summary of Key Findings
Descriptive analyses are listed in Table 4. None of the pre-test scores in the
experimental group were statistically different from those of the control group. However,
the statistically significant differences in the post-test scores between the two groups
are particularly noteworthy. Scores that are statistically different simply indicate that
there is a reasonable degree of certainty that the observed difference is reliable and
probably true. Since the pre-test scores were relatively similar in value, the difference
between these scores had a higher probability of not being a true difference.
Collectively, the findings in the current study support prior research. The quantitative
outcomes in Table 4 were correlated with the teacher’s assessment of student
engagement with the math app. An interview with the homeroom teacher revealed that
the students were excited to use the iPad and, as expected, they were more likely to
engage in a task that they perceive to be fun and easy. Furthermore, the individualized
instruction helped them to stay on task and to become more independent learners.
Therefore, at least in part, this intervention appeared to lay the groundwork for the
22development of a more internalized individual interest in learning. The teacher remarked
that the tablet-based technology was relatively easy to supervise, which is consistent
with the findings of a prior study (Stacy et al., 2017).
Table 4: Comparisons of Experimental and Control Group Results
N= % Post-test Pre- % Cohen’s
test change d
Experimental Group Average test
scores
Average score (out of 50 points) 19 100.0 33.9* 26.0 +30.4% 0.99
Students scoring higher in the
post-test compared to the pre- 19 100.0 - - -
test
Average score of students
scoring 50% or lower correct 11 57.9 29.6* 19.8 +49.5% 1.75
answers on the pre-test
Average score of students
scoring over 50% correct 8 42.1 39.8* 34.5 +15.4% 1.31
answers on the pre-test
N= % Post-test Pre- % Cohen’s
test change d
Control Group Average test
scores
Average score (out of 50 points) 18 100.0 25.7 23.3 +10.3% 0.35
Students scoring higher in the
post-test compared to pre-test 11 61.1 - - -
Students scoring lower on the
post-test compared to the pre- 4 22.2 - - -
test
Students scoring the same on 3 16.7 - - -
pre-and-post-test
Average score of students
scoring 50% or lower correct 10 55.6 21.4 18.2 +17.6% 0.61
answers on the pre-test
Average score of students
scoring over 50% correct 8 44.4 31.1 29.8 +4.4% 0.52
answers on the pre-test
Note: students were granted one point for each correct answer on the pre-test and post-test.
*statistically significant difference with respect to the control group (pRegarding improvements in the performance of experimental group students facing
language-based challenges (EAL, speech, and other issues, etc.), the teacher
concurred that the math app was able to mitigate the language-related gaps in math
instruction, as certain aspects of the app (visual, etc.) did not necessarily require strong
language skills. As such, the reduced emphasis on language makes the app an
effective tool that could be used to help EAL students keep pace with, or catch up to,
their English-as-a-first-language peers.
Highlights of Findings
➢ This research highlights selective improvements in a few areas. As expected, the
experimental group showed a greater overall % change than the control group in
average score from the pre-test to the post-test at +30.4% compared to +10.3%,
respectively.
➢ Notably, the experimental group scored only slightly higher than the control group
in the pre-test (2.7 points higher average points or 11.6%) and considerably
higher in the post-test (8.2 points, or 31.9%, higher than the control group’s
average score).
➢ The students who benefited most from using the Onebillion math app were those
in the experimental group who had weaker scores in the pre-test (a score of 50%
or lower). These students’ post-test scores far exceeded expectations, increasing
by an average of 49.5% (range: 12.5-154.5%). In fact, these students performed
better than the stronger students (pre-test scores exceeding 50%), who only
achieved an average increase of 15.4% on the post-test (range: 2.4-33.3%). In
addition, the teacher remarked that the app improved the math-challenged
students’ attention span and listening skills, as it forced them to slow down and
listen carefully to instructions. As a result, the students displayed less overall
distraction than with the usual pedagogical practice. In particular, students with
learning challenges (e.g. EAL, speech difficulties, or other issues) achieved the
strongest results, which was remarkable considering they had only been
practicing with the app for seven weeks. However, this finding may partly reflect
their improved language abilities over that period of time.
➢ The improvements were not as significant in the control group. Here again, the
biggest gain was experienced by students who had weaker scores in the pre-test
(50% or lower). These students’ post-test scores increased by an average of
17.6% compared to only 4.4% for the stronger students in control group (50% or
higher in the pre-test). These findings are not wholly surprising, as a certain
amount of learning and growth in math competency was expected for the
students receiving standard face-to-face instruction.
➢ While the researchers found a small and insignificant correlation between school
attendance rates and post-test scores in the experimental group, they also found
a statistically significant positive correlation (Pearson’s correlation coefficient
240.48, p
reached statistical significance in 15 out 50 (30%) questions, once again largely
       due to the experimental group pulling ahead in terms of learning gains.

The experimental group showed major improvements over the control group in the
areas of pattern recognition (e.g. triangle, triangle, rectangle); early pre-proportional
reasoning (same as, more than, fewer than); basic arithmetical learning (one more/one
less than; two less than); basic arithmetic visualization (e.g. I have 8 cats and take away
3); number recognition and counting to 20; and telling time on an analogue clock.

The Pathway Learning Assessment analysis completed by the evaluator (see Table A-
1) indicated that the experimental group was the stronger of the two groups, as many of
them had already reached the kindergarten achievement expectations outlined in the
divisional curriculum framework prior to the implementation of the Onebillion pilot
project. By June of 2018, 17 out of 18 control group students were missing at least one
curricular target (compared to 8 out of 19 in the experimental group). Furthermore, at
least 50% of the control group had not achieved the requirements in one or more of six
areas, including: mathematical and flexible thinking, pre-proportional reasoning, rote
counting, place value, and basic arithmetic learning. Similarly, the majority of students
(6 out of 8) in the experimental group who did not reach all of the kindergarten curricular
targets had earned 5 or fewer Onebillion stars. As shown in Table A-1, the math app
seemed to help a minority of experimental group students improve in the area of rote
counting and place value (5 out of 19).

The analysis in Table A-2 is consistent with findings in the Pathway Learning
Assessment. While the control group improved in areas mostly related to the
kindergarten math curriculum (e.g. counting to ten; size attributes, number recognition,
etc.), Onebillion program was particularly beneficial for the students in the experimental
group because it challenged them to perform above their grade level in a variety of
areas, including: comprehension of positional words, such as left, right, and middle;
counting and basic arithmetical learning, e.g. two less than 5; arithmetical visualization
(end of Grade 1), e.g. I have 4 fish and I add 4 more. How many fish do I have?; equal
sharing, e.g. I have 6 candies, so how do I share them equally between 2 children?; and
skip counting, ordinal numbers, and telling time on an analogue clock. Given their
significant gains, it is likely that these students will enter Grade 1 with confidence in their
mathematical skills.

The above results suggest that the Onebillion math app likely contributed to
improvements in the math scores of the experimental group students, particularly
males, students with weaker pre-test scores, and those earning more stars by
completing the modules. This conclusion was supported by the homeroom teacher,
who confirmed that overall student interest in solving math problems and general
performance in math had both improved during the study.

For readers who are adept in statistical analysis, the researchers report Cohen’s d
within-group effect sizes in Table A-3, which compares pre-test and post-test average

                                                                                            26
scores in the experimental and control groups on the basis of gender, morning and
afternoon class, and born earlier/later in the year. Effect size indicates something about
the magnitude or strength of the difference between the pre-test and post-test. The
differences were large in all categories for the experimental group, indicating
substantive increases in average scores, and small-to-medium for the control group.
Study Limitations
Despite this study’s remarkably positive results, the approaches that were used have
several limitations that warrant discussion. For instance, other studies that have
assessed tablet-based math apps employed more sophisticated research designs and
analytical approaches, particularly the use of multivariate analyses (i.e. the statistical
analysis of many variables at once, which usually requires large data sets). In contrast
to prior studies (see Pitchford, 2015; Outhwaite et al., 2017), this was a pilot project with
a relatively small sample size; as such, the sample used in this study may have been
too small for accurate analyses, and it was certainly too small to obtain detailed
statistical analyses. In terms of practicality, since accessibility was a critically important
consideration in preparing this evaluation report, more complex multivariate analyses
were deliberately avoided.
Furthermore, the random assignment of students to the experimental and control
groups was deemed impractical in the study’s early planning stages; as an alternative
option, it was decided that students would be assigned to their respective groups based
on their enrollment in a classroom. As shown in Table A-1, compared to the control
group, most students in the experimental group had already achieved the kindergarten
math requirements at the pre-test stage. The control group class might have benefitted
more from practicing math using the app. It is also possible that the results were
influenced by the ‘test-taking effect’, which is when knowledge of the pre-test influences
scores on the post-test (i.e. students remember content from the pre-test). In evaluation,
this is referred to an internal validity problem, as it affects the observed outcome. In
addition, the evidence for the pre- and post-test’s statistical reliability as a tool or valid
measure remains unavailable. These may all be different explanations for the positive
results.
Nevertheless, even though the researchers were unable to conduct a large-scale study
of the causal links between app use and improved math ability, this study provides an
important first step in testing the practical utility of tablet-based math apps in
kindergarten classes. Indeed, at a time when diversity and inclusive learning needs are
rapidly increasing in classrooms, the Onebillion math app offers the Winnipeg School
Division a promising avenue for future early years math interventions.
27You can also read