Online Human-Bot Interactions: Detection, Estimation, and Characterization
←
→
Page content transcription
If your browser does not render page correctly, please read the page content below
Online Human-Bot Interactions: Detection, Estimation, and Characterization

                                              Onur Varol,1,* Emilio Ferrara,2 Clayton A. Davis,1 Filippo Menczer,1 Alessandro Flammini1
                                                           1
                                                               Center for Complex Networks and Systems Research, Indiana University, Bloomington, US
                                                            2
                                                               Information Sciences Institute, University of Southern California, Marina del Rey, CA, US
arXiv:1703.03107v2 [cs.SI] 27 Mar 2017

                                                                      Abstract                                et al. 2011), promote terrorist propaganda and recruit-
                                                                                                              ment (Berger and Morgan 2015; Abokhodair, Yoo, and Mc-
                                           Increasing evidence suggests that a growing amount of social
                                           media content is generated by autonomous entities known
                                                                                                              Donald 2015; Ferrara et al. 2016c), manipulate the stock
                                           as social bots. In this work we present a framework to de-         market (Ferrara et al. 2016a), and disseminate rumors and
                                           tect such entities on Twitter. We leverage more than a thou-       conspiracy theories (Bessi et al. 2015).
                                           sand features extracted from public data and meta-data about          A growing body of research is addressing social bot ac-
                                           users: friends, tweet content and sentiment, network patterns,     tivity, its implications on the social network, and the de-
                                           and activity time series. We benchmark the classification          tection of these accounts (Lee, Eoff, and Caverlee 2011;
                                           framework by using a publicly available dataset of Twitter         Boshmaf et al. 2011; Beutel et al. 2013; Yang et al. 2014;
                                           bots. This training data is enriched by a manually annotated       Ferrara et al. 2016a; Chavoshi, Hamooni, and Mueen 2016).
                                           collection of active Twitter users that include both humans        The magnitude of the problem was underscored by a Twit-
                                           and bots of varying sophistication. Our models yield high ac-      ter bot detection challenge recently organized by DARPA to
                                           curacy and agreement with each other and can detect bots of
                                           different nature. Our estimates suggest that between 9% and
                                                                                                              study information dissemination mediated by automated ac-
                                           15% of active Twitter accounts are bots. Characterizing ties       counts and to detect malicious activities carried out by these
                                           among accounts, we observe that simple bots tend to interact       bots (Subrahmanian et al. 2016).
                                           with bots that exhibit more human-like behaviors. Analysis of
                                           content flows reveals retweet and mention strategies adopted       Contributions and Outline
                                           by bots to interact with different target groups. Using cluster-   Here we demonstrate that accounts controlled by soft-
                                           ing analysis, we characterize several subclasses of accounts,      ware exhibit behaviors that reflects their intents and modus
                                           including spammers, self promoters, and accounts that post         operandi (Bakshy et al. 2011; Das et al. 2016), and that such
                                           content from connected applications.                               behaviors can be detected by supervised machine learning
                                                                                                              techniques. This paper makes the following contributions:
                                                                  Introduction                                • We propose a framework to extract a large collection
                                         Social media are powerful tools connecting millions of peo-             of features from data and meta-data about social media
                                         ple across the globe. These connections form the substrate              users, including friends, tweet content and sentiment, net-
                                         that supports information dissemination, which ultimately               work patterns, and activity time series. We use these fea-
                                         affects the ideas, news, and opinions to which we are ex-               tures to train highly-accurate models to identify bots. For
                                         posed. There exist entities with both strong motivation and             a generic user, we produce a [0, 1] score representing the
                                         technical means to abuse online social networks — from in-              likelihood that the user is a bot.
                                         dividuals aiming to artificially boost their popularity, to or-      • The performance of our detection system is evaluated
                                         ganizations with an agenda to influence public opinion. It              against both an existing public dataset and an additional
                                         is not difficult to automatically target particular user groups         sample of manually-annotated Twitter accounts collected
                                         and promote specific content or views (Ferrara et al. 2016a;            with a different strategy. We enrich the previously-trained
                                         Bessi and Ferrara 2016). Reliance on social media may                   models using the new annotations, and investigate the ef-
                                         therefore make us vulnerable to manipulation.                           fects of different datasets and classification models.
                                            Social bots are accounts controlled by software, algo-
                                         rithmically generating content and establishing interactions.        • We classify a sample of millions of English-speaking ac-
                                         Many social bots perform useful functions, such as dis-                 tive users. We use different models to infer thresholds in
                                         semination of news and publications (Lokot and Diakopou-                the bot score that best discriminate between humans and
                                         los 2016; Haustein et al. 2016) and coordination of vol-                bots. We estimate that the percentage of Twitter accounts
                                         unteer activities (Savage, Monroy-Hernandez, and Höllerer              exhibiting social bot behaviors is between 9% and 15%.
                                         2016). However, there is a growing record of malicious ap-           • We characterize friendship ties and information flow be-
                                         plications of social bots. Some emulate human behavior to               tween users that show behaviors of different nature: hu-
                                         manufacture fake grassroots political support (Ratkiewicz               man and bot-like. Humans tend to interact with more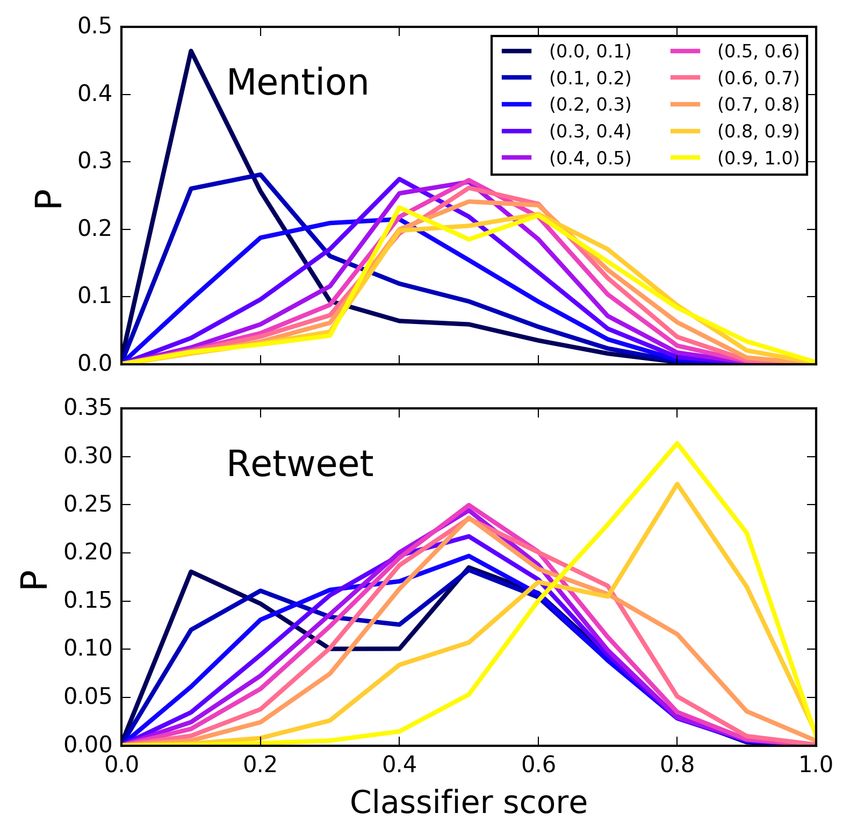
human-like accounts than bot-like ones, on average. Reci-        Temporal features. Prior research suggests that the tem-
  procity of friendship ties is higher for humans. Some bots       poral signature of content production and consumption may
  target users more or less randomly, others can choose tar-       reveal important information about online campaigns and
  gets based on their intentions.                                  their evolution (Ghosh, Surachawala, and Lerman 2011;
• Clustering analysis reveals certain specific behavioral          Ferrara et al. 2016b; Chavoshi, Hamooni, and Mueen 2016).
  groups of accounts. Manual investigation of samples ex-          To extract this signal we measure several temporal features
  tracted from each cluster points to three distinct bot           related to user activity, including average rates of tweet pro-
  groups: spammers, self promoters, and accounts that post         duction over various time periods and distributions of time
  content from connected applications.                             intervals between events.
                                                                   Content and language features. Many recent papers have
              Bot Detection Framework                              demonstrated the importance of content and language fea-
In the next section, we introduce a Twitter bot detection          tures in revealing the nature of social media conversa-
framework (truthy.indiana.edu/botornot) that                       tions (Danescu-Niculescu-Mizil et al. 2013; McAuley and
is freely available online. This system leverages more than        Leskovec 2013; Mocanu et al. 2013; Botta, Moat, and Preis
one thousand features to evaluate the extent to which a Twit-      2015; Letchford, Moat, and Preis 2015; Das et al. 2016).
ter account exhibits similarity to the known characteristics       For example, deceiving messages generally exhibit informal
of social bots (Davis et al. 2016).                                language and short sentences (Briscoe, Appling, and Hayes
                                                                   2014). Our system does not employ features capturing the
Feature Extraction                                                 quality of tweets, but collects statistics about length and en-
                                                                   tropy of tweet text. Additionally, we extract language fea-
Data collected using the Twitter API are distilled in 1,150        tures by applying the Part-of-Speech (POS) tagging tech-
features in six different classes. The classes and types of fea-   nique, which identifies different types of natural language
tures are reported in Table 1 and discussed next.                  components, or POS tags. Tweets are therefore analyzed to
User-based features. Features extracted from user meta-            study how POS tags are distributed.
data have been used to classify users and patterns be-             Sentiment features. Sentiment analysis is a powerful tool
fore (Mislove et al. 2011; Ferrara et al. 2016a). We ex-           to describe the emotions conveyed by a piece of text, and
tract user-based features from meta-data available through         more broadly the attitude or mood of an entire conversa-
the Twitter API. Such features include the number of friends       tion. Sentiment extracted from social media conversations
and followers, the number of tweets produced by the users,         has been used to forecast offline events including financial
profile description and settings.                                  market fluctuations (Bollen, Mao, and Zeng 2011), and is
                                                                   known to affect information spreading (Mitchell et al. 2013;
Friends features. Twitter actively fosters inter-
                                                                   Ferrara and Yang 2015). Our framework leverages sev-
connectivity. Users are linked by follower-friend (fol-
                                                                   eral sentiment extraction techniques to generate various
lowee) relations. Content travels from person to person via
                                                                   sentiment features, including arousal, valence and domi-
retweets. Also, tweets can be addressed to specific users
                                                                   nance scores (Warriner, Kuperman, and Brysbaert 2013),
via mentions. We consider four types of links: retweeting,
                                                                   happiness score (Kloumann et al. 2012), polarization and
mentioning, being retweeted, and being mentioned. For
                                                                   strength (Wilson, Wiebe, and Hoffmann 2005), and emoti-
each group separately, we extract features about language
                                                                   con score (Agarwal et al. 2011).
use, local time, popularity, etc. Note that, due to Twitter’s
API limits, we do not use follower/followee information            Model Evaluation
beyond these aggregate statistics.
                                                                   To train our system we initially used a publicly available
Network features. The network structure carries crucial            dataset consisting of 15K manually verified Twitter bots
information for the characterization of different types of         identified via a honeypot approach (Lee, Eoff, and Caver-
communication. In fact, the usage of network features sig-         lee 2011) and 16K verified human accounts. We collected
nificantly helps in tasks like political astroturf detection       the most recent tweets produced by those accounts using the
(Ratkiewicz et al. 2011). Our system reconstructs three types      Twitter Search API. We limited our collection to 200 public
of networks: retweet, mention, and hashtag co-occurrence           tweets from a user timeline and up to 100 of the most recent
networks. Retweet and mention networks have users as               public tweets mentioning that user. This procedure yielded a
nodes, with a directed link between a pair of users that fol-      dataset of 2.6 million tweets produced by manually verified
lows the direction of information spreading: toward the user       bots and 3 million tweets produced by human users.
retweeting or being mentioned. Hashtag co-occurrence net-             We benchmarked our system using several off-the-shelf
works have undirected links between hashtag nodes when             algorithms provided in the scikit-learn library (Pedregosa et
two hashtags occur together in a tweet. All networks are           al. 2011). In a generic evaluation experiment, the classifier
weighted according to the frequency of interactions or co-         under examination is provided with numerical vectors, each
occurrences. For each network, we compute a set of fea-            describing the features of an account. The classifier returns a
tures, including in- and out-strength (weighted degree) dis-       numerical score in the unit interval. A higher score indicates
tributions, density, and clustering. Note that out-degree and      a stronger belief that the account is a bot. A model’s accu-
out-strength are measures of popularity.                           racy is evaluated by measuring the Area Under the receiver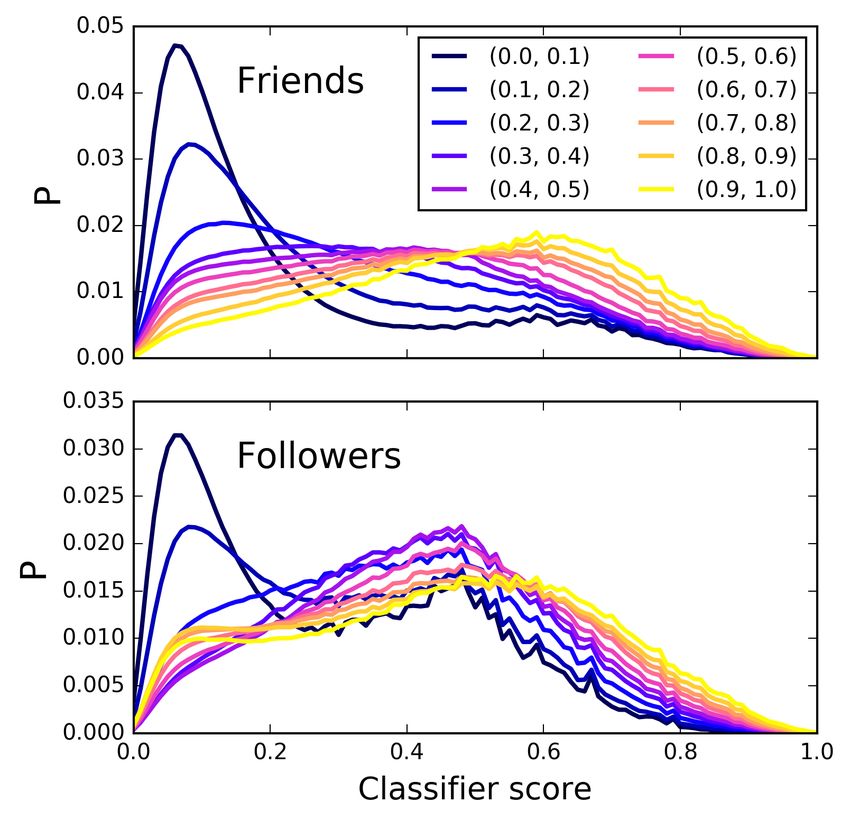
Table 1: List of 1150 features extracted by our framework.
              Screen name length                                           (***) Happiness scores of aggregated tweets
              Number of digits in screen name                              (***) Valence scores of aggregated tweets
              User name length                                             (***) Arousal scores of aggregated tweets
              Time offset (sec.)                                           (***) Dominance scores of single tweets
              Default profile (binary)                                     (*) Happiness score of single tweets
              Default picture (binary)                                     (*) Valence score of single tweets
              Account age (days)                                           (*) Arousal score of single tweets
           User meta-data

                                                                         Sentiment
              Number of unique profile descriptions                        (*) Dominance score of single tweets
              (*) Profile description lengths                              (*) Polarization score of single tweets
              (*) Number of friends distribution                           (*) Entropy of polarization scores of single tweets
              (*) Number of followers distribution                         (*) Positive emoticons entropy of single tweets
              (*) Number of favorites distribution                         (*) Negative emoticons entropy of single tweets
              Number of friends (signal-noise ratio and rel. change)       (*) Emoticons entropy of single tweets
              Number of followers (signal-noise ratio and rel. change)     (*) Positive and negative score ratio of single tweets
              Number of favorites (signal-noise ratio and rel. change)     (*) Number of positive emoticons in single tweets
              Number of tweets (per hour and total)                        (*) Number of negative emoticons in single tweets
              Number of retweets (per hour and total)                      (*) Total number of emoticons in single tweets
              Number of mentions (per hour and total)                      Ratio of tweets that contain emoticons
              Number of replies (per hour and total)
              Number of retweeted (per hour and total)
              Number of distinct languages                                 Number of nodes
              Entropy of language use                                      Number of edges (also for reciprocal)
              (*) Account age distribution                                 (*) Strength distribution

                                                                         Network (‡)
           Friends (†)

              (*) Time offset distribution                                 (*) In-strength distribution
              (*) Number of friends distribution                           (*) Out-strength distribution
              (*) Number of followers distribution                         Network density (also for reciprocal)
              (*) Number of tweets distribution                            (*) Clustering coeff. (also for reciprocal)
              (*) Description length distribution
              Fraction of users with default profile and default picture
              (*,**) Frequency of POS tags in a tweet                      (*) Time between two consecutive tweets
           Content

                                                                         Timing

              (*,**) Proportion of POS tags in a tweet                     (*) Time between two consecutive retweets
              (*) Number of words in a tweet                               (*) Time between two consecutive mentions
              (*) Entropy of words in a tweet
           †
             We consider four types of connected users: retweeting, mentioning, retweeted, and mentioned.
           ‡
             We consider three types of network: retweet, mention, and hashtag co-occurrence networks.
           *
             Distribution types. For each distribution, the following eight statistics are computed and used as individual fea-
           tures: min, max, median, mean, std. deviation, skewness, kurtosis, and entropy.
           **
              Part-Of-Speech (POS) tag. There are nine POS tags: verbs, nuns, adjectives, modal auxiliaries, pre-determiners,
           interjections, adverbs, wh-, and pronouns.
           ***
               For each feature, we compute mean and std. deviation of the weighted average across words in the lexicon.

operating characteristic Curve (AUC) with 5-fold cross val-                   newly available training data.
idation, and computing the average AUC score across the                          To obtain an updated evaluation of the accuracy of our
folds using Random Forests, AdaBoost, Logistic Regression                     model, we constructed an additional, manually-annotated
and Decision Tree classifiers. The best classification perfor-                collection of Twitter user accounts. We hypothesize that this
mance of 0.95 AUC was obtained by the Random Forest al-                       recent collection includes some bots that are more sophisti-
gorithm. In the rest of the paper we use the Random Forest                    cated than the ones obtained years earlier with the honeypot
model trained using 100 estimators and the Gini coefficient                   method. We leveraged these manual annotations to evalu-
to measure the quality of splits.                                             ate the model trained using the honeypot dataset and then
                                                                              to update the classifier’s training data, producing a merged
                            Large-Scale Evaluation                            dataset to train a new model that ensures better generaliza-
                                                                              tion to more sophisticated accounts. User IDs and annota-
We realistically expect that the nature and sophistication of                 tion labels in our extended dataset are publicly available
bots evolves over time and changes in specific conversa-                      (truthy.indiana.edu/botornot/data).
tional domains. It is therefore important to determine how
reliable and consistent are the predictions produced by a
                                                                              Data Collection
system trained on a dataset but tested on different data (in
the wild). Also, the continuously-evolving nature of bots                     Our data collection focused on users producing content
dictates the need to constantly update the models based on                    in English, as inferred from profile meta-data. We iden-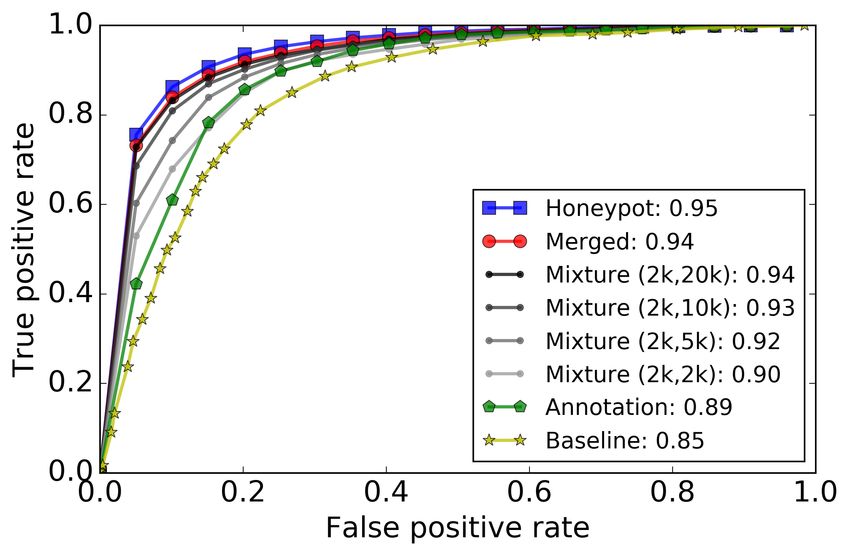
tified a large, representative sample of users by monitor-
ing a Twitter stream, accounting for approximately 10%
of public tweets, for 3 months starting in October 2015.
This approach avoids known biases of other methods such
as snowball and breadth-first sampling, which rely on the
selection of an initial group of users (Gjoka et al. 2010;
Morstatter et al. 2013). We focus on English speaking users
as they represent the largest group on Twitter (Mocanu et al.
2013).
    To restrict our sample to recently active users, we intro-
duce the further criteria that they must have produced at least
200 tweets in total and 90 tweets during the three-month ob-
servation window (one per day on average). Our final sample
includes approximately 14 million user accounts that meet
both criteria. For each of these accounts, we collected their
tweets through the Twitter Search API. We restricted the col-     Figure 1: ROC curves of models trained and tested on dif-
lection to the most recent 200 tweets and 100 mentions of         ferent datasets. Accuracy is measured by AUC.
each user, as described earlier. Owing to Twitter API limits,
this greatly improved our data collection speed. This choice
also reduces the response time of our service and API. How-       Evaluating Models Using Annotated Data
ever the limitation adds noise to the features, due to the        To evaluate our classification system trained on the honeypot
scarcity of data available to compute them.                       dataset, we examined the classification accuracy separately
                                                                  for each bot-score decile of the manually annonated dataset.
Manual Annotations
                                                                  We achieved classification accuracy greater than 90% for
We computed classification scores for each of the active ac-      the accounts in the (0.0, 0.4) range, which includes mostly
counts using our initial classifier trained on the honeypot       human accounts. We also observe accuracy above 70% for
dataset. We then grouped accounts by their bot scores, allow-     scores in the (0.8, 1.0) range (mostly bots). Accuracy for ac-
ing us to evaluate our system across the spectrum of human        counts in the grey-area range (0.4, 0.8) fluctuates between
and bot accounts without being biased by the distribution of      60% and 80%. Intuitively, this range contains the most chal-
bot scores. We randomly sampled 300 accounts from each            lenging accounts to label, as reflected also in the low inter-
bot-score decile. The resulting balanced set of 3000 accounts     annotators overlap in this region. When the accuracy of each
were manually annotated by inspecting their public Twitter        bin is weighted by the population density in the large dataset
profiles. Some accounts have obvious flags, such as using a       from which the manually annonated has been extracted, we
stock profile image or retweeting every message of another        obtain 86% overall classification accuracy.
account within seconds. In general, however, there is no sim-        We also compare annotator agreement scores for the ac-
ple set of rules to assess whether an account is human or bot.    counts in each bot-score decile. We observe that agreement
With the help of four volunteers, we analyzed profile appear-     scores are higher for accounts in the (0.0, 0.4) range and
ance, content produced and retweeted, and interactions with       lower for accounts in the (0.8, 1.0) range, indicating that it
other users in terms of retweets and mentions. Annotators         is more difficult for human annotators to identify bot-like as
were not given a precise set of instructions to perform the       opposed to human-like behavior.
classification task, but rather shown a consistent number of         We observe a similar pattern for the amount of time re-
both positive and negative examples. The final decisions re-      quired on average to annotate human and bot accounts. An-
flect each annotator’s opinion and are restricted to: human,      notators employed on average 33 seconds to label human
bot, or undecided. Accounts labeled as undecided were elim-       accounts and 37 seconds for bot accounts.
inated from further analysis.                                        Fig. 1 shows the results of experiments designed to in-
   We annotated all 3000 accounts. We will refer to this set      vestigate our ability to detect manually annotated bots. The
of accounts as the manually annotated data set. Each anno-        baseline ROC curve is obtained by testing the honeypot
tator was assigned a random sample of accounts from each          model on the manually annotated dataset. Unsurprisingly,
decile. We enforced a minimum 10% overlap between an-             the baseline accuracy (0.85 AUC) is lower than that obtained
notations to assess the reliability of each annotator. This       cross-validating on the honeypot data (0.95 AUC), because
yielded an average pairwise agreement of 75% and moder-           the model is not trained on the newer bots.
ate inter-annotator agreement (Cohen’s κ = 0.41). We also
computed the agreement between annotators and classifier          Dataset Effect on Model Accuracy
outcomes, assuming that a classification score above 0.5 is
                                                                  We can update our models by combining the manually-
interpreted as a bot. This resulted in an average pairwise
                                                                  annotated and honeypot datasets. We created multiple bal-
agreement of 79% and a moderately high Cohen’s κ = 0.5.
                                                                  anced datasets and performed 5-fold cross-validation to
These results suggest high confidence in the annotation pro-
                                                                  evaluate the accuracy of the corresponding models:
cess, as well as in the agreement between annotations and
model predictions.                                                • Annotation: We trained and tested a model by only using
Figure 3: Comparison of scores for different models. Each
                                                                  account is represented as a point in the scatter plot with a
                                                                  color determined by its category. Test points are randomly
Figure 2: Distribution of classifier score for human and bot      sampled from our large-scale collection. Pearson correla-
accounts in the two datasets.                                     tions between scores are also reported, along with estimated
                                                                  thresholds and corresponding accuracies.
  annotated accounts and labels assigned by the majority of
  annotators. This yields 0.89 AUC, a reasonable accuracy
                                                                  best performance with user meta-data features; content fea-
  considering that the dataset contains recent and possibly
                                                                  tures are also effective. Both yielded AUC above 0.9. Other
  sophisticated bots.
                                                                  feature classes yielded AUC above 0.8.
• Merged: We merged the honeypot and annotation                      We analyzed the importance of single features using the
  datasets for training and testing. The resulting classifier     Gini impurity score produced by our Random Forests model.
  achieves 0.94 AUC, only slightly worse than the honey-          To rank the top features for a given dataset, we randomly se-
  pot (training and test) model although the merged dataset       lect a subset of 10,000 accounts and compute the top features
  contains a variety of more recent bots.                         across 100 randomized experiments. The top 10 features are
• Mixture: Using mixtures with different ratios of accounts       sufficient to reach performance of 0.9 AUC. Sentiment and
  from the manually annotated and honeypot datasets, we           content of mentioned tweets are important features along
  obtain an accuracy ranging between 0.90 and 0.94 AUC.           with the statistical properties of retweet networks. Features
                                                                  of the friends with whom a user interacts are strong predic-
   In Fig 2, we plot the distributions of classification scores   tors as well. We observed the redundancy among many cor-
for human and bot accounts according to each dataset. The         related features, such as distribution-type features (cf. Ta-
mixture model trained on 2K annotated and 10K honeypot            ble 1), especially in the content and sentiment categories.
accounts is used to compute the scores. Human accounts            Further analysis of feature importance is the subject of on-
in both datasets have similar distributions, peaked around        going investigation.
0.1. The difference between bots in the two datasets is more
prominent. The distribution of simple, honeypot bots peaks        False Positive and False Negative Cases
around 0.9. The newer bots from the manually annotated            Neither human annotators nor machine-learning models per-
dataset have typically smaller scores, with a distribution        form flawlessly. Humans are better at generalizing and learn-
peaked around 0.6. They are more sophisticated, and ex-           ing new features from observed data. Machines outperform
hibit characteristics more similar to human behavior. This        human annotators at processing large numbers of relations
raises the issue of how to properly set a threshold on the        and searching for complex patterns. We analyzed our an-
score when a strictly binary classification between human         notated accounts and their bot scores to highlight when
and bots is needed. To infer a suitable threshold, we com-        disagreement occurs between annotators and classification
pute classification accuracies for varying thresholds consid-     models. Using an optimal threshold, we measured false pos-
ering all accounts scoring below each threshold as human,         itive and false negative rates at 0.15 and 0.11 respectively in
and then select the threshold that maximizes accuracy.            our extended dataset. In these experiments, human annota-
   We compared scores for accounts in the manually anno-          tion is considered as ground truth.
tated dataset by pairs of models (i.e. trained with different        We identified the cases when the disagreement between
mixtures) for labeled human, bot, and a random subset of          classifier score and annotations occurs. We manually exam-
accounts (Fig. 3). As expected, both models assign lower          ined a sample from these accounts to investigate these er-
scores for humans and higher for bots. High correlation co-       rors. Accounts annotated as human can be classified as bot
efficients indicate agreement between the models.                 when an account posts tweets created by connected appli-
                                                                  cations from other platforms. Some unusually active users
Feature Importance Analysis                                       are also classified as bots. Those users tend to have more
To compare the usefulness of different features, we trained       retweets in general. This is somewhat intuitive as retweet-
models using each class of features alone. We achieved the        ing has lower cost than creating new content. We encoun-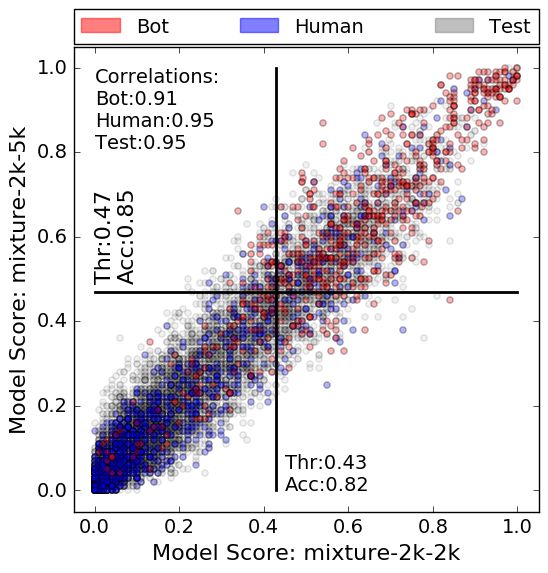
tered examples of misclassification for organizational and         their interactions through shared content. We also cluster
promotional accounts. Such accounts are often operated by          accounts and investigate shared properties of users in each
multiple individuals, or combinations of users and automatic       cluster. Here and in the remainder of this paper, bot scores
tools, generating misleading cues for the classifiers. Finally,    are computed with a model trained on the merged dataset.
the language of the content can also cause errors: our models
tend to assign high bot scores to users who tweet in multiple
languages. To mitigate this problem, the public version of
                                                                   Social connectivity
our system now includes a classifier that ignores language-        To characterize the social connectivity, we collected the so-
dependent features.                                                cial networks of the accounts in our dataset using the Twitter
                                                                   API. Resulting friend and follower relations account for 46
            Estimation of Bot Population                           billion social ties, 7 billion of which represent ties between
In a 2014 report by Twitter to the US Securities and Ex-           the initially collected user set.
change Commission, the company put forth an estimate that             Our observations on social connectivity are presented in
between 5% and 8.5% of their user base consists of bots.1          Fig. 5. We computed bot-score distributions of friends and
We would like to offer our own assessment of the propor-           followers of accounts for each score interval. The dark line
tion of bot accounts as measured with our approach. Since          in the top panel shows that human accounts (low score)
our framework provides a continuous bot score as opposed           mostly follow other human accounts. The dark line in the
to a discrete bot/human judgement, we must first determine         bottom panel shows a principal peak around 0.1 and a sec-
an appropriate bot-score threshold separating human and bot        ondary one around 0.5. This indicates that humans are typ-
accounts to estimate the proportion of bot accounts.               ically followed by other humans, but also by sophisticated
   To infer a suitable threshold, we computed classification       bots (intermediate scores). The lines corresponding to high
accuracies for varying thresholds considering all accounts         scores in the two panels show that bots tend to follow other
scoring below each threshold as human. We then selected the        bots and they are mostly followed by bots. However sim-
threshold yielding maximum accuracy (see insets of Fig. 4).        ple bots (0.8–1.0 ranges) can also attract human attention.
   We estimated the population of bots using different mod-        This happens when, e.g., humans follow benign bots such as
els. This approach allows us to identify lower and upper           those that share news. This gives rise to the secondary peak
bounds for the prevalence of Twitter bots. Models trained us-      of the red line in the bottom panel. In summary, the creation
ing the annotated dataset alone yield estimates of up to 15%       of social ties leads to a homophily effect.
of accounts being bots. Recall that the honeypot dataset was          Fig. 6 illustrates the extent to which connections are re-
obtained earlier and therefore does not include newer, more        ciprocated, given the nature of the accounts forming the ties.
sophisticated bots. Thus models trained on the honeypot data       The reciprocity score of a user is defined as the fraction of
alone are less sensitive to these sophisticated bots, yielding a   friends who are also followers. We observe that human ac-
more conservative estimate of 9%. Mixing the training data         counts reciprocate more (dark line). Increasing bot scores
from these two sources results in estimates between these          correlate with lower reciprocity. We also observe that sim-
bounds depending on the ratio of the mixture, as illustrated       ple bot accounts (0.8–1.0 ranges) have bimodal reciprocity
in Fig. 4. Taken together, these numbers suggest that esti-        distributions, indicating the existence of two distinct behav-
mates about the prevalence of Twitter bots are highly depen-       iors. The majority of high-score accounts have reciprocity
dent on the definition and sophistication of the bots.             score smaller than 0.2, possibly because simple bots follow
   Some other remarks are in order. First, we do not exclude       users at random. The slight increase as the reciprocity score
the possibility that very sophisticated bots can systemati-        approaches one may be due to botnet accounts that coordi-
cally escape a human annotator’s judgement. These complex          nate by following each other.
bots may be active on Twitter, and therefore present in our
datasets, and may have been incorrectly labeled as humans,
making even the 15% figure a conservative estimate. Sec-           Information flow
ond, increasing evidence suggests the presence on social me-
dia of hybrid human-bot accounts (sometimes referred to as         Twitter is a platform that fosters social connectivity and the
cyborgs) that perform automated actions with some human            broadcasting of popular content. In Fig. 7 we analyze infor-
supervision (Chu et al. 2012; Clark et al. 2016). Some have        mation flow in terms of mentions/retweets as a function of
been allegedly used for terrorist propaganda and recruitment       the score of the account being mentioned or retweeted.
purposes. It remains unclear how these accounts should be             Simple bots tend to retweet each other (lines for scores
labeled, and how pervasive they are.                               in the 0.8–1.0 ranges peak around 0.8 in the bottom panel),
                                                                   while they frequently mention sophisticated bots (peaking
      Characterization of User Interactions                        around 0.5 in the top panel). More sophisticated bots (scores
Let us next characterize social connectivity, information          in the 0.5–0.7 ranges) retweet, but do not mention humans.
flow, and shared properties of users. We analyze the cre-          They might be unable to engage in meaningful exchanges
ation of social ties by accounts with different bot scores, and    with humans. While humans also retweet bots, as they may
                                                                   post interesting content (see peaks of the dark lines in the
  1                                                                bottom panel), they have no interest in mentioning bots di-
    www.sec.gov/Archives/edgar/data/1418091/
000156459014003474/twtr-10q_20140630.htm                           rectly (dark lines in the top panel).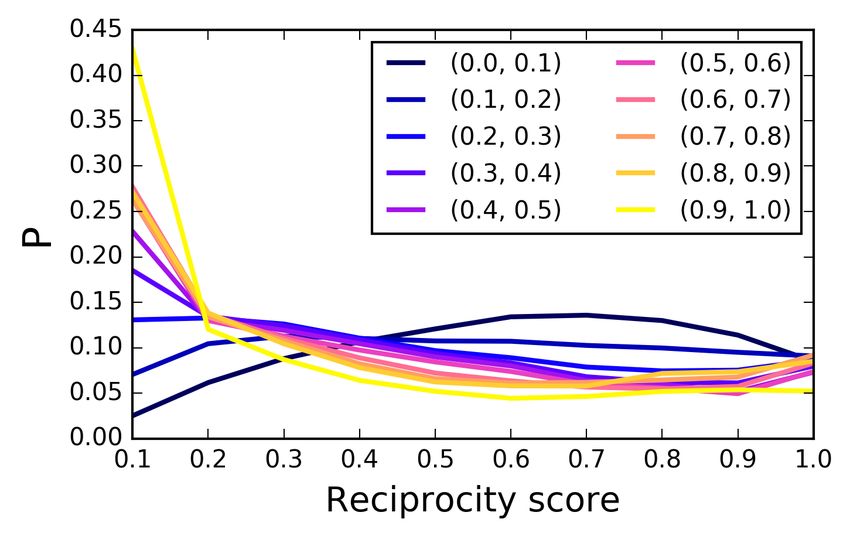
Figure 4: Estimation of bot population obtained from models with different sensitivity to sophisticated bots. The main charts
show the score distributions based on our dataset of 14M users; accounts identified as bots are highlighted. The inset plots show
how the thresholds are computed by maximizing accuracy. The titles of each subplot reflect the number of accounts from the
annotated and honeypot datasets, respectively.
Figure 5: Distributions of bot scores for friends (top) and Figure 7: Bot score distributions of users mentioned (top)
followers (bottom) of accounts in different score intervals. and retweeted (bottom) by accounts with different scores.
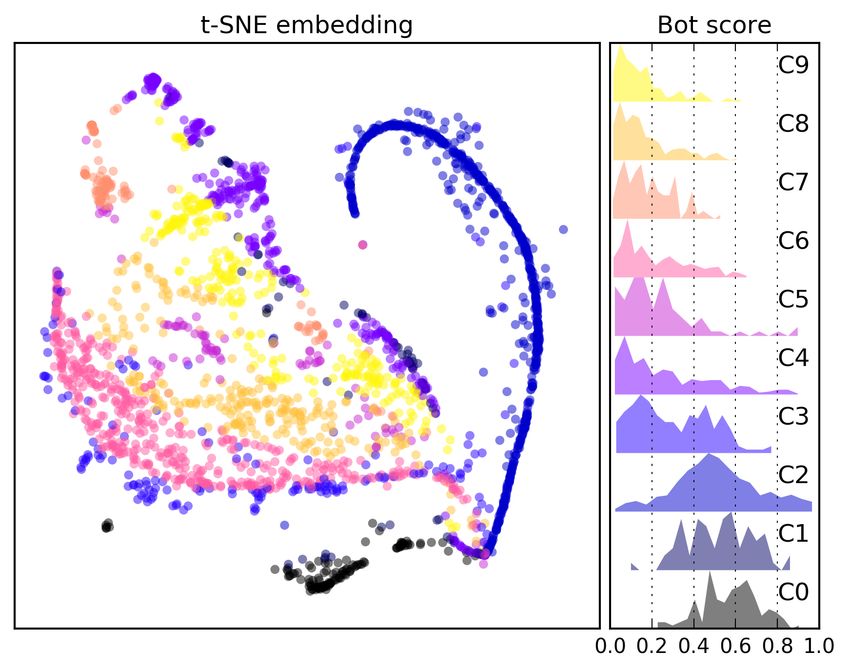
by our Random Forests model. We identify 10 distinct clus-
ters based on different evaluation criteria, such as silhouette
scores and percentage of variance explained. In Fig 8, we
present a 2-dimensional projection of users obtained by a di-
mensionality reduction technique called t-SNE (Maaten and
Hinton 2008). In this method, the similarity between users
is computed based on their 100-dimensional representation
in the feature space. Similar users are projected into nearby
points and dissimilar users are kept distant from each other.
Let us investigate shared cluster properties by manual in-
spection of random subsets of accounts from each cluster.
Figure 6: Distribution of reciprocity scores for accounts in
Three of the clusters, namely C0–C2, have high average bot
different score intervals.
scores. The presence of significant amounts of bot accounts
in these clusters was manually verified. These bot clusters
Clustering accounts exhibit some prominent properties: cluster C0, for exam-
ple, consists of legit-looking accounts that are promoting
To characterize different account types, let us group ac- themselves (recruiters, porn actresses, etc.). They are con-
counts into behavioral clusters. We apply K-Means to nor- centrated in the lower part of the 2-dimensional embedding,
malized vectors of the 100 most important features selected suggesting homogeneous patterns of behaviors. C1 containsimplying full access to all data. These studies focus on
collecting large-scale data to either cluster behavioral pat-
terns of users (Wang et al. 2013a) or classify accounts
using supervised learning techniques (Yang et al. 2014;
Lee, Eoff, and Caverlee 2011). For instance, Beutel et al. de-
composed event data in time, user, and activity dimensions
to extract similar behaviors (Beutel et al. 2013). These tech-
niques are useful to identify coordinated large-scale attacks
directed at a common set of targets at the same time, but
accounts with similar strategies might also target different
groups and operate separately from each other.
Structural connectivity may provide important cues. How-
ever, Yang et al. studied large-scale sybil attacks and ob-
served sophisticated sybils that develop strategies for build-
ing normal-looking social ties, making themselves harder to
detect (Yang et al. 2014). Some sybil attacks analyze the
social graph of targeted groups to infiltrate specific organi-
zations (Elyashar et al. 2013). SybilRank is a system devel-
Figure 8: t-SNE embedding of accounts. Points are colored oped to identify attacks from their underlying topology (Cao
based on clustering in high-dimensional space. For each et al. 2012). Alvisi et al. surveyed the evolution of sybil de-
cluster, the distribution of scores is presented on the right. fense protocols that leverage the structural properties of the
social graph (Alvisi et al. 2013).
The work presented here follows several previous contri-
spam accounts that are very active but have few followers. butions to the problem of social bot detection that leverage
Accounts in C2 frequently use automated applications to learning models trained with data collected from human and
share activity from other platforms like YouTube and Insta- bot accounts. Chu et al. built a classification system identify-
gram, or post links to news articles. Some of the accounts in ing accounts controlled by humans, bots, and cyborgs (Chu
C2 might belong to actual humans who are no longer active et al. 2010; Chu et al. 2012). Wang et al. analyzed sybil
and their posts are mostly sent by connected apps. attacks using annotations by experts and crowd-sourcing
Cluster C3 contain a mix of sophisticated bots, cyborg- workers to evaluate consistency and effectiveness of differ-
like accounts (mix of bot and human features), and human ent detection systems (Wang et al. 2013b). Clark et al. la-
users. Clusters of predominantly human accounts, namely beled 1,000 accounts by hand and found natural language
C4–C9, separate from one another in the embedding due to text features to be very effective at discriminating between
different activity styles, user popularity, content production human and automated accounts (Clark et al. 2016). Lee et
and consumption patterns. For instance, accounts in C7 en- al. used a honeypot approach to collect the largest sample
gage more with their friends, unlike accounts from C8 that of bot accounts available to date (Lee, Eoff, and Caverlee
mostly retweet with little other forms of interaction. Clusters 2011). That study generated the honeypot dataset used in the
C5, C6, and C9 contain common Twitter users who produce present paper. Here, we extend this body of prior work by
experiential tweets, share pictures, and retweet their friends. exploring many different categories of features, contribut-
ing a new labeled dataset, estimating the number of bot ac-
counts, analyzing information flow among accounts, iden-
Related Work tifying several classes of behaviors, and providing a public
Also known as “sybil” accounts, social bots can pollute on- bot detection service.
line discussion by lending false credibility to their messages An alternative approach to study social bots and sybil at-
and influence other users (Ferrara et al. 2016a; Aiello et tacks is to understand what makes certain groups and indi-
al. 2012). Recent studies quantify the extent to which au- viduals more appealing as targets. Wald et al. studied the
tomated systems can dominate discussions on Twitter about factors affecting the likelihood of a users being targeted by
topics ranging from electronic cigarettes (Clark et al. 2015) social bots (Wald et al. 2013). These approaches point to ef-
to elections (Bessi and Ferrara 2016). Large collections of fective strategies that future social bots might develop.
social bots, also known as botnets, are controlled by botmas- Recently, we have observed efforts to facilitate research
ters and used for coordinated activities. Examples of such collaborations on the topic of social bots. DARPA organized
botnets identified for advertisement (Echeverrı́a and Zhou a bot detection challenge in the domain of anti-vaccine cam-
2017) and influence about Syrian civic war (Abokhodair, paigns on Twitter (Subrahmanian et al. 2016). We released
Yoo, and McDonald 2015). Social bots also vary greatly our Twitter bot detection system online for public use (Davis
in terms of their behavior, intent, and vulnerabilities, as il- et al. 2016). Since its release, our system has received mil-
lustrated in a categorization scheme for bot attacks (Mitter, lions of requests and we are improving models based on
Wagner, and Strohmaier 2013). feedback we received from our users. The increasing avail-
Much of the previous work on detecting bots is from ability of software and datasets on social bots will help de-
the perspective of the social network platform operators, sign systems that are capable of co-evolving with recent so-cial bots and hopefully mitigating the effects of their mali- References
cious activities. [Abokhodair, Yoo, and McDonald 2015] Abokhodair, N.; Yoo, D.;
and McDonald, D. W. 2015. Dissecting a social botnet: Growth,
Conclusions content and influence in twitter. In Proc. of the 18th ACM Conf.
on Computer Supported Cooperative Work & Social Computing,
Social media make it easy for accounts controlled by hy-
839–851. ACM.
brid or automated approaches to create content and interact
with other accounts. Our project aims to identify these bots. [Agarwal et al. 2011] Agarwal, A.; Xie, B.; Vovsha, I.; Rambow,
O.; and Passonneau, R. 2011. Sentiment analysis of Twitter data.
Such a classification task could be a first step toward study-
In Proc. of the Workshop on Languages in Social Media, 30–38.
ing modes of communication among different classes of en- ACL.
tities on social media.
[Aiello et al. 2012] Aiello, L.; Deplano, M.; Schifanella, R.; and
In this article, we presented a framework for bot detec-
Ruffo, G. 2012. People are strange when you’re a stranger: Im-
tion on Twitter. We introduced our machine learning sys- pact and influence of bots on social networks. In Proc. 6th Intl.
tem that extracts more than a thousand features in six dif- AAAI Conf. on Weblogs & Soc. Media (ICWSM).
ferent classes: users and friends meta-data, tweet content
[Alvisi et al. 2013] Alvisi, L.; Clement, A.; Epasto, A.; Lattanzi, S.;
and sentiment, network patterns, and activity time series. We and Panconesi, A. 2013. Sok: The evolution of sybil defense via
evaluated our framework when initially trained on an avail- social networks. In Proc. IEEE Symposium on Security and Privacy
able dataset of bots. Our initial classifier achieves 0.95 AUC (SP), 382–396.
when evaluated by using 5-fold cross validation. Our analy- [Bakshy et al. 2011] Bakshy, E.; Hofman, J. M.; Mason, W. A.; and
sis on the contributions of different feature classes suggests Watts, D. J. 2011. Everyone’s an influencer: quantifying influence
that user meta-data and content features are the two most on Twitter. In Proc. 4th ACM Intl. Conf. on Web Search and Data
valuable sources of data to detect simple bots. Mining, 65–74.
To evaluate the performance of our classifier on a more re- [Berger and Morgan 2015] Berger, J., and Morgan, J. 2015. The
cent and challenging sample of bots, we randomly selected isis twitter census: Defining and describing the population of isis
Twitter accounts covering the whole spectrum of classifi- supporters on twitter. The Brookings Project on US Relations with
cation scores. The accuracy of our initial classifier trained the Islamic World 3:20.
on the honeypot dataset decreased to 0.85 AUC when tested [Bessi and Ferrara 2016] Bessi, A., and Ferrara, E. 2016. Social
on the more challenging dataset. By retraining the classifier bots distort the 2016 us presidential election online discussion.
with the two datasets merged, we achieved high accuracy First Monday 21(11).
(0.94 AUC) in detecting both simple and sophisticated bots. [Bessi et al. 2015] Bessi, A.; Coletto, M.; Davidescu, G. A.; Scala,
We also estimated the fraction of bots in the ac- A.; Caldarelli, G.; and Quattrociocchi, W. 2015. Science vs con-
tive English-speaking population on Twitter. We classified spiracy: Collective narratives in the age of misinformation. PLoS
nearly 14M accounts using our system and inferred the op- ONE 10(2):e0118093.
timal threshold scores that separate human and bot accounts [Beutel et al. 2013] Beutel, A.; Xu, W.; Guruswami, V.; Palow, C.;
for several models with different mixes of simple and so- and Faloutsos, C. 2013. Copycatch: stopping group attacks by
phisticated bots. Training data have an important effect on spotting lockstep behavior in social networks. In Prov. 22nd Intl.
classifier sensitivity. Our estimates for the bot population ACM Conf. World Wide Web (WWW), 119–130.
range between 9% and 15%. This points to the importance [Bollen, Mao, and Zeng 2011] Bollen, J.; Mao, H.; and Zeng, X.
of tracking increasingly sophisticated bots, since deception 2011. Twitter mood predicts the stock market. Journal of Com-
and detection technologies are in a never-ending arms race. putational Science 2(1):1–8.
To characterize user interactions, we studied social [Boshmaf et al. 2011] Boshmaf, Y.; Muslukhov, I.; Beznosov, K.;
connectivity and information flow between different user and Ripeanu, M. 2011. The socialbot network: when bots social-
groups. We showed that selection of friends and followers ize for fame and money. In Proc. 27th Annual Computer Security
are correlated with accounts bot-likelihood. We also high- Applications Conf.
lighted how bots use different retweet and mention strategies [Botta, Moat, and Preis 2015] Botta, F.; Moat, H. S.; and Preis, T.
when interacting with humans or other bots. 2015. Quantifying crowd size with mobile phone and twitter data.
We concluded our analysis by characterizing subclasses Royal Society open science 2(5):150162.
of account behaviors. Clusters identified by this analysis [Briscoe, Appling, and Hayes 2014] Briscoe, E.; Appling, S.; and
point mainly to three types of bots. These results emphasize Hayes, H. 2014. Cues to deception in social media communi-
that Twitter hosts a variety of users with diverse behaviors; cations. In Hawaii Intl. Conf. on Syst Sci.
this is true for both human and bot accounts. In some cases, [Cao et al. 2012] Cao, Q.; Sirivianos, M.; Yang, X.; and Pregueiro,
the boundary separating these two groups is not sharp and T. 2012. Aiding the detection of fake accounts in large scale so-
an account can exhibit characteristics of both. cial online services. In 9th USENIX Symp on Netw Sys Design &
Implement, 197–210.
Acknowledgments. We thank M. JafariAsbagh, P. Shiralkar [Chavoshi, Hamooni, and Mueen 2016] Chavoshi, N.; Hamooni,
for helpful discussions. We also want to thank undergraduate H.; and Mueen, A. 2016. Identifying correlated bots in twitter.
students A. Toms, A. Fulton, A. Witulski, and M. Johnston for In Social Informatics: 8th Intl. Conf., 14–21.
contributing data annotation. This work was supported in part [Chu et al. 2010] Chu, Z.; Gianvecchio, S.; Wang, H.; and Jajodia,
by ONR (N15A-020-0053), DARPA (W911NF-12-1-0037), NSF S. 2010. Who is tweeting on twitter: human, bot, or cyborg? In
(CCF-1101743), and the J.S. McDonnell Foundation. Proc. 26th annual computer security applications conf., 21–30.[Chu et al. 2012] Chu, Z.; Gianvecchio, S.; Wang, H.; and Jajodia, [Lee, Eoff, and Caverlee 2011] Lee, K.; Eoff, B. D.; and Caverlee, S. 2012. Detecting automation of twitter accounts: Are you a hu- J. 2011. Seven months with the devils: A long-term study of con- man, bot, or cyborg? IEEE Tran Dependable & Secure Comput tent polluters on twitter. In Proc. 5th AAAI Intl. Conf. on Web and 9(6):811–824. Social Media. [Clark et al. 2015] Clark, E.; Jones, C.; Williams, J.; Kurti, A.; Nor- [Letchford, Moat, and Preis 2015] Letchford, A.; Moat, H. S.; and totsky, M.; Danforth, C.; and Dodds, P. 2015. Vaporous marketing: Preis, T. 2015. The advantage of short paper titles. Royal Society Uncovering pervasive electronic cigarette advertisements on twit- Open Science 2(8):150266. ter. arXiv preprint arXiv:1508.01843. [Lokot and Diakopoulos 2016] Lokot, T., and Diakopoulos, N. [Clark et al. 2016] Clark, E.; Williams, J.; Jones, C.; Galbraith, R.; 2016. News bots: Automating news and information dissemina- Danforth, C.; and Dodds, P. 2016. Sifting robotic from organic text: tion on twitter. Digital Journalism 4(6):682–699. a natural language approach for detecting automation on twitter. [Maaten and Hinton 2008] Maaten, L. v. d., and Hinton, G. 2008. Journal of Computational Science 16:1–7. Visualizing data using t-sne. Journal of Machine Learning Re- [Danescu-Niculescu-Mizil et al. 2013] Danescu-Niculescu-Mizil, search 9(Nov):2579–2605. C.; West, R.; Jurafsky, D.; Leskovec, J.; and Potts, C. 2013. No [McAuley and Leskovec 2013] McAuley, J., and Leskovec, J. country for old members: user lifecycle and linguistic change in 2013. From amateurs to connoisseurs: modeling the evolution of online communities. In Proc. of the 22nd Intl. Conf. on World user expertise through online reviews. In Proc. 22nd Intl. ACM Wide Web, 307–318. Conf. World Wide Web, 897–908. [Das et al. 2016] Das, A.; Gollapudi, S.; Kiciman, E.; and Varol, [Mislove et al. 2011] Mislove, A.; Lehmann, S.; Ahn, Y.-Y.; On- O. 2016. Information dissemination in heterogeneous-intent net- nela, J.-P.; and Rosenquist, J. N. 2011. Understanding the de- works. In Proc. ACM Conf. on Web Science. mographics of Twitter users. In Proc. of the 5th Intl. AAAI Conf. [Davis et al. 2016] Davis, C. A.; Varol, O.; Ferrara, E.; Flammini, on Weblogs and Social Media. A.; and Menczer, F. 2016. BotOrNot: A system to evaluate social [Mitchell et al. 2013] Mitchell, L.; Harris, K. D.; Frank, M. R.; bots. In Proc. 25th Intl. Conf. Companion on World Wide Web, Dodds, P. S.; and Danforth, C. M. 2013. The geography of happi- 273–274. ness: Connecting Twitter sentiment and expression, demographics, [Echeverrı́a and Zhou 2017] Echeverrı́a, J., and Zhou, S. 2017. and objective characteristics of place. PLoS ONE 8(5):e64417. The ‘star wars’ botnet with ¿350k twitter bots. arXiv preprint [Mitter, Wagner, and Strohmaier 2013] Mitter, S.; Wagner, C.; and arXiv:1701.02405. Strohmaier, M. 2013. A categorization scheme for socialbot attacks [Elyashar et al. 2013] Elyashar, A.; Fire, M.; Kagan, D.; and in online social networks. In Proc. of the 3rd ACM Web Science Elovici, Y. 2013. Homing socialbots: intrusion on a specific or- Conference. ganization’s employee using socialbots. In Proc. IEEE/ACM Intl. [Mocanu et al. 2013] Mocanu, D.; Baronchelli, A.; Perra, N.; Conf. on Advances in Social Networks Analysis and Mining, 1358– Gonçalves, B.; Zhang, Q.; and Vespignani, A. 2013. The Twitter 1365. of Babel: Mapping world languages through microblogging plat- [Ferrara and Yang 2015] Ferrara, E., and Yang, Z. 2015. Quantify- forms. PLoS ONE 8(4):e61981. ing the effect of sentiment on information diffusion in social media. [Morstatter et al. 2013] Morstatter, F.; Pfeffer, J.; Liu, H.; and Car- PeerJ Comp. Sci. 1:e26. ley, K. 2013. Is the sample good enough? comparing data from [Ferrara et al. 2016a] Ferrara, E.; Varol, O.; Davis, C.; Menczer, F.; twitter’s streaming api with twitter’s firehose. In 7th Int Conf on and Flammini, A. 2016a. The rise of social bots. Comm. ACM Weblogs & Soc Med. 59(7):96–104. [Pedregosa et al. 2011] Pedregosa, F.; Varoquaux, G.; Gramfort, A.; [Ferrara et al. 2016b] Ferrara, E.; Varol, O.; Menczer, F.; and Flam- Michel, V.; Thirion, B.; Grisel, O.; et al. 2011. Scikit-learn: Ma- mini, A. 2016b. Detection of promoted social media campaigns. chine learning in Python. Journal of Machine Learning Research In Proc. Intl. AAAI Conference on Web and Social Media. 12:2825–2830. [Ferrara et al. 2016c] Ferrara, E.; Wang, W.-Q.; Varol, O.; Flam- [Ratkiewicz et al. 2011] Ratkiewicz, J.; Conover, M.; Meiss, M.; mini, A.; and Galstyan, A. 2016c. Predicting online extremism, Goncalves, B.; Flammini, A.; and Menczer, F. 2011. Detecting content adopters, and interaction reciprocity. In Social Informat- and tracking political abuse in social media. In 5th Int Conf on ics: 8th Intl. Conf., SocInfo 2016, Bellevue, WA, USA, 22–39. Weblogs & Soc Med, 297–304. [Ghosh, Surachawala, and Lerman 2011] Ghosh, R.; Surachawala, [Savage, Monroy-Hernandez, and Höllerer 2016] Savage, S.; T.; and Lerman, K. 2011. Entropy-based classification of retweet- Monroy-Hernandez, A.; and Höllerer, T. 2016. Botivist: Calling ing activity on twitter. In Proc. of KDD workshop on Social Net- volunteers to action using online bots. In Proceedings of the 19th work Analysis. ACM Conference on Computer-Supported Cooperative Work & [Gjoka et al. 2010] Gjoka, M.; Kurant, M.; Butts, C. T.; and Social Computing, 813–822. ACM. Markopoulou, A. 2010. Walking in facebook: A case study of [Subrahmanian et al. 2016] Subrahmanian, V.; Azaria, A.; Durst, unbiased sampling of osns. In Proc. IEEE INFOCOM, 1–9. S.; Kagan, V.; Galstyan, A.; Lerman, K.; Zhu, L.; Ferrara, E.; Flam- [Haustein et al. 2016] Haustein, S.; Bowman, T. D.; Holmberg, K.; mini, A.; Menczer, F.; et al. 2016. The DARPA Twitter Bot Chal- Tsou, A.; Sugimoto, C. R.; and Larivière, V. 2016. Tweets as lenge. IEEE Computer 6(49):38–46. impact indicators: Examining the implications of automated “bot” [Wald et al. 2013] Wald, R.; Khoshgoftaar, T. M.; Napolitano, A.; accounts on twitter. Journal of the Association for Information and Sumner, C. 2013. Predicting susceptibility to social bots on Science and Technology 67(1):232–238. twitter. In Proc. 14th Intl. IEEE Conf. on Information Reuse and [Kloumann et al. 2012] Kloumann, I. M.; Danforth, C. M.; Harris, Integration, 6–13. K. D.; Bliss, C. A.; and Dodds, P. S. 2012. Positivity of the english [Wang et al. 2013a] Wang, G.; Konolige, T.; Wilson, C.; Wang, X.; language. PLoS ONE 7(1):e29484. Zheng, H.; and Zhao, B. Y. 2013a. You are how you click: Click-
stream analysis for sybil detection. In Proc. USENIX Security, 1–
 15. Citeseer.
[Wang et al. 2013b] Wang, G.; Mohanlal, M.; Wilson, C.; Wang,
 X.; Metzger, M.; Zheng, H.; and Zhao, B. Y. 2013b. Social turing
 tests: Crowdsourcing sybil detection. In Proc. of the 20th Network
 & Distributed System Security Symposium (NDSS).
[Warriner, Kuperman, and Brysbaert 2013] Warriner, A. B.; Kuper-
 man, V.; and Brysbaert, M. 2013. Norms of valence, arousal, and
 dominance for 13,915 english lemmas. Behavior research methods
 1–17.
[Wilson, Wiebe, and Hoffmann 2005] Wilson, T.; Wiebe, J.; and
 Hoffmann, P. 2005. Recognizing contextual polarity in phrase-
 level sentiment analysis. In ACL Conf on Human Language Techn
 & Empirical Methods in NLP, 347–354.
[Yang et al. 2014] Yang, Z.; Wilson, C.; Wang, X.; Gao, T.; Zhao,
 B. Y.; and Dai, Y. 2014. Uncovering social network sybils in the
 wild. ACM Trans. Knowledge Discovery from Data 8(1):2.
You can also read