Optimal Cluster and GPU Utilization with Run AI - Product ...
←
→
Page content transcription
If your browser does not render page correctly, please read the page content below
Optimal Cluster and GPU Utilization with
Run AI
NetApp Solutions
NetApp
June 17, 2022

This PDF was generated from https://docs.netapp.com/us-en/netapp-
solutions/ai/osrunai_run_ai_installation.html on June 17, 2022. Always check docs.netapp.com for the
latest.
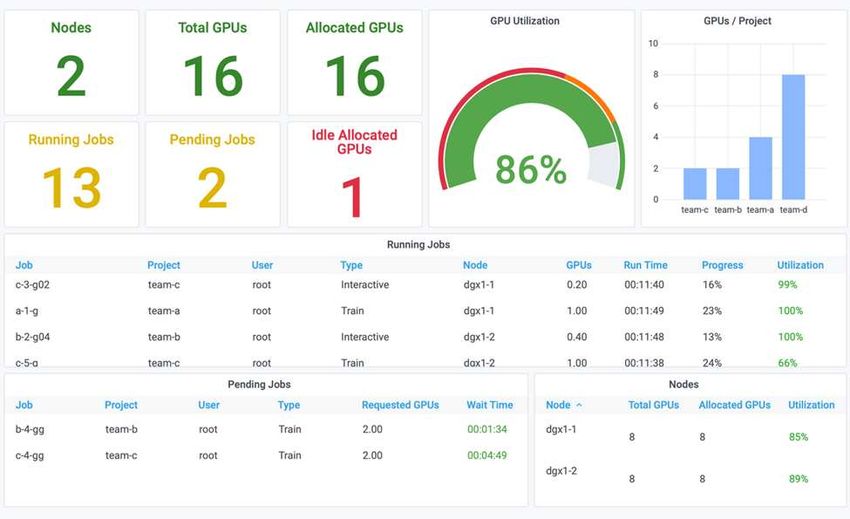
Table of Contents
Optimal Cluster and GPU Utilization with Run:AI. . . . . . . . . . . . . . . . . . . . . . . . . . . . . . . . . . . . . . . . . . . . . . . . . 1
  Run:AI Installation . . . . . . . . . . . . . . . . . . . . . . . . . . . . . . . . . . . . . . . . . . . . . . . . . . . . . . . . . . . . . . . . . . . . . . 1
  Run:AI Dashboards and Views . . . . . . . . . . . . . . . . . . . . . . . . . . . . . . . . . . . . . . . . . . . . . . . . . . . . . . . . . . . . 1
  Creating Projects for Data Science Teams and Allocating GPUs . . . . . . . . . . . . . . . . . . . . . . . . . . . . . . . . . . 2
  Submitting Jobs in Run:AI CLI . . . . . . . . . . . . . . . . . . . . . . . . . . . . . . . . . . . . . . . . . . . . . . . . . . . . . . . . . . . . . 3
  Achieving High Cluster Utilization . . . . . . . . . . . . . . . . . . . . . . . . . . . . . . . . . . . . . . . . . . . . . . . . . . . . . . . . . . 6
  Fractional GPU Allocation for Less Demanding or Interactive Workloads . . . . . . . . . . . . . . . . . . . . . . . . . . . . 7
  Achieving High Cluster Utilization with Over-Quota GPU Allocation . . . . . . . . . . . . . . . . . . . . . . . . . . . . . . . . 8
  Basic Resource Allocation Fairness. . . . . . . . . . . . . . . . . . . . . . . . . . . . . . . . . . . . . . . . . . . . . . . . . . . . . . . . . 9
  Over-Quota Fairness . . . . . . . . . . . . . . . . . . . . . . . . . . . . . . . . . . . . . . . . . . . . . . . . . . . . . . . . . . . . . . . . . . . 10
  Saving Data to a Trident-Provisioned PersistentVolume . . . . . . . . . . . . . . . . . . . . . . . . . . . . . . . . . . . . . . . . 12
Optimal Cluster and GPU Utilization with Run:AI
The following sections provide details on the Run:AI installation, test scenarios, and results performed in this
validation.

We validated the operation and performance of this system by using industry standard benchmark tools,
including TensorFlow benchmarks. The ImageNet dataset was used to train ResNet-50, which is a famous
Convolutional Neural Network (CNN) DL model for image classification. ResNet-50 delivers an accurate
training result with a faster processing time, which enabled us to drive a sufficient demand on the storage.

Next: Run AI Installation.

Run:AI Installation
To install Run:AI, complete the following steps:

 1. Install the Kubernetes cluster using DeepOps and configure the NetApp default storage class.
 2. Prepare GPU nodes:
     a. Verify that NVIDIA drivers are installed on GPU nodes.
     b. Verify that nvidia-docker is installed and configured as the default docker runtime.
 3. Install Run:AI:
     a. Log into the Run:AI Admin UI to create the cluster.
     b. Download the created runai-operator-.yaml file.
     c. Apply the operator configuration to the Kubernetes cluster.

           kubectl apply -f runai-operator-.yaml

 4. Verify the installation:
     a. Go to https://app.run.ai/.
     b. Go to the Overview dashboard.
     c. Verify that the number of GPUs on the top right reflects the expected number of GPUs and the GPU
        nodes are all in the list of servers.For more information about Run:AI deployment, see installing Run:AI
        on an on-premise Kubernetes cluster and installing the Run:AI CLI.

Next: Run AI Dashboards and Views

Run:AI Dashboards and Views
After installing Run:AI on your Kubernetes cluster and configuring the containers correctly, you see the
following dashboards and views on https://app.run.ai in your browser, as shown in the following figure.

                                                                                                                   1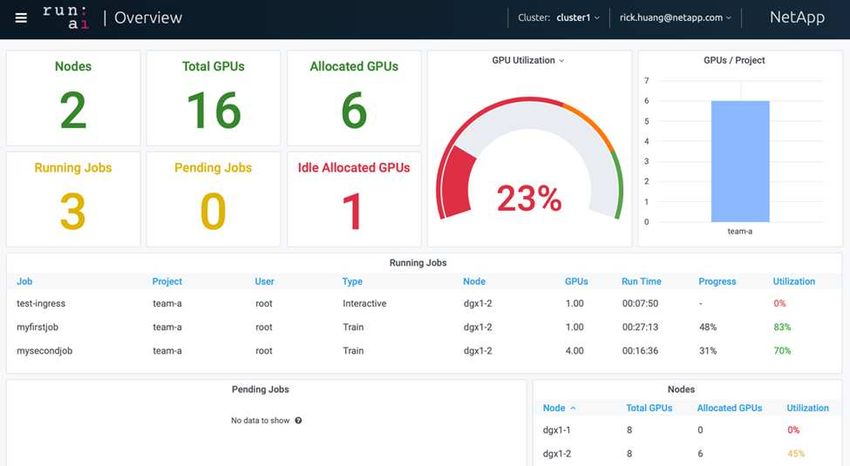
There are 16 total GPUs in the cluster provided by two DGX-1 nodes. You can see the number of nodes, the
total available GPUs, the allocated GPUs that are assigned with workloads, the total number of running jobs,
pending jobs, and idle allocated GPUs. On the right side, the bar diagram shows GPUs per Project, which
summarizes how different teams are using the cluster resource. In the middle is the list of currently running
jobs with job details, including job name, project, user, job type, the node each job is running on, the number of
GPU(s) allocated for that job, the current run time of the job, job progress in percentage, and the GPU
utilization for that job. Note that the cluster is under-utilized (GPU utilization at 23%) because there are only
three running jobs submitted by a single team (team-a).

In the following section, we show how to create multiple teams in the Projects tab and allocate GPUs for each
team to maximize cluster usage and manage resources when there are many users per cluster. The test
scenarios mimic enterprise environments in which memory and GPU resources are shared among training,
inferencing, and interactive workloads.

Next: Creating Projects for Data Science Teams and Allocating GPUs

Creating Projects for Data Science Teams and Allocating
GPUs
Researchers can submit workloads through the Run:AI CLI, Kubeflow, or similar processes. To streamline
resource allocation and create prioritization, Run:AI introduces the concept of Projects. Projects are quota
entities that associate a project name with GPU allocation and preferences. It is a simple and convenient way
to manage multiple data science teams.

A researcher submitting a workload must associate a project with a workload request. The Run:AI scheduler
compares the request against the current allocations and the project and determines whether the workload can
be allocated resources or whether it should remain in a pending state.

As a system administrator, you can set the following parameters in the Run:AI Projects tab:

2
• Model projects. Set a project per user, set a project per team of users, and set a project per a real
organizational project.
• Project quotas. Each project is associated with a quota of GPUs that can be allocated for this project at
the same time. This is a guaranteed quota in the sense that researchers using this project are guaranteed
to get this number of GPUs no matter what the status in the cluster is. As a rule, the sum of the project
allocation should be equal to the number of GPUs in the cluster. Beyond that, a user of this project can
receive an over-quota. As long as GPUs are unused, a researcher using this project can get more GPUs.
We demonstrate over-quota testing scenarios and fairness considerations in Achieving High Cluster
Utilization with Over-Quota GPU Allocation, Basic Resource Allocation Fairness, and Over-Quota Fairness.
• Create a new project, update an existing project, and delete an existing project.
• Limit jobs to run on specific node groups. You can assign specific projects to run only on specific
nodes. This is useful when the project team needs specialized hardware, for example, with enough
memory. Alternatively, a project team might be the owner of specific hardware that was acquired with a
specialized budget, or when you might need to direct build or interactive workloads to work on weaker
hardware and direct longer training or unattended workloads to faster nodes. For commands to group
nodes and set affinity for a specific project, see the Run:AI Documentation.
• Limit the duration of interactive jobs. Researchers frequently forget to close interactive jobs. This might
lead to a waste of resources. Some organizations prefer to limit the duration of interactive jobs and close
them automatically.
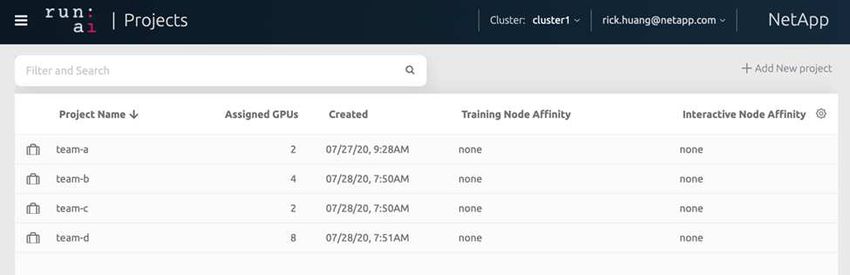
The following figure shows the Projects view with four teams created. Each team is assigned a different
number of GPUs to account for different workloads, with the total number of GPUs equal to that of the total
available GPUs in a cluster consisting of two DGX-1s.
Next: Submitting Jobs in Run AI CLI
Submitting Jobs in Run:AI CLI
This section provides the detail on basic Run:AI commands that you can use to run any Kubernetes job. It is
divided into three parts according to workload type. AI/ML/DL workloads can be divided into two generic types:
• Unattended training sessions. With these types of workloads, the data scientist prepares a self-running
workload and sends it for execution. During the execution, the customer can examine the results. This type
of workload is often used in production or when model development is at a stage where no human
intervention is required.
• Interactive build sessions. With these types of workloads, the data scientist opens an interactive session
with Bash, Jupyter Notebook, remote PyCharm, or similar IDEs and accesses GPU resources directly. We
include a third scenario for running interactive workloads with connected ports to reveal an internal port to
3the container user..
Unattended Training Workloads
After setting up projects and allocating GPU(s), you can run any Kubernetes workload using the following
command at the command line:
$ runai project set team-a runai submit hyper1 -i gcr.io/run-ai-
demo/quickstart -g 1
This command starts an unattended training job for team-a with an allocation of a single GPU. The job is based
on a sample docker image, gcr.io/run-ai-demo/quickstart. We named the job hyper1. You can then
monitor the job’s progress by running the following command:
$ runai list
The following figure shows the result of the runai list command. Typical statuses you might see include
the following:
• ContainerCreating. The docker container is being downloaded from the cloud repository.
• Pending. The job is waiting to be scheduled.
• Running. The job is running.
To get an additional status on your job, run the following command:
$ runai get hyper1
To view the logs of the job, run the runai logs command:
$ runai logs hyper1
In this example, you should see the log of a running DL session, including the current training epoch, ETA, loss
function value, accuracy, and time elapsed for each step.
You can view the cluster status on the Run:AI UI at https://app.run.ai/. Under Dashboards > Overview, you can
monitor GPU utilization.
To stop this workload, run the following command:
4$ runai delte hyper1
This command stops the training workload. You can verify this action by running runai list again. For more
detail, see launching unattended training workloads.
Interactive Build Workloads
After setting up projects and allocating GPU(s) you can run an interactive build workload using the following
command at the command line:
$ runai submit build1 -i python -g 1 --interactive --command sleep --args
infinity
The job is based on a sample docker image python. We named the job build1.
The -- interactive flag means that the job does not have a start or end. It is the
researcher’s responsibility to close the job. The administrator can define a time limit for
interactive jobs after which they are terminated by the system.
The --g 1 flag allocates a single GPU to this job. The command and argument provided is --command
sleep — args infinity. You must provide a command, or the container starts and then exits immediately.
The following commands work similarly to the commands described in Unattended Training Workloads:
• runai list: Shows the name, status, age, node, image, project, user, and GPUs for jobs.
• runai get build1: Displays additional status on the job build1.
• runai delete build1: Stops the interactive workload build1.To get a bash shell to the container, the
following command:
$ runai bash build1
This provides a direct shell into the computer. Data scientists can then develop or finetune their models within
the container.
You can view the cluster status on the Run:AI UI at https://app.run.ai. For more detail, see starting and using
interactive build workloads.
Interactive Workloads with Connected Ports
As an extension of interactive build workloads, you can reveal internal ports to the container user when starting
a container with the Run:AI CLI. This is useful for cloud environments, working with Jupyter Notebooks, or
connecting to other microservices. Ingress allows access to Kubernetes services from outside the Kubernetes
cluster. You can configure access by creating a collection of rules that define which inbound connections reach
which services.
For better management of external access to the services in a cluster, we suggest that cluster administrators
install Ingress and configure LoadBalancer.
5To use Ingress as a service type, run the following command to set the method type and the ports when
submitting your workload:
$ runai submit test-ingress -i jupyter/base-notebook -g 1 \
--interactive --service-type=ingress --port 8888 \
--args="--NotebookApp.base_url=test-ingress" --command=start-notebook.sh
After the container starts successfully, execute runai list to see the SERVICE URL(S) with which to
access the Jupyter Notebook. The URL is composed of the ingress endpoint, the job name, and the port. For
example, see https://10.255.174.13/test-ingress-8888.
For more details, see launching an interactive build workload with connected ports.
Next: Achieving High Cluster Utilization
Achieving High Cluster Utilization
In this section, we emulate a realistic scenario in which four data science teams each submit their own
workloads to demonstrate the Run:AI orchestration solution that achieves high cluster utilization while
maintaining prioritization and balancing GPU resources. We start by using the ResNet-50 benchmark
described in the section ResNet-50 with ImageNet Dataset Benchmark Summary:
$ runai submit netapp1 -i netapp/tensorflow-tf1-py3:20.01.0 --local-image
--large-shm -v /mnt:/mnt -v /tmp:/tmp --command python --args
"/netapp/scripts/run.py" --args "--
dataset_dir=/mnt/mount_0/dataset/imagenet/imagenet_original/" --args "--
num_mounts=2" --args "--dgx_version=dgx1" --args "--num_devices=1" -g 1
We ran the same ResNet-50 benchmark as in NVA-1121. We used the flag --local-image for containers
not residing in the public docker repository. We mounted the directories /mnt and /tmp on the host DGX-1
node to /mnt and /tmp to the container, respectively. The dataset is at NetApp AFFA800 with the
dataset_dir argument pointing to the directory. Both --num_devices=1 and -g 1 mean that we allocate
one GPU for this job. The former is an argument for the run.py script, while the latter is a flag for the runai
submit command.
The following figure shows a system overview dashboard with 97% GPU utilization and all sixteen available
GPUs allocated. You can easily see how many GPUs are allocated for each team in the GPUs/Project bar
chart. The Running Jobs pane shows the current running job names, project, user, type, node, GPUs
consumed, run time, progress, and utilization details. A list of workloads in queue with their wait time is shown
in Pending Jobs. Finally, the Nodes box offers GPU numbers and utilization for individual DGX-1 nodes in the
cluster.
6Next: Fractional GPU Allocation for Less Demanding or Interactive Workloads
Fractional GPU Allocation for Less Demanding or
Interactive Workloads
When researchers and developers are working on their models, whether in the development, hyperparameter
tuning, or debugging stages, such workloads usually require fewer computational resources. It is therefore
more efficient to provision fractional GPU and memory such that the same GPU can simultaneously be
allocated to other workloads. Run:AI’s orchestration solution provides a fractional GPU sharing system for
containerized workloads on Kubernetes. The system supports workloads running CUDA programs and is
especially suited for lightweight AI tasks such as inference and model building. The fractional GPU system
transparently gives data science and AI engineering teams the ability to run multiple workloads simultaneously
on a single GPU. This enables companies to run more workloads, such as computer vision, voice recognition,
and natural language processing on the same hardware, thus lowering costs.
Run:AI’s fractional GPU system effectively creates virtualized logical GPUs with their own memory and
computing space that containers can use and access as if they were self-contained processors. This enables
several workloads to run in containers side-by-side on the same GPU without interfering with each other. The
solution is transparent, simple, and portable and it requires no changes to the containers themselves.
A typical usecase could see two to eight jobs running on the same GPU, meaning that you could do eight times
the work with the same hardware.
For the job frac05 belonging to project team-d in the following figure, we can see that the number of GPUs
allocated was 0.50. This is further verified by the nvidia-smi command, which shows that the GPU memory
available to the container was 16,255MB: half of the 32GB per V100 GPU in the DGX-1 node.
7Next: Achieving High Cluster Utilization with Over-Quota GPU Allocation
Achieving High Cluster Utilization with Over-Quota GPU
Allocation
In this section and in the sections Basic Resource Allocation Fairness, and Over-Quota Fairness, we have
devised advanced testing scenarios to demonstrate the Run:AI orchestration capabilities for complex workload
management, automatic preemptive scheduling, and over-quota GPU provisioning. We did this to achieve high
cluster-resource usage and optimize enterprise-level data science team productivity in an ONTAP AI
environment.
For these three sections, set the following projects and quotas:
Project Quota
team-a 4
team-b 2
team-c 2
team-d 8
In addition, we use the following containers for these three sections:
• Jupyter Notebook: jupyter/base-notebook
• Run:AI quickstart: gcr.io/run-ai-demo/quickstart
8We set the following goals for this test scenario:
• Show the simplicity of resource provisioning and how resources are abstracted from users
• Show how users can easily provision fractions of a GPU and integer number of GPUs
• Show how the system eliminates compute bottlenecks by allowing teams or users to go over their resource
quota if there are free GPUs in the cluster
• Show how data pipeline bottlenecks are eliminated by using the NetApp solution when running compute-
intensive jobs, such as the NetApp container
• Show how multiple types of containers are running using the system
◦ Jupyter Notebook
◦ Run:AI container
• Show high utilization when the cluster is full
For details on the actual command sequence executed during the testing, see Testing Details for Section 4.8.
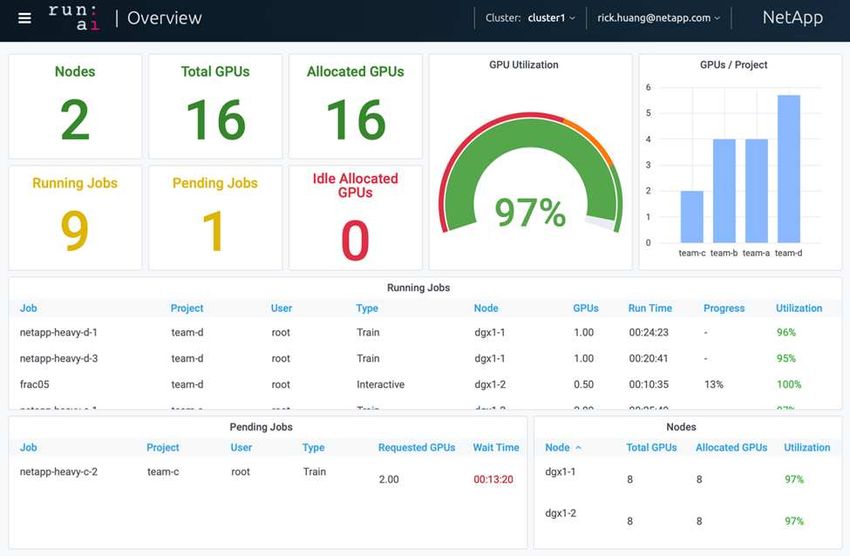
When all 13 workloads are submitted, you can see a list of container names and GPUs allocated, as shown in
the following figure. We have seven training and six interactive jobs, simulating four data science teams, each
with their own models running or in development. For interactive jobs, individual developers are using Jupyter
Notebooks to write or debug their code. Thus, it is suitable to provision GPU fractions without using too many
cluster resources.
The results of this testing scenario show the following:
• The cluster should be full: 16/16 GPUs are used.
• High cluster utilization.
• More experiments than GPUs due to fractional allocation.
• team-d is not using all their quota; therefore, team-b and team-c can use additional GPUs for their
experiments, leading to faster time to innovation.
Next: Basic Resource Allocation Fairness
Basic Resource Allocation Fairness
In this section, we show that, when team-d asks for more GPUs (they are under their quota), the system
pauses the workloads of team-b and team-c and moves them into a pending state in a fair-share manner.
For details including job submissions, container images used, and command sequences executed, see the
section Testing Details for Section 4.9.
9The following figure shows the resulting cluster utilization, GPUs allocated per team, and pending jobs due to
automatic load balancing and preemptive scheduling. We can observe that when the total number of GPUs
requested by all team workloads exceeds the total available GPUs in the cluster, Run:AI’s internal fairness
algorithm pauses one job each for team-b and team-c because they have met their project quota. This
provides overall high cluster utilization while data science teams still work under resource constraints set by an
administrator.
The results of this testing scenario demonstrate the following:
• Automatic load balancing. The system automatically balances the quota of the GPUs, such that each
team is now using their quota. The workloads that were paused belong to teams that were over their quota.
• Fair share pause. The system chooses to stop the workload of one team that was over their quota and
then stop the workload of the other team. Run:AI has internal fairness algorithms.
Next: Over-Quota Fairness
Over-Quota Fairness
In this section, we expand the scenario in which multiple teams submit workloads and exceed their quota. In
this way, we demonstrate how Run:AI’s fairness algorithm allocates cluster resources according to the ratio of
preset quotas.
Goals for this test scenario:
• Show queuing mechanism when multiple teams are requesting GPUs over their quota.
• Show how the system distributes a fair share of the cluster between multiple teams that are over their
quota according to the ratio between their quotas, so that the team with the larger quota gets a larger share
of the spare capacity.
10At the end of Basic Resource Allocation Fairness, there are two workloads queued: one for team-b and one
for team-c. In this section, we queue additional workloads.
For details including job submissions, container images used, and command sequences executed, see Testing
Details for section 4.10.
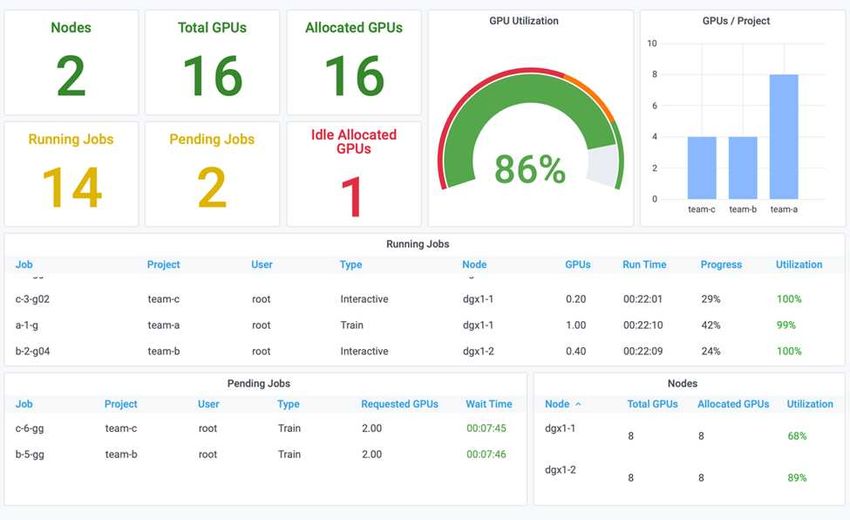
When all jobs are submitted according to the section Testing Details for section 4.10, the system dashboard
shows that team-a, team-b, and team-c all have more GPUs than their preset quota. team-a occupies four
more GPUs than its preset soft quota (four), whereas team-b and team-c each occupy two more GPUs than
their soft quota (two). The ratio of over-quota GPUs allocated is equal to that of their preset quota. This is
because the system used the preset quota as a reference of priority and provisioned accordingly when multiple
teams request more GPUs, exceeding their quota. Such automatic load balancing provides fairness and
prioritization when enterprise data science teams are actively engaged in AI model development and
production.
The results of this testing scenario show the following:
• The system starts to de-queue the workloads of other teams.
• The order of the dequeuing is decided according to fairness algorithms, such that team-b and team-c get
the same amount of over-quota GPUs (since they have a similar quota), and team-a gets a double
amount of GPUs since their quota is two times higher than the quota of team-b and team-c.
• All the allocation is done automatically.
Therefore, the system should stabilize on the following states:
11Project GPUs allocated Comment
team-a 8/4 Four GPUs over the quota. Empty
queue.
team-b 4/2 Two GPUs over the quota. One
workload queued.
team-c 4/2 Two GPUs over the quota. One
workload queued.
team-d 0/8 Not using GPUs at all, no queued
workloads.
The following figure shows the GPU allocation per project over time in the Run:AI Analytics dashboard for the
sections Achieving High Cluster Utilization with Over-Quota GPU Allocation, Basic Resource Allocation
Fairness, and Over-Quota Fairness. Each line in the figure indicates the number of GPUs provisioned for a
given data science team at any time. We can see that the system dynamically allocates GPUs according to
workloads submitted. This allows teams to go over quota when there are available GPUs in the cluster, and
then preempt jobs according to fairness, before finally reaching a stable state for all four teams.
Next: Saving Data to a Trident-Provisioned PersistentVolume
Saving Data to a Trident-Provisioned PersistentVolume
NetApp Trident is a fully supported open source project designed to help you meet the sophisticated
persistence demands of your containerized applications. You can read and write data to a Trident-provisioned
Kubernetes PersistentVolume (PV) with the added benefit of data tiering, encryption, NetApp Snapshot
technology, compliance, and high performance offered by NetApp ONTAP data management software.
12Reusing PVCs in an Existing Namespace
For larger AI projects, it might be more efficient for different containers to read and write data to the same
Kubernetes PV. To reuse a Kubernetes Persistent Volume Claim (PVC), the user must have already created a
PVC. See the NetApp Trident documentation for details on creating a PVC. Here is an example of reusing an
existing PVC:
$ runai submit pvc-test -p team-a --pvc test:/tmp/pvc1mount -i gcr.io/run-
ai-demo/quickstart -g 1
Run the following command to see the status of job pvc-test for project team-a:
$ runai get pvc-test -p team-a
You should see the PV /tmp/pvc1mount mounted to team-a job pvc-test. In this way, multiple containers
can read from the same volume, which is useful when there are multiple competing models in development or
in production. Data scientists can build an ensemble of models and then combine prediction results by majority
voting or other techniques.
Use the following to access the container shell:
$ runai bash pvc-test -p team-a
You can then check the mounted volume and access your data within the container.
This capability of reusing PVCs works with NetApp FlexVol volumes and NetApp ONTAP FlexGroup volumes,
enabling data engineers more flexible and robust data management options to leverage your data fabric
powered by NetApp.
Next: Conclusion
13Copyright Information Copyright © 2022 NetApp, Inc. All rights reserved. Printed in the U.S. No part of this document covered by copyright may be reproduced in any form or by any means-graphic, electronic, or mechanical, including photocopying, recording, taping, or storage in an electronic retrieval system- without prior written permission of the copyright owner. Software derived from copyrighted NetApp material is subject to the following license and disclaimer: THIS SOFTWARE IS PROVIDED BY NETAPP “AS IS” AND WITHOUT ANY EXPRESS OR IMPLIED WARRANTIES, INCLUDING, BUT NOT LIMITED TO, THE IMPLIED WARRANTIES OF MERCHANTABILITY AND FITNESS FOR A PARTICULAR PURPOSE, WHICH ARE HEREBY DISCLAIMED. IN NO EVENT SHALL NETAPP BE LIABLE FOR ANY DIRECT, INDIRECT, INCIDENTAL, SPECIAL, EXEMPLARY, OR CONSEQUENTIAL DAMAGES (INCLUDING, BUT NOT LIMITED TO, PROCUREMENT OF SUBSTITUTE GOODS OR SERVICES; LOSS OF USE, DATA, OR PROFITS; OR BUSINESS INTERRUPTION) HOWEVER CAUSED AND ON ANY THEORY OF LIABILITY, WHETHER IN CONTRACT, STRICT LIABILITY, OR TORT (INCLUDING NEGLIGENCE OR OTHERWISE) ARISING IN ANY WAY OUT OF THE USE OF THIS SOFTWARE, EVEN IF ADVISED OF THE POSSIBILITY OF SUCH DAMAGE. NetApp reserves the right to change any products described herein at any time, and without notice. NetApp assumes no responsibility or liability arising from the use of products described herein, except as expressly agreed to in writing by NetApp. The use or purchase of this product does not convey a license under any patent rights, trademark rights, or any other intellectual property rights of NetApp. The product described in this manual may be protected by one or more U.S. patents, foreign patents, or pending applications. RESTRICTED RIGHTS LEGEND: Use, duplication, or disclosure by the government is subject to restrictions as set forth in subparagraph (c)(1)(ii) of the Rights in Technical Data and Computer Software clause at DFARS 252.277-7103 (October 1988) and FAR 52-227-19 (June 1987). Trademark Information NETAPP, the NETAPP logo, and the marks listed at http://www.netapp.com/TM are trademarks of NetApp, Inc. Other company and product names may be trademarks of their respective owners. 14
You can also read