Optometric Education: Volume 46
 Number 2 (Winter-Spring 2021)
←
→
Page content transcription
If your browser does not render page correctly, please read the page content below
Optometric Education: Volume 46 Number 2 (Winter-Spring 2021)
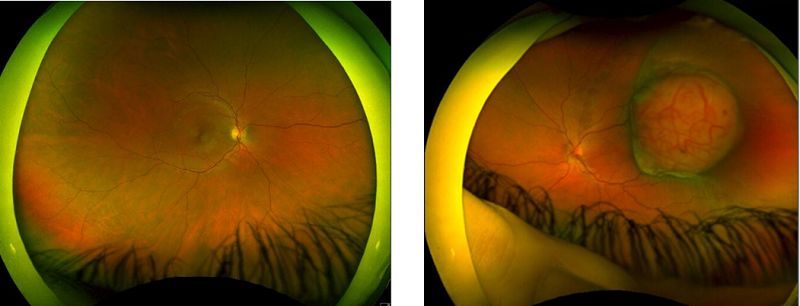
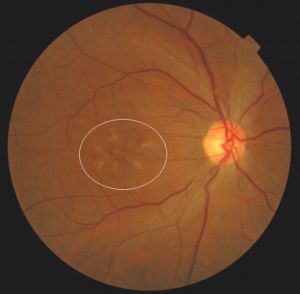
Table of Contents
Call for Papers for Theme Edition:/br Diversity and Cultural Competence in Optometry ........................................................... 1
Butterfly-Shaped Pattern Dystrophy:bran Observational Teaching Case Report ......................................................................... 2
Sleep Irregularity and Academic Performance ............................................................................................................................. 8
Assessment of the Utility of 3D-Printed Interactive Models in the Vision Science Classroom ................................................... 13
Student Perceptions of Cultural Competency ............................................................................................................................. 19
Student Satisfaction with an Objective Structured Clinical Examination in Optometry ............................................................ 27
Unforeseen Outcomes of Remote Learning ................................................................................................................................ 33
Does Self-Regulated Test Duration Correlate with Vision Science Test Score in First-Year Optometry Students? .................. 35
Amelanotic Choroidal Melanoma:bra Teaching Case Report ..................................................................................................... 40
Industry News ............................................................................................................................................................................. 46
Faculty Development to Improve Teaching Skills of Optometric Educators:brExperiences of a Healthcare Organization ...... 47
Call for Papers for Theme Edition: Diversity and Cultural
Competence in Optometry
| Optometric Education: Volume 46 Number 2 (Winter-Spring 2021)

                                                        PDF of Article

The population continues to become more diverse, and optometry must be able to meet the cultural, ethnic, racial, gender and
linguistic needs of patients.

Optometric Education is inviting authors to submit scholarly papers addressing related themes such as diversity, cultural
competency, gender issues and cultural awareness.

The deadline to submit papers for this theme edition is Sept. 1, 2021

For more information, e-mail journal Associate Editor Keshia S. Elder, OD, MS, FAAO, or journal Editor Aurora Denial, OD,
FAAO, DipOE.

                                                                                                                               1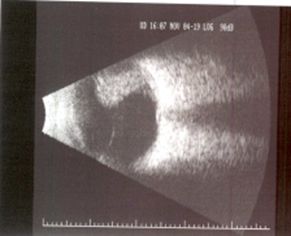
Butterfly-Shaped Pattern Dystrophy:
an Observational Teaching Case Report
Hyoung I. Lho, OD, An T. Hoang, OD, Erika M. Perzan, OD, FAAO, ABCMO, and Kelsey D. Smith, OD | Optometric Education:
Volume 46 Number 2 (Winter-Spring 2021)

                                                          PDF of Article

Background

This teaching case report involves one of five pattern dystrophies of the retinal pigment epithelium (RPE), which share several
characteristics. Typically, they are inherited in autosomal dominant fashion, heterogenous in presentation, associated with
little or no vision loss, and characterized by lipofuscin deposits in the RPE. They can show variability with time, and fluorescein
angiography can help distinguish the subtypes.1-5 The five pattern dystrophy subtypes of the macula are: butterfly-shaped
pattern dystrophy (BPSD), vitelliform dystrophy of the fovea, fundus flavimaculatus, reticular dystrophy of the pigment
epithelium and fundus pulverulentus.2,3,4 Signs of these five pattern dystrophies may be evident in the first decade of life,5 and
most patients are asymptomatic into middle age.2

This case discusses a stable, bilateral presentation of BSPD. The patient is a 68-year-old African American female who has been
a Veterans Health Administration (VHA) eye clinic patient for 12 years. BSPD is a rare, bilateral condition characterized by a
buildup of yellow, orange or gray pigmented material in a butterfly-shaped pattern within the RPE of the macula.1,6,7 The
butterfly shape may also be described as linear, stellate, branching or shaped like a letter.7,8

BSPD has a rare incidence and prevalence per a 1991 study. The study spanned 18 years in Northern France and included
approximately 4 million people. Researchers found three patients with BSPD out of 1,660 patients known to have inherited
retinal dystrophies. This gives a cumulative incidence of 0.000415% of residents having any inherited retinal dystrophy in that
time period. (Cumulative incidence = number of events/population size.) Additionally, this gives a prevalence for BSPD of
0.00000075% among all of the study subjects and 0.001807%9 among the 1,660 study subjects with a pattern dystrophy.
(Prevalence = number of cases/population size.)

Purpose

The intended audience for this teaching case report is the Doctor of Optometry involved in training fourth-year interns and
externs and residents in a clinical or academic setting. The case provides an example of how to approach a rare diagnosis with
a trainee, how to gather the pertinent objective data to monitor the condition, when to refer the case for co-management with a
retina specialist and how to educate the patient about the impact of the diagnosis on the patient and his or her family
members.

Student Discussion Guide

Case description

A 68-year-old African American female presented for a routine comprehensive eye exam in 2019. Previously, in 2007 and 2010,
the patient had undergone teleretinal screening. Her first known eye exam at a VHA facility was in 2012. Subsequent exams
occurred in 2014, 2016, 2017, 2018 and 2019.

At the 2019 eye exam, the patient reported no ocular or visual complaints. Known family ocular history was unremarkable. The
patient’s ocular history included moderate dry eye syndrome with blepharitis in both eyes, chronic allergic conjunctivitis and
uncontrolled type 2 diabetes mellitus (T2DM) that was diagnosed in 2007. The patient had been taking insulin since 2015, and
there was no known retinopathy in either eye. BSPD in both eyes had been originally diagnosed as “pattern dystrophy” in 2007
via teleretinal imaging. The patient’s ocular history also included moderate hypertensive retinopathy in both eyes, refractive
error in both eyes and nuclear cataracts in both eyes. Medical history included benign hypertensive heart disease and chronic
renal disease stage 3, T2DM on insulin, multiple-type hyperlipidemia, obesity and essential hypertension. Known drug allergies
included codeine, influenza [vaccine] and metformin. Active medications included amlodipine 10-mg tablet QD for blood
pressure, carboxymethylcellulose 1% (Refresh Liquigel) 1gtt in each eye TID for dry eyes, cholecalciferol (vitamin D3) 1,000-IU
tablet QD for vitamin D supplementation, glimepiride 4-mg tablet every morning with food for diabetes, hydrochlorothiazide
one half of a 25-mg tablet QD as needed for blood pressure, human insulin 100 unit/mL injection 35 units subcutaneously QD

                                                                                                                                  2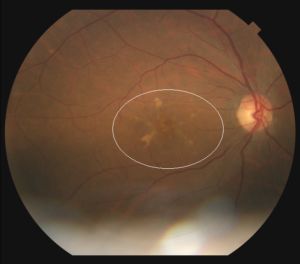
for diabetes, losartan one half of a 100-mg tablet QD for blood pressure, and simvastatin 80-mg tablet QHS for cholesterol.
Also at the 2019 visit, the patient’s best-corrected visual acuity was 20/25- in the right eye and 20/25+ in the left eye with near
visual acuity of 20/20 (both eyes). All entrance tests and anterior segment slit lamp examination findings were stable,
unremarkable and age-appropriate in both eyes. Specific tests performed included extraocular muscle motilities, confrontation
visual fields, pupil testing, manifest refraction and dilated fundoscopic examination with 20D and 66D lenses. Amsler grid
testing with best near correction was full in each eye. Posterior segment examination with dilation showed mild arterial/venous
(A/V) crossing changes with attenuated vessels and an A/V ratio of 1:2 OU. The peripheral retina was unremarkable. Macular
findings were stable and significant for the presence of BSPD in both eyes overlying a two-disc-diameter area. The appearance
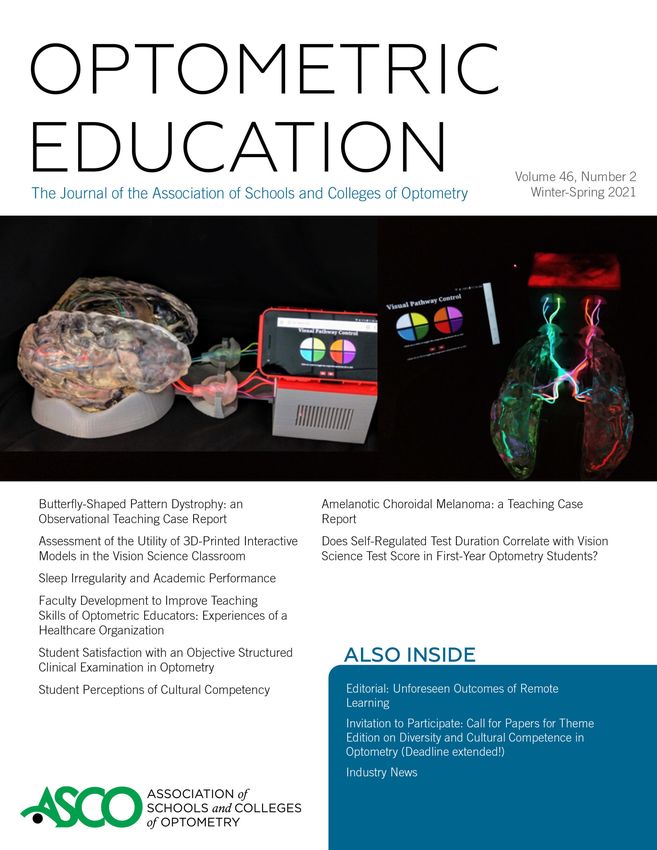
of the butterfly-shaped patterns in 2019 was stable when compared with the 2007 and 2017 retinal photographs (Figures
1-4). The quality of the 2019 photographs was degraded by media blur from the cataracts. Only the 2007 and 2017 retinal
images are included in the case report.
Figure 3. 2017: Mydriatic fundus Figure 4. 2017: Mydriatic fundus
Figure 1. 2007: Mydriatic fundus Figure 2. 2007: Mydriatic fundus photography of the posterior pole photography of the posterior pole
photography of the posterior pole photography of the posterior pole of the right eye, including optic of the left eye, including optic
of the right eye, including optic of the left eye, including optic nerve, macula and major retinal nerve, macula and major retinal
nerve, macula and major retinal nerve, macula and major retinal vessels. The area of butterfly- vessels. The area of butterfly-
vessels. The area of butterfly- vessels. The area of butterfly- shaped pattern dystrophy is circled. shaped pattern dystrophy is circled.
shaped pattern dystrophy is circled. shaped pattern dystrophy is circled. Click to enlarge Click to enlarge
Click to enlarge Click to enlarge
Reliable optical coherence tomography (OCT) macular cube 512 x 128 and HD five-line raster scans [Zeiss Cirrus 400 spectral
domain (SD) OCT] obtained in 2019 showed intact foveal contours in both eyes with no subretinal fluid (Figures 5-8). The
scans were remarkable for macular thinning and showed subtle subfoveal disruption in both eyes with ellipsoid zone loss.
Central subfield thickness measured 204 µm OD and within average ranges at 223 µm OS; cube volume was decreased at 8.7
mm3 OD and 8.4 mm3 OS. Cube average thickness was decreased at 245 µm OD and 240 µm OS.
Figure 5. 2019: OCT scan (Zeiss Figure 6. 2019: OCT scan (Zeiss Figure 7. 2019: OCT five-line Figure 8. 2019: OCT five-line
Cirrus SD-OCT 400) of the right eye Cirrus SD-OCT 400) of the left eye raster scan (Zeiss Cirrus SD-OCT raster scan (Zeiss Cirrus SD-OCT
showing macular thinning and showing macular thinning and 400) through the fovea of the right 400) through the fovea of the left
volume loss. volume loss. eye showing loss of ellipsoid zone. eye showing loss of ellipsoid zone.
Click to enlarge Click to enlarge Click to enlarge Click to enlarge
The patient was scheduled to return in one year for a comprehensive exam with OCT imaging of the maculae and fundus
photographs of both eyes. The plan included continued progression analysis of macular thickness via OCT scans and to obtain
baseline fundus autofluorescence imaging. Obtaining an electroretinogram (ERG) and electro-oculogram (EOG) could also be
3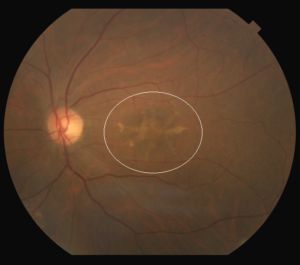
illustrative. In pattern dystrophies, expected findings would be abnormal pattern ERG, normal flash ERG and abnormal EOG.10

The findings of stable hypertensive retinopathy and stable BSPD were discussed with the patient. She was counseled on
lifestyle management of diabetes, cardiovascular risk factors and hypertension. The importance of avoiding smoking,
maintaining a heart healthy diet and managing all systemic health conditions per the advice of her primary care provider were
discussed.

The patient was educated that no treatment for BSPD is currently known and she would be notified if that were to change. She
was instructed to routinely check her vision at home with the Amsler grid and why it is important. The patient verbally
confirmed that she should immediately contact the eye clinic if grid changes were noted. Patient education also included a
discussion on possible treatment options if her condition should progress. She was instructed to inform her immediate family
members of the diagnosis so they could schedule routine comprehensive eye exams and determine whether they had a retinal
pattern dystrophy.

Educator’s Guide

Learning objectives

1. Recognize macular pattern dystrophies (BSPD, vitelliform dystrophy of the fovea, fundus flavimaculatus, reticular dystrophy
   of the pigment epithelium and fundus pulverulentus)
2. Determine appropriate tools for diagnosis of macular pattern dystrophies
3. Diagnose the subset of BSPD
4. Understand appropriate management for the condition
5. Understand treatment options if complications develop
6. Deliver patient education regarding management options and prognosis
7. Deliver patient education regarding genetic testing and family counseling

Key concepts

1.   Difference between common macular diseases and the rare pattern dystrophies
2.   How the appearance of BSPD is different from the appearance of the other macula pattern dystrophies
3.   Recommending ancillary testing to support the management of pattern dystrophy
4.   Delivering clear education to the patient regarding diagnosis, treatment and management of BSPD

Education Guidelines

Setting: academic classroom or clinical discussion after patient care

       1. Focus on the knowledge, facts, and concepts required for critical review of the case:

                a. Is this a typical presentation of BSPD?
                b. Can the patient make lifestyle changes to assist in management of BSPD?
                c. How can you differentiate BSPD from the other pattern dystrophies of the macula?
                d. What is an appropriate patient management plan?

       2. Differential diagnosis:

                a. What differential diagnoses can be considered based on the findings of the eye exam?
                b. What is the purpose of ancillary testing in pattern dystrophy?
                c. What knowledge gaps did this case expose for you and how will you bridge those gaps?

       3. Disease management:

                a. What are the benefits of closely monitoring this patient?
                b. What are the drawbacks of closely monitoring this patient?

       4. Patient education and communication:

                a. How do you educate the patient on the diagnosis?
                b. How do you educate the patient on the prognosis?
                c. What sequelae do you advise the patient to expect?

                                                                                                                              4
d. How do you discuss genetic testing with the patient?
              e. How do you deliver these discussions in an empathetic manner?

     5. Critical thinking:

              a. Could patient adherence to follow-up be a complication in this case?
              b. Could patient adherence to home monitoring be a challenge in this case?
              c. Are you prepared now to manage a diagnosis of pattern dystrophy?

Learning assessment

     1. Instructor guides a case discussion to ensure all discussion questions are considered
     2. Evaluate the trainees’ knowledge base by fostering discussion of the OCT scans, retinal photos, Amsler grid and
     pertinent exam findings
     3. Evaluate knowledge base by having the trainees discuss possible differential diagnoses
     4. Evaluate clinical-thinking skills with a literature review and follow-up discussion (The literature review can be
     conducted informally by the trainees or formally with the intent to produce a case study paper, case study manuscript or
     poster)

Discussion

Clinical presentation and differential diagnosis

Pattern dystrophies of the RPE tend to share several characteristics. Typically, they are inherited in autosomal dominant
fashion, heterogenous in presentation, associated with little or no vision loss, and characterized by lipofuscin deposits in the
RPE. They can show variability with time, and fluorescein angiography can help distinguish the subtypes.1-5 Signs of the
macular pattern dystrophies may be evident in the first decade of life,5 and most patients are asymptomatic into middle age.2
The physical appearance of pattern dystrophies and BSPD can progress with time, appear as different patterns between eyes,
and display different patterns among family members.7,8 The pattern may vary in presentation at subsequent exams and change
in appearance to more closely resemble a different pattern dystrophy of the macula. Family members of patients with BSPD
who are initially free of clinical signs of the condition may develop a pattern dystrophy over time.4,7

Most reports of BSPD in the literature emphasize its rare occurrence and typically benign natural course. However, reports of
geographic atrophy and choroidal neovascular membrane (CNVM) have been published.2,13,14 Conversion to CNVM occurs
infrequently.13,14 In a case of BSPD with CNVM reported in 2000, lesions spontaneously involuted and without treatment
regressed to a focal, fibrotic scar with a favorable visual prognosis.13 Recently, CNVM in BSPD was reported to have a
therapeutic response to anti-vascular endothelial growth factor (anti-VEGF) intravitreal injections.14

Differential diagnosis for BSPD includes the four other pattern dystrophies, which are Best’s vitelliform dystrophy of the fovea,
Stargardt’s macular dystrophy/fundus flavimaculatus, reticular dystrophy of the pigment epithelium and fundus pulverulentus.
Additional differential diagnoses include central areolar choroidal dystrophy, North Carolina macular dystrophy, progressive
bifocal chorioretinal atrophy, Sorbsy fundus dystrophy and dominant macular dystrophy.2,3,4,6,10,15,16 These conditions can all
involve the macular region, and while they have similarities with BSPD, they can be differentiated by their unique
presentations.

Writing in 2013, Hannan et al. provided a useful reference for the OCT appearance of three different pattern dystrophies,
including BSPD. In their BSPD cases, they described SD-OCT as revealing disruptions in the ellipsoid zone of the IS/OS (inner
segment/outer segment) junction.17 Writing in 2017, Kumar et al. described loss of the photoreceptor integrity line in the
ellipsoid layer in the macular region.18

Currently there is no treatment for stable pattern dystrophies, although nutritional supplements have been considered,10 and
genetic therapies may be developed. The CTNNA1 gene has been implicated in inheritance per a 2016 study. The CTNNA1
gene, which encodes for alpha-catenin 1, is essential in maintaining RPE integrity and intercellular adhesion junctions. Defects
in cadherin-based intercellular adhesion is believed to cause macular dystrophy.11 The HTRA1 single-nucleotide polymorphism
was also associated with pattern dystrophy and age-related macular degeneration (AMD) per a 2012 study.12

Our patient was diagnosed in her mid-50s and remains asymptomatic at age 68. She fits within the age group and clinical
presentation described in the literature. Symptoms and signs have remained stable and the presentation of BSPD in our patient
has followed a benign course. She has no known family members with the condition. Our OCT findings showed loss of the
ellipsoid zone consistent with what is described in the literature for similar cases.

                                                                                                                                5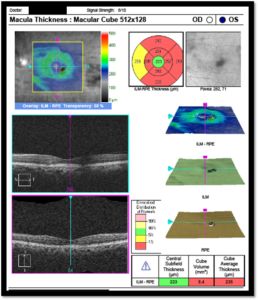
Indicated tests

Patient at-home monitoring with the Amsler grid and in-clinic OCT imaging of the macula are useful tools in ruling out CNVM.
For purposes of comparison, it is advised that the same OCT macular cube scan sets are run at subsequent visits. This enables
a change analysis of the macular cube 512 x128 that can be compared from two different dates. Additional tests could include
automated perimetry of the central visual field, ERG, EOG and genetic testing.10

Commonly available central visual field testing options include the Zeiss Humphrey Visual Field 10-2 of the central 10 degrees
of vision and the Haag-Streit Octopus 900 M-Top Scan of the central 12 degrees of vision. Expected findings on
electrophysiological tests are abnormal pattern ERG, normal flash ERG and abnormal EOG.10 Genetic testing can be discussed
with the patient and pursued if he or she desires. BSPD was originally thought to have a complicated inheritance pattern.
Autosomal dominant, autosomal recessive, and multi-factorial dominant inheritance had been proposed.5,6,15,16 More recent
literature identified the heterozygous missense mutation of the CTNNA1 gene as a cause of BSPD in three families. It was also
discovered that an analogous mutation of CTNNA1tvrm5 found in mice displayed similar phenotypic expression.11

Treatment of BSPD

There is no treatment for stable pattern dystrophies. The reviewed literature emphasized the usually benign natural course of
BSPD. There have been reports of geographic atrophy development. CNVM development, which would require intervention by
a retina specialist, has also been reported.2,13,14

Case management

Annual dilated examinations incorporating Amsler grid education, OCT imaging of the macula and serial retinal photos are
indicated. Optometrists can provide further support and clinical guidance by ordering genetic testing and providing
comprehensive eye exams to immediate family members. The eye doctor should deliver relevant knowledge about the patient’s
condition with empathy at a level the patient can comprehend. Finally, the doctor should ensure the patient understands the
need for regular comprehensive exams even if he or she is asymptomatic.

Conclusion

BSPD is a rare, bilateral condition that can be conservatively managed by the optometrist with annual dilated exams, OCT
imaging of the macula and retinal photos. The patient participates in management with at-home Amsler grid monitoring. If
CNVM develops, the patient should be promptly referred to a retina specialist to discuss treatment options, which may include
anti-VEGF injections or careful monitoring. The diagnosis of BSPD is mainly clinical and can be supported with genetic testing
if pursued by the patient or clinician. The patient should understand that this rare condition usually has minimal impact on
vision, but severe outcomes can occur. The patient should be informed that BSPD can be inherited and that primary family
members should be examined for signs of macular pattern dystrophy. The optometrist can educate the patient on how macular
pattern dystrophy is different from AMD and other maculopathies. This topic is relevant in an optometric clinical training
environment to guide the trainee in appropriate treatment and management decisions, specifically when to retain the patient
and when to refer to a retina specialist for co-management.

References

 1. Zhang K, Garibaldi DC, Li Y, Green WR, Zack DJ. Butterfly-shaped pattern dystrophy: a genetic, clinical, and
    histopathological report. Arch Ophthalmol. 2002 Apr;120(4):485-90. doi: 10.1001/archopht.120.4.485. PMID: 11934323.
 2. Esteves F, Dolz-Marco R, Hernández-Martínez P, Díaz-Llopis M, Gallego-Pinazo R. Pattern dystrophy of the macula in a
    case of steinert disease. Case Rep Ophthalmol. 2013 Sep 21;4(3):129-33. doi: 10.1159/000355385. PMID: 24163680;
    PMCID: PMC3806677.
 3. Agarwal A. Gass’ atlas of macular diseases. 5th ed. Philadelphia(PA): Elsevier/Saunders; 2012. p239-436.
 4. Agarwal A, Patel P, Adkins T, Gass JD. Spectrum of pattern dystrophy in pseudoxanthoma elasticum. Arch Ophthalmol.
    2005 Jul;123(7):923-8. doi: 10.1001/archopht.123.7.923. PMID: 16009832.
 5. Prensky JG, Bresnick GH. Butterfly-shaped macular dystrophy in four generations. Arch Ophthalmol. 1983
    Aug;101(8):1198-203. doi: 10.1001/archopht.1983.01040020200005. PMID: 6882245.
 6. Deutman AF, van Blommestein JD, Henkes HE, Waardenburg PJ, Solleveld-van Driest E. Butterfly-shaped pigment
    dystrophy of the fovea. Arch Ophthalmol. 1970 May;83(5):558-69. doi: 10.1001/archopht.1970.00990030558006. PMID:
    5442145.
 7. Watzke RC, Folk JC, Lang RM. Pattern dystrophy of the retinal pigment epithelium. Ophthalmology. 1982 Dec;89(12):1400-
    6. doi: 10.1016/s0161-6420(82)34632-1. PMID: 6984500.
 8. Gutman I, Walsh JB, Henkind P. Vitelliform macular dystrophy and butterfly-shaped epithelial dystrophy: a continuum? Br J

                                                                                                                                6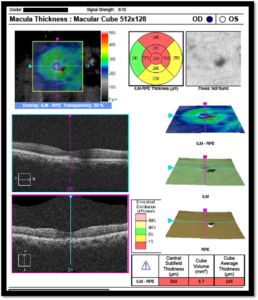
Ophthalmol. 1982 Mar;66(3):170-3. doi: 10.1136/bjo.66.3.170. PMID: 7066268; PMCID: PMC1039746.
 9. Puech B, Kostrubiec B, Hache JC, François P. Epidémiologie et prévalence des principales dystrophies rétiniennes
    héréditaires dans le Nord de la France [Epidemiology and prevalence of hereditary retinal dystrophies in the Northern
    France]. J Fr Ophtalmol. 1991;14(3):153-64. French. PMID: 1918822.
10. Michaelides M, Hunt DM, Moore AT. The genetics of inherited macular dystrophies. J Med Genet. 2003 Sep;40(9):641-50.
    doi: 10.1136/jmg.40.9.641. PMID: 12960208; PMCID: PMC1735576.
11. Saksens NT, Krebs MP, Schoenmaker-Koller FE, et al. Mutations in CTNNA1 cause butterfly-shaped pigment dystrophy
    and perturbed retinal pigment epithelium integrity. Nat Genet. 2016 Feb;48(2):144-51. doi: 10.1038/ng.3474. Epub 2015
    Dec 21. PMID: 26691986; PMCID: PMC4787620.
12. Jaouni T, Averbukh E, Burstyn-Cohen T, Grunin M, Banin E, Sharon D, Chowers I. Association of pattern dystrophy with an
    HTRA1 single-nucleotide polymorphism. Arch Ophthalmol. 2012 Aug;130(8):987-91. doi:
    10.1001/archophthalmol.2012.1483. PMID: 22893068.
13. Marano F, Deutman AF, Leys A, Aandekerk AL. Hereditary retinal dystrophies and choroidal neovascularization. Graefes
    Arch Clin Exp Ophthalmol. 2000 Sep;238(9):760-4. doi: 10.1007/s004170000186. PMID: 11045344.
14. Empeslidis T, Vardarinos A, Deane J, Banerjee S. Intravitreal ranibizumab in the treatment of butterfly-shaped pattern
    dystrophy associated with choroidal neovascularization: a case report. Case Rep Ophthalmol. 2012 Jan;3(1):77-82. doi:
    10.1159/000336987. Epub 2012 Feb 29. PMID: 22529806; PMCID: PMC3331880.
15. Zhang K, Nguyen TH, Crandall A, Donoso LA. Genetic and molecular studies of macular dystrophies: recent developments.
    Surv Ophthalmol. 1995 Jul-Aug;40(1):51-61. doi: 10.1016/s0039-6257(95)80047-6. PMID: 8545803.
16. Kempeneers HP, Dewachter A, Kempeneers GM. Pattern dystrophies of the retinal pigment epithelium. The study of three
    generations in a family. Doc Ophthalmol. 1990-1991;76(3):261-72. doi: 10.1007/BF00142685. PMID: 2103528.
17. Hannan SR, de Salvo G, Stinghe A, Shawkat F, Lotery AJ. Common spectral domain OCT and electrophysiological findings
    in different pattern dystrophies. Br J Ophthalmol. 2013 May;97(5):605-10. doi: 10.1136/bjophthalmol-2011-301257. Epub
    2013 Feb 20. PMID: 23426737.
18. 18. Kumar V, Kumawat D. Multimodal imaging in a case of butterfly pattern dystrophy of retinal pigment epithelium. Int
    Ophthalmol. 2018 Apr;38(2):775-779. doi: 10.1007/s10792-017-0497-3. Epub 2017 Mar 15. PMID: 28299497.

                                                                                                                          7
Sleep Irregularity and Academic Performance
Matt Valdes, OD, FAAO, Deidre Rios, MS, PhD, AHIP, Allison Rocha, BS, and Keila Rodriquez, BS | Optometric Education:
Volume 46 Number 2 (Winter-Spring 2021)
PDF of Article
Introduction
Insufficient sleep has been labeled a public health crisis in the United States, with many adults receiving less than the 7-8
hours of sleep per night recommended by the Centers for Disease Control and Prevention.1 Other national initiatives such as
Healthy People 2020 and Healthy People 2030 from the U.S. Department of Health and Human Services include sleep health
objectives that address this crisis. Busier schedules and lifestyle factors have led many to treat sleep as a commodity to be
exchanged for greater productivity. Sacrificing sleep for study time is a prevalent practice in medical, optometric and other
health science student populations.2 Sleep has a relevant role in learning and academic achievement, and the literature
investigating the relationship between student sleep and student learning covers many areas.3
Irregular patterns in sleep onset, wake time and sleep duration can result in poor quality of sleep,4 which has been linked to
cognitive impairment,5-7 delayed reaction times and increased risk for health issues.8-10 All of these can be detrimental for
optometry students. The financial implications of insufficient sleep have also been well-documented in decreased productivity,
treatment of sleeping disorders and premature or accidental death.11-14 Optometry students may be aware of some of these
risks, but with their focus on learning to navigate the rigors of the curriculum, few are cognizant of their sleep hygiene and
how it may affect their learning and ultimately academic achievement. Studies focused on sleep duration and sleep/wake
indices have closely linked student learning capacity and academic performance with sleep quality.15
Often referred to as the knowledge-behavior gap, the wealth of information on good sleep hygiene and physical/mental health
is not reflected in personal sleep habits, with more than a third of all Americans reportedly not getting enough sleep.16 Poor
quality sleep among college students has been reported as high as 60% and has been associated with increased mental health
issues and irregular sleep patterns16-19 that lead to increased daytime fatigue, inattentiveness and poor academic
performance.20
To date, much of the research regarding student sleep habits has been unable to address issues such as inherent optimistic
bias, which can lead people to think more positively about their habits and result in poor decision-making.21 Prior sleep studies
have also required expensive equipment, relied heavily on sleep journals/self-reported sleep habits, or were limited in days
monitored.22,23 The aims of this study are to integrate self-reported sleep habits with objectively recorded wrist-based
accelerometer (WBA) data and relate subjects’ sleep profiles with academic performance. Using technology, we look to
minimize personal bias, broaden the view of subject sleep behavior, and improve data analysis of variations in bedtimes, wake
times and sleep duration to develop individualized sleep profiles.
Methods
Participants
This longitudinal study was conducted during the Spring/Summer semesters at the University of the Incarnate Word
Rosenberg School of Optometry. Twenty-three full-time (greater than 16 credit hours) graduate students were recruited to
participate in a pre-study questionnaire and wear a WBA for 30 days (21-day minimum). Two subjects did not complete the
study for personal reasons. Exclusion criteria included pregnancy, nursing or caring for a newborn.
Study approval
All subjects provided written informed consent. This study was approved by the Institutional Review Board and was in
compliance with the Declaration of Helsinki.
Data collection
Two sets of data were collected: self-reported sleep behaviors and passively recorded sleep patterns. All subject data were de-
identified, and unique identification numbers were used to track each participant. Data were stored on password-protected
cloud systems.
8Wrist-based accelerometers
Participants were given the option to use a personal WBA or the study-provided tracker (Mi Band 2). The three WBAs used for
sleep data analysis were: Fitbit Charge 2 (San Francisco, CA), AutoSleep application (Sydney, AU) with Apple Watch Series 3
(Cupertino, CA), and Xiaomi Mi Band 2 (Taipei, TW). Although their sleep algorithms are proprietary, all three trackers utilize
movement and heart rate to define time to bed, sleep duration and wake time for all subjects.24-27 Subjects were asked to wear
the WBA throughout the day and night for the duration of the study.
Statistical analysis
Data were collected and analyzed using Google Sheets (Mountain View, CA) and XLMiner Analysis ToolPak (Incline Village,
NV). Pearson linear regression determined correlations between sleep patterns and grade point average (GPA). Paired t-test
was performed to compare student perceptions of sleep habits and recorded sleep patterns.
Pre-study questionnaire
All subjects were given a sleep study questionnaire designed to collect
information regarding demographics, sleep habits, caffeine
consumption, body mass index and perceived amount of sleep their
classmates receive (Table 1).
Results
Twenty-one professional school students [4 men and 17 women, mean
age 25 years (standard deviation 1.5 years)] passively tracked their
sleep patterns for a maximum of 30 days (minimum: 24 days; average:
28 days) using Fitbit (n=6), Xiaomi Mi Band (n=10) or AutoSleep app
(n=5) WBAs.
Mean sleep duration
Table 1. Click to enlarge
Mean sleep duration based on students’ self-reporting on the pre-study
questionnaire was 7h32m (standard deviation 47m). Mean sleep
duration based on WBA data was 7h39m (standard deviation 51m). A
paired t-test was performed, and no statistical difference was found
between the mean sleep durations (p=0.57). A majority of students
underestimated their amount of sleep (n=13) as compared with WBA
data. The WBAs allowed for broader analysis, differentiating between
weekday (WKD = Monday, Tuesday, Wednesday, Thursday) and
weekend (WKE = Friday, Saturday, Sunday) sleep patterns. Mean
sleep duration during the week [7h24m (standard deviation 58m)] was
38 minutes shorter than during the weekend [8h02m (standard
deviation 1h11m)]. This may result from students sleeping-in during
the weekend to make up for shorter sleep durations during the week.
Pearson correlation coefficients for total mean sleep duration (r2=0.06,
p=0.27) and WKE mean sleep duration (r2=0.00, p=0.97) showed
minimal correlation with GPA. WKD mean sleep duration (r2=0.15,
p=0.08) correlated moderately with GPA and trended toward
statistical significance (Figure 1).
Time to bed
Based on the pre-study questionnaire, mean estimated time to bed was 23:14 (standard deviation 1h5m). According to the WBA
data, mean time to bed was 00:06 (standard deviation 48m). A paired t-test found a statistically significant difference between
self-reported time to bed and sleep tracker time to bed (p=0.003). Sleep tracker measurements were 23:54 (standard deviation
46m) for WKD time to bed and 00:13 (standard deviation 54m) for WKE time to bed. The mean difference of 19m was not
statistically significant (p=0.23). Pearson correlation coefficients for total time to bed (r2=0.06, p=0.27) and WKE time to bed
(r=0.04, p=0.41) demonstrated weak correlation with GPA. Earlier WKD time to bed was moderately correlated with better
GPA (r2=0.17, p=0.06) (Figure 2).
9Figure 1.Association between GPA and weekday
(WKD), weekend (WKE) and overall average sleep Figure 2. Association between GPA and weekday
durations. WKD sleep duration was most (WKD), weekend (WKE) and overall average time
positively correlated with better academic Figure 3. Weekday (WKD) time to bed
to bed. WKD time to bed was most correlated
performance, trending toward statistical consistency was the strongest predictor of GPA
with academic performance, trending toward
significance (r2=0.15; 95% CI, 1.56 to 3.24; and statistically significant (r2=0.26; 95% CI,
statistical significance (r2=0.17; 95% CI, 0.99 to
p=0.08). Click to enlarge 0.98 to 1.33; p=0.02).
1.33; p=0.06). Click to enlarge
Click to enlarge
Wake time
Self-reported pre-study questionnaire data showed students’ estimated mean wake time to be 06:46 (standard deviation 52m).
WBA data measured mean wake time to be 07:45 (standard deviation 37m). A paired t-test was performed and found a
statistically significant difference between self-reported wake time and sleep tracker wake time (p< 0.001). Sleep tracker data
was 07:17 (standard deviation 33m) for WKD wake time and 08:27 (standard deviation 58m) for WKE wake time. This mean
difference of 1h09m was statistically significant (ptheir likelihood of receiving more sleep with earlier bedtimes. Wake times were less predictive of academic performance based
on external factors (e.g., academic schedule), which were out of the students’ control.
Sleep consistency
Our data support the impact sleep consistency has on a student’s ability to perform academically. The less variable/more
regular the sleep duration and time to bed values were, the better the GPA. Regular sleep and circadian rhythms have been
linked with learning and memory-forming.10 This study was able to utilize data collected over 30 days to identify individual
sleep profiles not usually seen in self-reported sleep studies. WBAs allowed for more accurate and consistent passive recording
of data rather than reliance on subjective self-reported time to bed and wake times.
Weekdays vs. weekends
A noticeable shift in sleep patterns was observed among our cohort when comparing WKD and WKE datasets. Students went to
bed 19 minutes later, rose 1 hour and 9 minutes later and received, on average, 38 more minutes of total WKE sleep, which
could be a response to chronic sleep insufficiency during the week. Prior studies of sleep-wake cycle shifts related to daylight
savings time have found evidence of decreased productivity, increased traffic accidents and absenteeism.29 Our data suggest
regular sleep patterns during the weekdays are more related to academic performance compared with significantly different
weekend sleep patterns.20
Self-reported bias
To avoid bias regarding sleep duration and the often cited 8-hour recommendation, our pre-study questionnaire instead asked
subjects to provide their typical time to bed and wake times. We calculated the difference to determine their estimated average
sleep duration, which turned out to be accurate within 8 minutes of the overall measured sleep duration. What we found most
interesting was how estimated time in bed and wake times were skewed earlier (23:14 vs. 00:06 and 06:46 vs. 07:45,
respectively) when compared to WBA data. We feel the ability to collect data regarding sleep patterns with no explicit action
from the user minimized subject bias and should be considered in future sleep studies.
Limitations and future considerations
Potential limitations in our study included our sample population and size. Surveying students across three different grade
levels can affect the weight of the GPA (e.g., an OPTIII GPA includes more than 60 credit hours, while an OPTI may only
include 22). Due to the timing of this research, there was also a greater distribution of third-year year students (n=12)
participating compared with the numbers of second-year and fourth-year students (n=3 and n=6, respectively). Also, as a pilot
study, a small sample size was used, which may have resulted in lower statistical power. Follow-up studies will be limited to a
single class to address these factors. Additionally, using three different activity trackers with potentially varying algorithms
could have affected time to bed and wake time measurements. Future studies will utilize a uniform tracker for all subjects. The
trackers were also unable to account for naps, which students often use to recharge after building sleep debt from the previous
day. This software limitation may impact which tracker we elect to use moving forward.
Conclusion
In summary, our results suggest regular sleep patterns may promote learning and academic performance. As wearable health
technology continues to improve and becomes less expensive, large-scale datasets will allow researchers to analyze
activity/sleep patterns with greater detail. By broadening our understanding of delayed sleep onset and shortened sleep
durations, we look to explore techniques that help students develop improved sleep habits.
Acknowledgments
This study was funded by an internal faculty development grant at the University of the Incarnate Word Rosenberg School of
Optometry.
The authors would like to thank Dr. Jeff Rabin for his support of this study.
References
1. Barnes CM, Drake CL. Prioritizing sleep health: Public health policy recommendations. Perspect Psychol Sci.
2015;10(6):733-737.
2. Cvejic E, Huang S, Vollmer-Conna U. Can you snooze your way to an “A”? Exploring the complex relationship between
sleep, autonomic activity, wellbeing and performance in medical students. Aust N Z J Psychiatry. 2018;52(1):39-46.
113. Curcio G, Ferrara M, De Gennaro L. Sleep loss, learning capacity and academic performance. Sleep Med Rev. 2006;10:323-
337.
4. El Hangouche AJ, Jniene A, Aboudrar S, et al. Relationship between poor quality sleep, excessive daytime sleepiness and
low academic performance in medical students. Adv Med Educ Pract. 2018;9:631-638.
5. Medeiros AD, Mendes DF, Lima PF, Araujo JF. The relationships between sleep-wake cycle and academic performance in
medical students. Biol Rhythm Res. 2001;32(2):263-270.
6. Krittanawong C, Tunhasiriwet A, Wang Z, et al. Association between short and long sleep durations and cardiovascular
outcomes: a systematic review and meta-analysis. Eur Heart J Acute Cardiovasc Care. 2019;8(8):762-770.
7. Buxton OM, Marcelli E. Short and long sleep are positively associated with obesity, diabetes, hypertension, and
cardiovascular disease among adults in the United States. Soc Sci Med. 2010;71:1027-1036.
8. Banks S, Dinges DF. Behavioral and physiological consequences of sleep restriction. J Clin Sleep Med. 2007;3:519-528.
9. Benca RM, Obermeyer WH, Thisted RA, Gillin JC. Sleep and psychiatric disorders. A meta-analysis. Arch Gen Psychiatry.
1992;49:651-668.
10. Smarr BL, Jennings KJ, Driscoll JR, Kriegsfeld LJ. A time to remember: the role of circadian clocks in learning and
memory. Behav Neurosci. 2014;128(3):283-303.
11. Smarr BL. Digital sleep logs reveal potential impacts of modern temporal structure on class performance in different
chronotypes. J Biol Rhythms. 2015;30(1):61-67.
12. Hillman D, Mitchell S, Streatfeild J, Burns C, Bruck D, Pezzullo L. The economic cost of inadequate sleep. Sleep. 2018 Aug
1;41(8). doi: 10.1093/sleep/zsy083. PubMed PMID: 29868785.
13. Hafner M, Stepanek M, Taylor J, Troxel WM, Van Stolk C. Why sleep matters — the economic costs of insufficient sleep: a
cross-country comparative analysis. Santa Monica, CA: RAND Corporation, 2016. Available from:
https://www.rand.org/pubs/research_reports/RR1791.html
14. Lunsford-Avery JR, Engelhard MM, Navar AM, Kollins SH. Validation of the Sleep Regularity Index in older adults and
associations with cardiometabolic risk. Sci Rep. 2018 Sept 21;8(1):14158.
15. Scullin MK. The eight hour sleep challenge during final exams week. Teach Psychol. 2019;46(1):55-63.
16. Patel SR, Hayes AL, Blackwell T, et al. The association between sleep patterns and obesity in older adults. Int J Obes
(Lond). 2014;38(9):1159-1164.
17. Taylor DJ, Bramoweth AD. Patterns and consequences of inadequate sleep in college students: Substance use and motor
vehicle accidents. J Adolesc Health. 2010;46:610-612.
18. Lund HG, Reider BD, Whiting AB, Prichard JR. Sleep patterns and predictors of disturbed sleep in a large population of
college students. J Adolesc Health. 2010;46(2):124-132.
19. Tsai LL, Li SP. Sleep patterns in college students: gender and grade differences. J Psychosom Res. 2004;56(2):231-237.
20. Eliasson AH, Lettieri CJ, Eliasson AH. Early to bed, early to rise! Sleep habits and academic performance in college
students. Sleep Breath. 2010;14(1):71-75.
21. Sharot T, Korn CW, Dolan RJ. How unrealistic optimism is maintained in the face of reality. Nat Neurosci.
2011;14(11):1475-1479.
22. Czeisler CA. Duration, timing and quality of sleep are each vital for health, performance and safety. Sleep Health.
2015;1(1):5-8.
23. Meltzer LJ, Hiruma LS, Avis K, Montgomery-Downs H, Valentin J. Comparison of a commercial accelerometer with
polysomnography and actigraphy in children and adolescents. Sleep. 2015;38(8):1323-1330.
24. Mi Band 2. Mi Global Home [Internet]. Xiaomi Corporation; c2010-2021 [cited Feb 19, 2021]. Available from:
www.mi.com/global/miband2/
25. Fitbit Technology. [Internet]. Fitbit Inc.; c2021 [cited Feb 19, 2021]. Available from: www.fitbit.com/technology#sleep
26. AutoSleep [Internet]. Sydney, Australia: Tantsissa Holdings Pty Ltd; c2015-2020 [cited Feb 19 2021]. Available from:
https://autosleepapp.tantsissa.com/
27. American Sleep Apnea Association and IBM launch patient-led sleep study app [Internet]. Washington, DC: American Sleep
Apnea Association; c2021 [cited Feb 19 2021]. Available from: https://www.sleepapnea.org/american-sleep-apn-
a-association-ibm-launch-patient-led-sleep-study-app/
28. BaHammam AS, Alaseem AM, Alzakri AA, Almeneessier AS, Sharif MM. The relationship between sleep and wake habits
and academic performance in medical students: A cross-sectional study. BMC Med Educ. 2012 Aug 1;12(61).
29. 29. Carey RN, Sarma KM. Impact of daylight saving time on road traffic collision risk: a systematic review. BMJ Open. 2017
Jul 2;7(6):e014319.
12Assessment of the Utility of 3D-Printed Interactive
Models in the Vision Science Classroom
D. Joshua Cameron, PhD | Optometric Education: Volume 46 Number 2 (Winter-Spring 2021)
PDF of Article
Background
Vision science is a topic that encompasses a complex interworking of optometry, ophthalmology, neuroscience, psychology,
physics, information systems biology and other fields of science, engineering and math. As part of optometry students’ study of
vision science, they are expected to learn how and why vision works and then recognize when something goes wrong. Two
areas in particular prove difficult for students to grasp, perhaps due to their unique visuospatial aspects. The first is the
complex neural network linking the retina to the brain – principally the geniculostriate pathway. The second is the center-
surround organizations prevalent in the retina and elsewhere in the vision system. These center-surround organizations are
comprised of antagonistic receptive fields that provide on/off signals that help establish visual boundaries. Even with complex
computer animations such as the synaptic organization demonstrated by Samuel Wu, students still struggle and underperform
in these two subject areas.1
Commercial off-the-shelf models have proven useful in both anatomy and clinical training. An example is the SOMSOVRMS
10/1, Female Pelvis with Ligamentous Apparatus (Marcus Sommer Modelle Gmbh, Coburg,Germany), which was shown to be
more effective in student learning outcomes compared with either interactive or static images on a computer screen.2 Estevez
et al. takes this a step further by using both preserved brain specimens, including plastic embedded sets of coronally and
horizontally sectioned brain slabs, and commercially available Human Brain Ventricles #566786 (Carolina Biological Supply
Co., Burlington, NC). The students in their study rebuilt brain structures over the ventricles using clay. The students who
participated in this type of activity had significant knowledge gains over students who did not participate.3 One of the more
thorough reviews on 3D modeling in the literature is presented by Azer and Azer. They reviewed more than 4,800 articles.
While their conclusion appears at first glance to not support 3D modeling in the classroom, it is worth noting that two-thirds of
the studies they focused on were web or computer-based models, not physical models. Most importantly, they recommended
studies with more research quality and methods that consider other skills, aside from anatomy performance.4 The goal of this
project was to incorporate both of these observations – a research study in a non-anatomy classroom using a physical model, in
this case a 3D-printed model.
3D printing, the process of taking a virtualized 3D model and turning it into a 3D physical object, is entering biomedicine at a
breakneck pace. Six years ago, approximately 400 articles in PubMed referenced 3D printing. As of the end of 2019 more than
5,000 did – an increase of more than 1,000% or >700 new articles a year! 3D printing is making significant strides in
education from engineering to biology. Recent studies with anatomy and surgery students have shown that 3D-printed models
provide significant education benefits over and above traditional textbooks and even 3D virtualization software in the
classroom.5-9 3D printing is also making headway into clinical settings, including optometric clinics.10-15 Recent predictions
suggest that 3D-printed materials will become mainstream medicine, especially in eye health.16 3D-printed models can also be
integrated with microcontrollers to facilitate custom interactive projects.17 An unanswered question is: Can 3D-printed models
be used to increase student learning in non-anatomy-based optometric classrooms?
To address this question, I developed an interactive 3D model of the geniculostriate, or primary visual pathway, with the
assistance of our university’s Educational 3D Visualization Specialists. I then used the models we developed to assess whether
they improved student performance on knowledge recall and enhanced the overall learning experience.
Methods
Model selection and design
The 3D-printed model was designed using publicly available MRI brain scans and image files (Thinigverse.com) that were
subsequently modified and sculpted or designed completely by myself or the Educational 3D Visualization Specialists using
TinkerCAD (Autodesk, San Rafael, CA) and Solidworks (Solidworks Corp., Waltham, MA). The 3D models were printed on a
Qidi X-Max (Qidi Technology, Ruian, Zhejiang, China), a Makerbot Replicator+ (MakerBot Industries, Brooklyn, NY) or a
Formlabs Form 2 (Formlabs Inc., Sommerville, MA) printer. A Raspberry Pi Zero W (Raspberry Pi Foundation, Cambridge,
13United Kingdom), a tiny single-board computer, was programmed to control multiple strands of electroluminescent wire using
a cell phone to remotely interact with the 3D model (Figure 1).
The WesternU Educational 3D Visualization department designed a 3D virtual model and hosted it on Sketchfab.com
(https://sketchfab.com/3d-models/visual-pathway-prototype-05f7e3f3104944478485b50ba0bc279f). A second model of the
primary visual pathway, designed by the University of Bristol, was also chosen for this study (https://sketchfab.com/3d-
models/optic-tract-and-radiation-455cac9756ed42458d33a0dad97b3512).
Three 2D models commonly used in the classroom were also included in the study (Figure 2).
Figure 1. 3D-printed visual pathway model. A)
Complete model in a well-lit room, showing the brain
lobes, eyes, supporting base, control unit,
electroluminescent wire and cell phone. B) Complete
model shown in a darkly lit room with glowing wire,
optic chiasm and visible control interface.
Click to enlarge
Figure 2. 2D visual pathway models. The three
pictures were provided to each group of students and
are representative of images students had seen
during classroom lectures. A) Figure 5.23 Cognitive
Neuroscience, The Biology of the Mind 4th Ed by
Michael S. Gazzaniga, Richard B. Ivry and George R.
Mangun, W.W. Norton & Company, 2014.
Reproduced with permission. B) By Ratznium (CC-
BY-SA-3.0), from Wikimedia Commons. Reproduced
with permission. C) Reproduction of the 3D model in
2D.
Click to enlarge
Classroom study design
All 79 optometry students in a second-year vision science course were randomly assigned to a group of four or five for a total of
16 groups. These students were enrolled in a four-year optometry degree program. The 16 groups were then each randomly
assigned to begin at one of the four stations:
1. interacting with the 3D-printed visual pathway model (3DP)
2. interacting with both virtual 3D models (3DV)
143. interacting with all three printed 2D images of the primary visual pathway (2D)
4. drawing the primary visual pathway on their choice of a blank piece of paper or on a blank print of the brain and eyes (2DD)
Prior to any interactions, to establish a baseline score, the students were given a 10-question assessment, including two
questions about their confidence levels related to the material – Assessment 1. Each group then rotated through each of four
stations: 1) 3DP, 2) 3DV, 3) 2D, and 2DD. Four groups worked at each station independently for approximately 20 minutes.
Each group within each station had identical models to work with.
At the end of each station, students completed a short four-question quiz before moving to the next station. Two questions in
each quiz assessed learning, and two questions assessed confidence levels. Students were permitted and encouraged to use the
materials available to them at their station to assist in answering the questions.
A final assessment, similar to the baseline assessment, was given at the end of the study – Assessment 2. Each assessment
contained an equal number of questions that either indicated an anatomical problem and sought input on the expected visual
field deficit or indicated a specific visual field deficit and sought input on the expected anatomical location that could have
resulted in the deficit. Students also provided qualitative feedback via online surveys during the 3DV and 2DD rotations and at
the conclusion of the study. The study was exempted from Institutional Review Board approval.
Data analysis
Survey results were collated in Google Forms (Alphabet Inc., Mountain View, CA). All assessments were taken electronically
using TopHat (Tophatmonocle Corp. Toronto, Ontario), a student engagement platform. Statistical analysis was completed
using SPSS (IBM, Armonk, NY). Univariate analysis of the variance and a pairwise comparison of the means were used to
compare performance among the test groups. The Wilcoxon signed rank test and paired t-test were used to compare before
and after test performance. A p-value less than 0.05 was deemed statistically significant.
Results
A total of 79 students were each randomly assigned to one of 16 groups using Excel’s random number picker. One student who
had to leave the study prior to the last rotation and Assessment 2 was excluded from the analysis, changing the total to 78
students. All students completed a 10-question electronic assessment at the start of the study – Assessment 1. The average
score was 62.8% (standard deviation 14.6%). Based on a univariate analysis of the variance and a pairwise comparison of the
means, no significant differences in performance on Assessment 1 were noted among the 16 groups (Figure 3).
Student groups completed the assigned tasks at each station. Performance was assessed after each rotation using questions
similar to those asked in Assessment 1, but fewer in number. The first round is most interesting and relevant because the
groups had only interacted with one media type. No statistical difference was observed in the four media groups when
comparing Assessment 1 scores; however, the two groups assigned to the 3DP and 3DV groups had markedly lower scores
compared to their peers (Figure 4A). On the other hand, students who worked with either the 3D-printed models or the 3D
virtual models performed significantly better on the Round 1 quiz than the students assigned to the other two groups (Figure
4B). On average, students performed much better on the Round 1 quiz than on Assessment 1.
As students completed each of the subsequent three rounds, post-round quizzes showed a varied range of performance both in
comparison to groups in the same round and compared to Assessment 1. The final assessment, Assessment 2, demonstrated a
significant knowledge gain by all students who participated in this study. The average score was 71.7% (standard deviation
10.6%). Using a univariate analysis of the variance and a pairwise comparison of the means, no significant differences in
performance on the final assessment were noted between the 16 groups (Figure 5). However, student performance on
Assessment 2 (71.7%) significantly increased relative to Assessment 1 (62.8%) as shown in a Wilcoxon signed rank test and
paired t-test (p=4.05×10⁻⁵ and p=1.89×10⁻⁵ respectively). The improvement was almost nine percentage points.
Figure 4. Comparison of the Round 1 groups to performance on Assessment 1
and Round 1 quiz. A) Round 1 groups are shown relative to their performance on
the initial assessment, Assessment 1. B) Round 1 groups are shown relative to
their performance on the Round 1 quiz. Each point represents the average score
percentage for the students assigned to the respective group. Error bars
represent the standard error of the mean. P-values were calculated using
univariate analysis of the variance comparing a combined 3D-printed model (3DP)
Figure 3. Results from Assessment 1 by group. Each point and virtual 3D models (3DV) to printed 2D images (2D) and drawing the primary Figure 5. Results from Assessment 2 by group. Each point
represents the average score percentage for the students visual pathway (2DD). represents the average score percentage for the students
assigned to the respective group. Error bars represent the Click to enlarge assigned to the respective group. Error bars represent the
95% confidence interval for the mean. Click to enlarge 95% confidence interval for the mean. Click to enlarge
15The study also assessed student confidence levels and perceptions. Confidence increased marginally between Assessment 1
and Assessment 2. However, when asked, “I am more confident in my ability to correlate visual field deficits to visual pathway
damage after interacting with the 3D-printed model of the visual pathway,” at the conclusion of the study, the confidence of
those who responded “strongly agree” increased almost nine times compared to questions answered in Assessment 2, “I am
confident in my ability to identify common anatomical lesions from visual field information,” and “I am confident in my ability
to identify visual field abnormalities from common anatomical lesion information.”
Students were asked, “On a scale of 1 to 5, rate how easy it was to correctly correlate visual field deficits to visual pathway
damage” using each of the four modalities (1=easy and 5=difficult). The 3D-printed model received the highest ranking with
59.2% of respondents giving a score of 1 or 2 out of 5. Ranking next were the 2D at 50%, the 3D virtual model at 48.7% and
the 2D drawing model at 43.6%. Students were also asked their level of agreement with the following statements using a 5-
point Likert scale: “The 3D-printed model of the visual pathway would be a useful tool for optometry school education,” and
“The 3D-printed model of the visual pathway would be a useful tool for patient education.” Most students (82.9%) “agreed” or
“strongly agreed” that the 3D-printed model of the visual pathway “would be a useful tool for optometry school education,” and
69.8% felt it “would be a useful tool for patient education.” Students were finally asked to “Rank the visual pathway models in
order of most helpful to least helpful (1=most and 4=least)” and “Rank the visual pathway models in order of most enjoyable to
use to least enjoyable to use (1=most and 4=least).” When asked to rank the various models as either being helpful or
enjoyable to use at the conclusion of the study, the 3D-printed model again came out on top (Figures 6 and 7).
Figure 6. Student rankings for which model was most and least helpful. Figure 7. Student rankings for which model was most and least
Click to enlarge enjoyable to use. Click to enlarge
Discussion
Incorporating 3D interactive models into the vision science classroom enhanced student learning and provided a valuable and
enjoyable experience for the students. The 3D-printed model, in particular, had a strong effect on the student learning
experience. However, engaging students through a variety of media had an even greater impact. The immediate knowledge
gains after the study were higher than expected – equivalent to a full letter grade improvement. It is possible that Assessment
1 was more difficult than Assessment 2. Future studies might aim to randomly administer both exams at the beginning and
conclusion of the study to account for possible variance between the assessments.
Although the student participants were randomly assigned to groups, there was an apparent difference in student performance
at the outset between the 2D/2DD and 3DP/3DV groups (Figure 4A). Although not significant, the noticeable difference may
have skewed the results in unanticipated ways. For example, the initial 3DP/3DV groups may have been composed of more
visual/kinesthetic learners. This may account for their dramatic rise in performance after just their first 3D interaction. It may
also account for why the typical learning environment using 2D images may not have prepared them as well for Assessment 1.
Repetition of this study or including additional details about student learning styles may shed more light on this observation.
The entire study was performed within a traditional lecture hall with tiered seating. Some students reported that an open
classroom environment would have been beneficial, perhaps more reminiscent of an open lab space. The vast majority of
students enjoyed the experience. Importantly, the study showed that even a 20-minute hands-on small group experience can
provide immediate knowledge gains (Figure 4). However, this study did not explore whether or not the immediate knowledge
gains were retained beyond the brief experience. A longitudinal analysis, which was beyond the scope of this particular study,
could be used to ascertain long-term retention in the future.
As noted in the introduction, some previous studies have shown that physical models provide advantages over computer-
generated models, while others have demonstrated effective multimodal experiences can enhance learning.9,18 This study
showed some of both. From an assessment perspective, 3D-printed and virtual models enhanced learning, but completing the
entire series (3DP, 3DV, 2D, and 2DD) had a much stronger impact on improving knowledge recall and comprehension. On the
16You can also read