FINAL SECTOR SKILLS PLAN - Update 2021/ 2022 31 August 2020 - Merseta
←
→
Page content transcription
If your browser does not render page correctly, please read the page content below

FINAL
                 SECTOR SKILLS PLAN
                       Update
                     2021/ 2022

31 August 2020

                                      I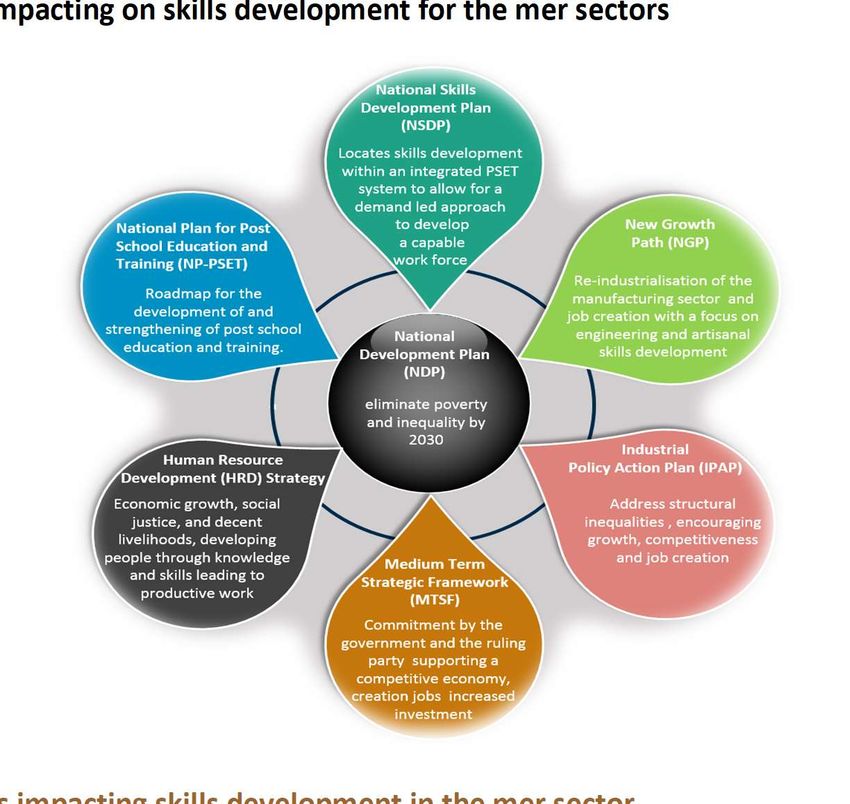
OFFICIAL SIGN OFF
Final Submission of required SSP Documents as per DHET Guidelines for SSP 2021/2022

It is hereby certified that this Final version of the Sector Skills Plan takes into account all the relevant
policies, legislation and other mandates for which merSETA is responsible and accurately reflects the
stipulated submission requirements as communicated by the Department of Higher Education and
Training (DHET).

This submission comprises merSETA Cover Letter, Continuous Improvement Plan and Final SSP which
was developed in accordance with the SSP Framework produced by DHET.

Ms S. Nomvete                                  Sebolelo         Digitally signed by
                                                                Sebolelo Nomvete

                                               Nomvete          Date: 2020.08.29
                                                                13:00:23 +02'00'
Strategy and Research Executive            Signature: ………………………………….

Mr W. Adams                                           Wayne   Digitally signed by
                                                              Wayne Adams

Acting Chief Executive Officer
                                                      Adams   Date: 2020.08.30
                                           Signature: ………………………………….
                                                              14:32:24 +02'00'

Ms K. Moloto                               Signature: ………………………………….
Chairperson of the merSETA

Accounting Authority

                                                                                      31 August 2020

                                                                                                          II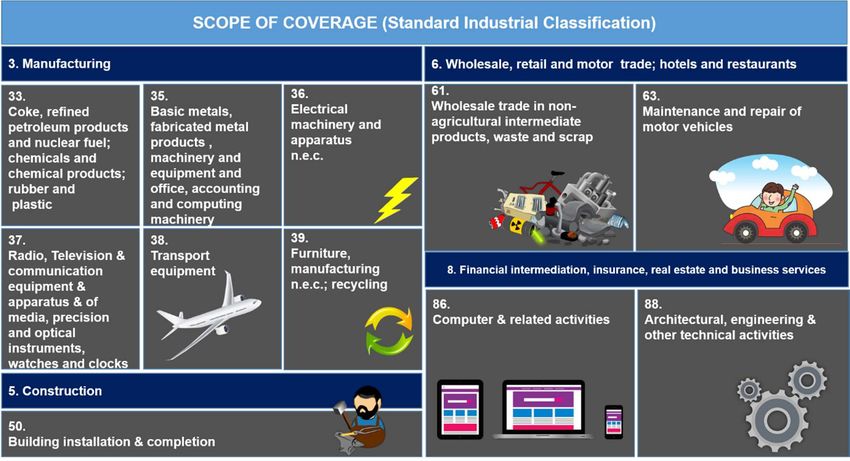
COVER LETTER
31 August 2020
To: Department of Higher Education and Training, Directorate: SETA Support
The Manufacturing, Engineering and Related Services Sector Education Training Authority (merSETA) has
prepared this final submission of the Sector Skills Plan (SSP) comprising this cover letter and the merSETA
Continuous Improvement Plan (CIP) in response to the requirements as set out by the Department of Higher
Education and Training (DHET) in the SSP Guidelines: Requirements for SSP Submission 2021/2022.
This letter serves to outline the processes that have culminated in the submission of the merSETA SSP.
Updates and New Information:
The analysis undertaken for the SSP report draws on a range of information sources. These sources include:
The merSETA’s Workplace Skills Plans. The WSP data includes employer information, Hard to fill
vacancy (HTFV) information, Skills Gaps information, training information and employment
information.
The WSP 2020 collected employee information at individual level which means that the data are no
longer aggregated on OFO. The data in the SSP reflects over 5000 levy paying companies.
WSP data have more stringent data quality controls in place and utilises codes from OFO 2019.
Data and information from primary research studies and data reports developed internally, these are
documented in the research process methods section of the SSP.
Data from secondary sources such as Statistics South Africa, the Higher Education
Management Information System (HEMIS) and industry associations including the
National Association of Automobile Manufacturers of South Africa (NAAMSA), MIBCO, SEIFSA, Plastics
SA and others have been included.
Research reports from national research institutions, government institutions, higher education
institutions, industry publications and the media has also been utilised.
The following outlines the tasks that have been for the Final submission in August 2020 (indicated in draft
submission):
Task completed Comment
a) Econometric Analysis and Interviews in Completed – although it is through a qualitative approach due to
light of COVID-19 volatilities in the market
b) Final Priority Skills List Completed
c) Stakeholder Feedback Incorporated Completed
d) Updates as per DHET feedback session
Completed
from 18 August 2020
Furthermore, this SSP was presented to the merSETA Accounting Authority (AA) for final approval on 24
August 2020. The merSETA notes that the SSP has exceeded the page limit however, the AA has concurred that
this was unavoidable in order to submit a value-add SSP for PSET stakeholders who rely on the merSETA SSP to
make planning decisions for the supply of skills into the mer sector.
Kind regards
Wayne Digitally signed by
Wayne Adams
Adams Date: 2020.08.30
14:33:05 +02'00'
______________________________ _____________________________
Mr Wayne Adams Ms Kate Moloto
Acting Chief Executive Officer: merSETA Chairperson of the merSETA
Accounting Authority
i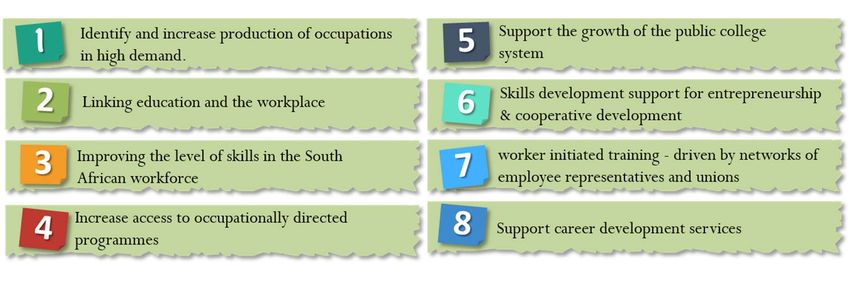
EXECUTIVE SUMMARY
This SSP has been written at a very unique time in the history of South Africa and the world. The COVID-19
Pandemic is a major disruptor on what was already a sector in distress.

A key observation over the past 4 months has been the shift in the economy in line with demands for 4IR in
terms of business processes, the new norm in terms of remote working and the threat of mass unemployment.
Businesses have had to adapt in a very short period of time, adjusting from almost total suspension of production
in lockdown level 5 to production under new health and safety regulations in line with social distancing under
lockdown level 3.

In terms of key drivers for the mer sector, the merSETA has noted opportunities for structural economic
transformation of mer manufacturing industries particularly through reindustrialisation to revitalise the
manufacturing sector, even in a time of COVID-19. Supporting local business development and diversity of
manufacturing activities in line with changing customer needs and expectations will put South Africa on steady
ground in the future. Automation, digitalisation, environmental sustainability and associated new business
models remain key skills drivers. Future skills must be researched more closely for the mer sector. In particular,
the skills requirements in a post COIVD-19 economy must be researched.

To meet industry needs, skills interventions must be tailored and implemented using the best and latest
technologies related to digital platforms and simulations. A key perspective highlighted in the sector profile of
the SSP is the need for bespoke skills interventions for people with disabilities, women, youth, cooperatives,
small and micro businesses located in conditions of poverty and who have barriers to access. The social economy
is highlighted as a key section of society that is expected to expand due to COVID-19 and it is imperative that
the merSETA designs innovative interventions to assist these groups through skills development and bespoke
partnerships with PSET institutions.

Monitoring and evaluation is crucial to the success of all SETA interventions and projects. The merSETA has put
in place effective mechanisms to ensure it meets its mandate. However, there are still some improvements
required to fill the gaps in the system particularly with respect to institutionalising M&E. This will entail reviewing
and putting in place effective mechanisms and tools for monitoring, measuring and evaluating outcomes and
impact. In addition, effective evaluation of programmes, planning processes, research, systems and
organisational processes is required. This will place merSETA in good stead in terms of its mandate and improving
its service delivery.

In order to minimise the impact of the pandemic on its current learners, the merSETA has put in place
mechanisms to strengthen its partnerships and ensure that learner support is enhanced. Furthermore, it is
mobilising its efforts to support enterprises through its partnership with the UIF to expedite TERS funding and
reignite the retrenchment assistance programme (RAP) to assist workers who have become unemployed. Having
identified the social economy as a key area of focus in its strategy, the merSETA is also putting in place plans to
assist entrepreneurs and local businesses to access premises to conduct their business in TVET Colleges and
other private training spaces who can offer up their workshops and premises on a part-time basis.

In addition the pandemic has highlighted the need to enhance efforts in line with a technologically enhanced
education provision system using e-learning platforms, simulation and expanding the notion of learning factories
in lieu of workplaces for workplace based learning.

Overall COVID-19 has expedited efforts to assist the mer sector in the short term, but the SSP highlights that
long term planning and monitoring is also required. Enhanced efforts are required to meet the needs of an
industry in flux and to focus on the skills required assist the sector in regaining its prominence in the economy.

                                                                                                                     ii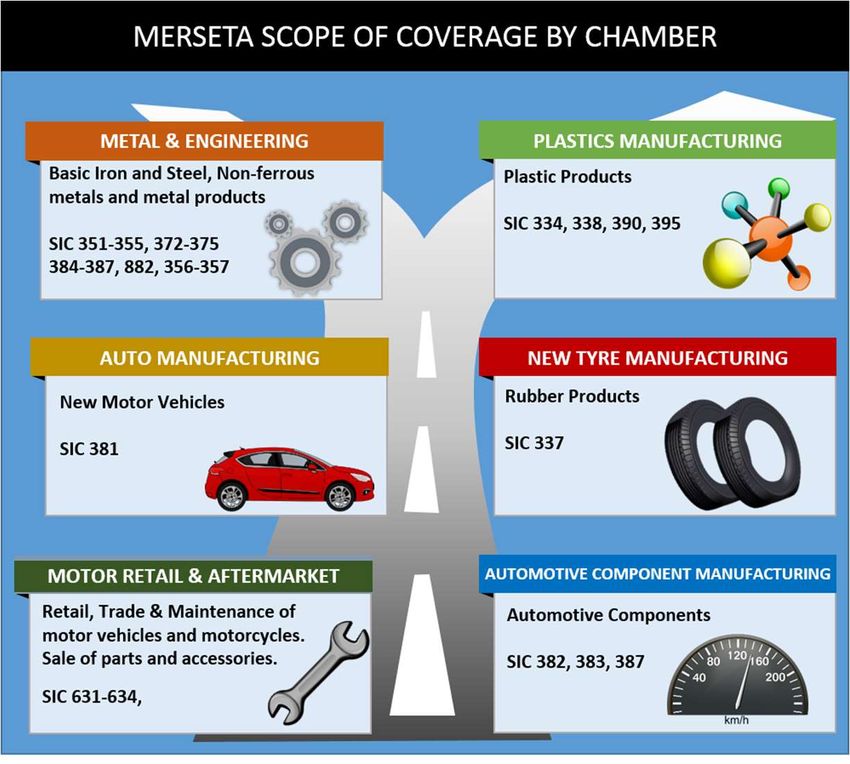
Table of Contents
Official sign off ........................................................................................................................................ II
COVER LETTER .......................................................................................................................................... i
Executive Summary ................................................................................................................................. ii
1.     SECTOR PROFILE.............................................................................................................................. 1
     1.1       Introduction ............................................................................................................................ 1
     1.2       Scope of coverage ................................................................................................................... 1
     1.3       Key Role Players ...................................................................................................................... 5
     1.4       Economic Performance ........................................................................................................... 7
     1.5       Employer Profile.................................................................................................................... 17
     1.6       Labour Market Profile ........................................................................................................... 18
     1.7       The Social Economy .............................................................................................................. 24
     1.8       Conclusion ............................................................................................................................. 25
2      KEY SKILLS CHANGE DRIVERS ........................................................................................................ 25
     2.1       Introduction .......................................................................................................................... 25
     2.2       Factors Affecting Demand and Supply .................................................................................. 26
     2.3       Policy framework affecting demand and supply of skills...................................................... 29
     2.4       Strategic measures to support demand and supply of skills ................................................ 32
     2.5       Conclusion ............................................................................................................................. 35
3      OCCUPATIONAL SHORTAGES AND SKILLS GAPS ........................................................................... 35
     3.1       Introduction .......................................................................................................................... 35
     3.2       Sectoral occupational demand ............................................................................................. 35
     3.3       Extent and nature of supply .................................................................................................. 39
     3.4       Future Skills ........................................................................................................................... 47
     3.5       Sectoral priority occupations and interventions................................................................... 49
     3.6       Conclusion ............................................................................................................................. 52
4      Partnerships .................................................................................................................................. 52
     4.1       Introduction .......................................................................................................................... 52
     4.2       Analysis of existing Partnerships........................................................................................... 53
     4.3       Analysis: Understanding Best Practice and Challeneges in partnerships ............................. 56
     4.4       Towards a Best Practice Model............................................................................................. 59
     4.5       Planned Partnerships ............................................................................................................ 60
     4.6       Conclusions ........................................................................................................................... 63
5      SETA Monitoring & evaluation ...................................................................................................... 63
     5.1       Introduction .......................................................................................................................... 63

                                                                                                                                                          iii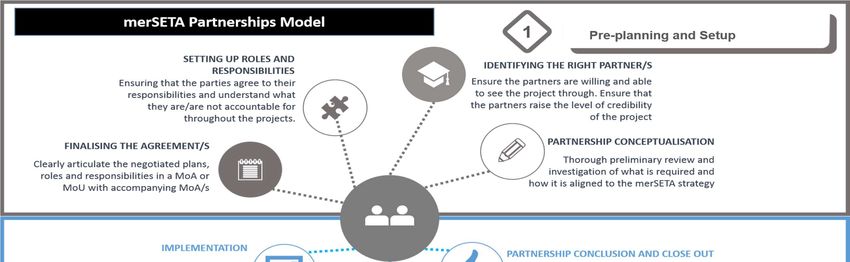
5.2      the merseta approach to m&e.............................................................................................. 64
    5.3      Using Data and information to support research and skills Planning................................... 66
    5.4      Strategic priorities captured in the strategic plan AND annual performance plan .............. 66
    5.5      Measures to strengthen achievement of skills priorities ..................................................... 67
    5.6      Conclusion ............................................................................................................................. 69
6     Strategic Skills Priority Actions ...................................................................................................... 69
    6.1      Introduction .......................................................................................................................... 69
    6.2      summary of findings from previous chapters ....................................................................... 69
    6.3      Supporting Systems for Skills Priorities................................................................................. 70
    6.4      recommended actions in Support of National Strategies..................................................... 71
    6.5      Conclusion ............................................................................................................................. 73
Annexure 1: HTFVs and Reasons by OFO (WSP, 2020) ........................................................................... a
Annexure 2: Examples of successful and unsuccessful partnerships ..................................................... d

                                                                                                                                                     iv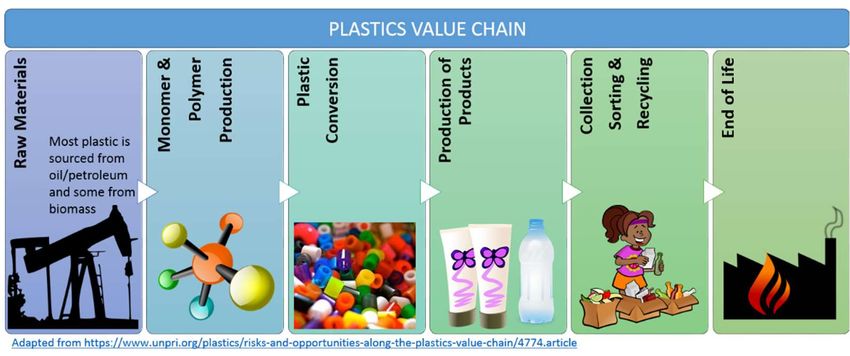
RESEARCH PROCESS AND METHODS

The merSETA carried various research to develop the Sector Skills Plan (SSP) 2021/2022. The research was conducted through a mixed methodology of qualitative and
quantitative techniques that include different sampling techniques. The qualitative research focused on the collection of primary data whilst the quantitative data research
process consisted the analysis of secondary data. The main activities which can be seen as part of this process include, amongst others, the analysis of Workplace Skills Plans
(WSPs), labour market and industry research projects, Chamber research report findings, desktop research, secondary data analyses, and consultations with the SSP
committee, Governance and Strategy Committee and Chamber Committees. The review of these documents assists the merSETA to establish the economic performance and
trends by sub-sector, demographic transformation status and spatial location of employers.

The Workplace Skills Plan forms the largest, most reliable source of information from merSETA stakeholders directly and it is analysed for vacancies, employment information,
unfilled vacancies, and number of companies, Pivotal skills plan, OFO codes and Chamber statistics. The WSP data consists information at individual employee level which
yields more accurate information with respect to occupations and job titles. The data represents information from over 5000 companies. As mentioned in the cover letter,
WSP data further The WSP data includes employer information, Hard to fill vacancy (HTFV) information, Skills Gaps information and training information. Secondary data
information was drawn from sources such as Statistics South Africa, the Higher Education, Management Information System (HEMIS) and industry associations including the
National Association of Automobile Manufacturers of South Africa (NAAMSA), MIBCO, SEIFSA, Plastics SA and others have been included.

Research conducted that feed into the SSP:

                                                                                                   Data Collection    Sample Size/
 Topic                  Nature of Study      Purpose                                               Methods            Data Source          Timeframe
 Workplace    Based     Qualitative          To understand the outcomes of WBL programmes          Telephonic         928 beneficiaries    August 2019 – July
 Learning                                    within the manufacturing, engineering and related     interviews and                          2020
 (WBL)Tracer Study                           (mer) sectors and to explore and document key         online surveys
                                             features, trends, challenges and outcomes of WBL
                                             programmes
                                                                                                   Data Collection    Sample Size/
 Topic                  Nature of Study      Purpose                                               Methods            Data Source          Timeframe
 MerSETA Covid-19       Qualitative          Econometric Analysis and Interviews in light of       Online survey      merSETA              29 April 2020 – 17 July
 Stakeholder Survey                          COVID-19                                                                 Stakeholder          2020
                                                                                                                      database
 Chamber Survey         Qualitative          Chamber reports on COVID-19 to augment                Focus groups       Chamber              August 2020
                                             Chamber information with respect to economics         across six         committee
                                             and skills development                                chambers           representatives

                                                                                                                                                                             v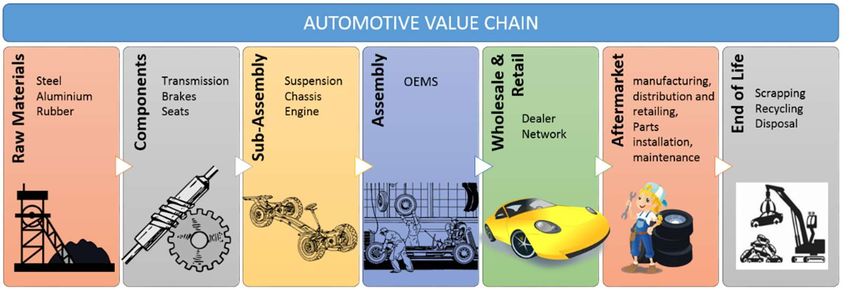
Artisan    Learning    Qualitative     To understand the impact of learning pathways        Stakeholder      Traced learners      November 2018 –
Pathway                                                                                     interviews       from the             August 2020
                                                                                                             merSETA
                                                                                                             database using
                                                                                                             stratified
                                                                                                             sampling
                                                                                                             methods
Retrenchment           Qualitative     To assess the processes, outcomes and impact of      Stakeholder      Data base of RAP     January 2020 –
Assistance                             the RAP to make informed decision making             interviews       beneficiaries and    October 2020
Programme                              internal to the merSETA and advise stakeholders                       key respondents
                                       on the sustainability of RAP and its value in the
                                       sector and the economy
Understanding          Mixed Methods   To understand the economic complexity in the         Stakeholder      merSETA              June 2019 – February
Economic                               mer-sector and assess the skills capabilities        interviews,      Stakeholder          2020
Complexity in the                      needed to diversify the economy and identify key     online surveys   database and
merSETA Space with                     players for achieving better economic outcomes in                     desktop research
a Focus on SMME’s                      terms of job creation, transformation, better
                                       livelihoods and sustainability of the sector
Atlas of Occupations   Qualitative     To provide the learners, workers and skills          Interviews and   merSETA              March 2019 –
for the merSETA                        planners with a reference guide to occupations       focus groups     Stakeholder          December 2020
Sectors                                and jobs that are in demand in the merSETA 6                          database
                                       Chambers
Lived livelihoods:     Qualitative     Understand the way(s) in which education and         Interviews and   40 students and      May 2018 – June
Education                              training can expand sustainable livelihoods gained   focus groups     graduates            2020
advancing                              through entrepreneurship in manufacturing,
entrepreneurial                        engineering and related trades and occupations
livelihoods.
Learning work          Qualitative     To develop new and innovative ways of                Case studies,    TVET Students        July 2018 – March
through a student-                     responding to youth unemployment and work-           interviews and   and desktop          2021
driven association                     based learning among TVET College students           focus groups     research
Understanding          Mixed methods   To understand how the merSETA stakeholders           Workshop,        merSETA              March 2019 –March
Green Partnership                      interpret concepts related to the green economy      stakeholder      Stakeholder          2021
within the                             and how the interpretation changes over time as      interviews       database, training
manufacturing,                         the economy changes.                                                  providers and
                                                                                                             Chambers

                                                                                                                                                         vi
engineering and
related sectors
Retrenched            Qualitative     Find innovative mechanisms that support               Stakeholder      Convenience       July 2019 – July 2020
Workers Feasibility                   retrenched workers, unemployed youth and              interviews and   sampling,
Study                                 workers with disability to access opportunities the   surveys          merSETA contact
                                      labour market.                                                         info
Black Industrialist   Mixed Methods   To understanding the skills development needs of      Stakeholder      merSETA           March 2019 – April
Project                               Black Industrialists such that they become globally   interviews,      Stakeholder       2021
                                      competitive in the context of the 4th industrial      workshop and     database,
                                      revolution                                            online surveys   convenience
                                                                                                             sampling
Chamber SSP           Mixed Methods   To better understand the Skills Development           Workshops,       6 merSETA         15 July 2020 to
Workshops and                         needs of the Chambers and how COVID-19 has            Interviews,      Chambers          present.
COVID-19 Reports                      impacted the sectors.                                 Secondary data
                                                                                            analysis

                                                                                                                                                       vii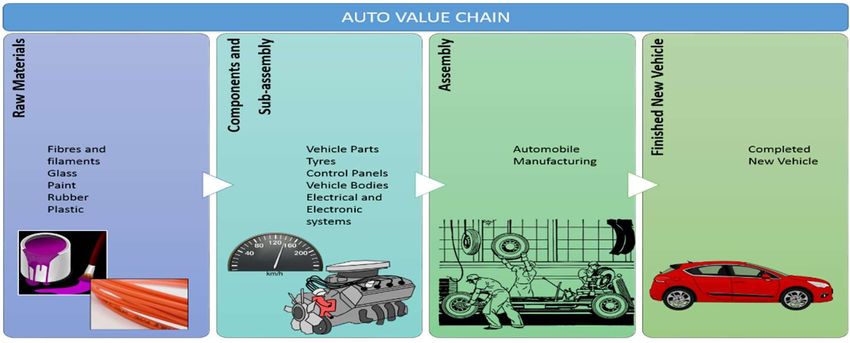
1. SECTOR PROFILE

1.1 INTRODUCTION
This section of the SSP presents the profile of the mer sector. It depicts the scope of coverage in terms
of the Standard Industrial Classification (SIC) of its sub-sectors (Chambers), gives an overview of the
value chains for each of the Chambers and highlights key role players. Furthermore the chapter
profiles the sector in terms of its economic performance and provides a profile of the employers and
employees. The key data sources utilised comprise merSETA WSP data (2020), COVID-19 survey data,
workshop and interview information as well as desk research.

1.2 SCOPE OF COVERAGE
The merSETA comprises 6 Chambers or sub-sectors which describes the industrial activities of
enterprises according to their Standard Industrial Classification (SIC) codes (see Figure 2).

Overall the sectors under the merSETAs’ scope of coverage is demonstrated in Figure 1 classified by
SIC codes at 1 and 2 digit level. In terms of economic sectors the merSETA supports activities in:
manufacturing; wholesale, construction; retail and motor trade; and financial intermediation,
insurance, real estate and business services sectors.

Figure 1: Scope of coverage (Standard Industrial Classification)

The merSETA until recently arranged its sectors into 5 Chambers but as reported in the SSP 2020 –
2025, these have been revised into 6 Chambers after consultation with stakeholders to allow for more
focused efforts on skills required by sector value chains, allowing for critical analysis of skills needs
enabling the clustering of skills and career pathing. To this end the Chamber previously referred to as
the Motor Chamber has been split into the Motor Retail Chamber and the Automotive Components
Chamber. Each of the 6 Chambers are depicted below in Figure 2.

                                                                                                       1
Figure 2: merSETA scope of coverage by chamber
Metal Chamber
The metals sector represents the largest of the sectors under the merSETA scope of coverage, a
simplified value chain is depicted in Figure 3. This value chain consists of raw materials, iron
production, steel production, and refining, manufacturing and final products.
Figure 3: Metals and engineering value chain
The metal and engineering sector entails capital equipment, foundries, transport equipment, metal
fabrication and related sub-sectors. The metal and engineering sector is an important sector in
manufacturing because it produces machinery and equipment used in production and critical to all
forms of manufacturing inputs.
Plastics Chamber
Plastics sector is well developed and is one of the most dynamic industries in South Africa. It is
comprised of polymer producers and importers, converters, machine suppliers, fabricators and
recyclers that caters for both domestic and international markets. The leading markets for plastics in
South Africa are packaging, building and construction, and the automotive industries (DTI, 2019).
Plastics are used in a vast array of different applications such as preserving and protecting food and
2medicines, electronic devices like computers and smartphones, helping make transport more fuel-
efficient. The overall value chain for the sector is represented in the Figure 4 below.
Figure 4: Plastics value chain
New Tyre Manufacturing Chamber
The new tyre sector forms a significant role in the automotive assembly and component
manufacturing sector in South Africa. The different types of tyres produced in the country include
tyres for passenger, commercial, agricultural, mining, construction and industrial vehicles and
associated machinery (Bridgestone, 2019). There are four multinational manufacturers of tyres in
South Africa, which includes Goodyear, Bridgestone, Continental Tyres and Sumitomo Rubber
(merSETA, Supply and Demand Study, 2018). The overall value chain is depicted below.
Figure 5: New tyre value chain
Automotive Sector
The automotive sector is the cornerstone of South Africa’s industrial base which accounts for over 5
% of the country’s Growth Domestic Products. The automotive sector consist of the Original
Equipment Manufacturers (OEMs), tyre manufacturing and motor retail and components companies
that a linked to each other through the automotive production and distribution value chains. This
sector is represented in three of merSETA’s chambers: auto manufacturing, auto component
manufacturing and motor retail and aftermarket.
3Figure 6: Automotive value chain
Auto Manufacturing Chamber
Due to the capital requirements and technical nature of producing vehicles there are only a handful
of Auto OEMs in South Africa, all of which are international brands (merSETA Supply and Demand
Study, 2018). South Africa’s main sites for automobile production are the Eastern Cape, specifically
Port Elizabeth and East London, Gauteng, specifically Rosslyn and Silverton (Pretoria) and KwaZulu-
Natal (KZN), specifically Durban (merSETA Supply and Demand Study, 2018). The Auto Sector has some
of the largest scales of operation of all the sectors. The value chain for this Chamber is presented
below in Figure 7.
Figure 7: Auto manufacturing value chain
Automotive Components Manufacturing Chamber
The Automotive Components Manufacturing Chamber comprises manufacturers that produce vehicle
components, parts and equipment. Components are sold to independent parts sellers and after
service providers. Due to the increased resource needs and skills required to produce some
components (i.e. compliance to meet the standards of Auto OEMs), major employers in this sector
tend to be larger businesses. Components that are manufactured relate to various phases of the auto
value chain from upstream manufacturing of casts, to downstream trimming (merSETA Supply and
Demand Study, 2018).The components manufacturing sub-sector is one of the key sub-sectors in
South Africa’s reindustrialisation and localisation efforts.
4Figure 8: Auto component manufacturing value chain
Motor Retail & Aftermarket Chamber
The motor retail sector is a key part of the automotive sector. It is this sector that is responsible for
the retail sale, maintenance and repair of motor vehicles, parts and accessories. The Motor Retail
value chain is presented below in Figure 9.
Figure 9: Motor retail and aftermarket value chain
1.3 KEY ROLE PLAYERS
The key role players in skills development for the mer sector comprise government, industry bodies,
organised employers, labour unions and civil society. Education and training institutions are the key
mechanism through which skills are provided to the sector in partnership with these key role players.
In addition, the merSETA has recognised the importance of the social economy in its scope of coverage
as organisations in these sectors contribute to the labour market and the economic fabric of society
such as cooperatives, non-governmental organisations, mutual benefit societies and social
enterprises. All these role players have a critical role to play in building an integrated PSET system that
is responsive to the needs of employees, employers and national priorities. This is core to the
implementation of the NSDP.
The diverse skills development needs of the South African economy requires a well-coordinated and
integrated post school system. This system should also be inclusive, and is shaped by 3 key policy
documents adopted for the skills development sector. These are the NPPSET (2019-2030), the White
paper on Post School Education and Training (WPPSE) and the National Skills Development Plan
(NSDP).
5The NNPSET, which derives its mandate from the WPPSET is a roadmap for the development and
strengthening of post-education and training from 2019-2030. The plan acknowledges that we do
not have adequate and diverse education opportunities for all those who leave school (on
completion of grade 12 or earlier). Therefore, the central importance of the plan is the recognition
that more post school opportunities are needed outside the higher education sub-system. The
NPPSET focuses on education in high demand that are needed for economic growth, will provide
opportunities for employment of large numbers of people and support social development priorities.
Therefore PSET system must work collaboratively across all platforms to ensure that the labour
market and the economic trajectory of the country is monitored such that relevant education and
training interventions can be implemented. Taking this into account, the NSDP tasks SETAs with:
• Understanding the demand and signalling the implications for supply;
• Steering the system to respond to skills supply;
• Supporting the development of the intuitional capacity of public and private education and
training institutions.
• Performing system support functions and managing the budgets and expenditures linked to the
SETA mandate.
The role players highlighted below work together within the PSET system to enable the merSETA to
achieve its mandate, they all play and integral part in the supply of relevant skills into the labour
market and through the partnerships approach adopted by the merSETA to ensure the outcomes of
the NNPSET, WPPSET and NSDP are brought to fruition.
Table 1: Key Role Players in PSET
ORGANISATION TYPE NAME OF ORGANISATION ROLE
Department of Higher Education and Training (DHET)
Department of Trade and Industry (DTI) Government’s role is to ensure adequate policies and legislation
are in place to facilitate sustainable economic development as
Government Department of Science and Technology (DST)
well as address social issues.
Departments Department of Environmental Affairs (DEA)
These institutions drive national priorities and skills development
Department of Planning, Monitoring & Evaluation should be rolled out in support of the national vision.
Department of Small Business Development
Higher Education and Training Institutions These training institutions are responsible for skills provision to
Education and TVET Colleges the labour market. They are the key delivery mechanisms for a
Training Institutions differentiated PSET system and should be supported to provide
Community Education and Training Colleges
skills to support economic growth.
The Steel and Engineering Industries Federation of
Southern Africa (SEIFSA)
Automobile Manufacturers Employers Organisation
(AMEO)
Retail Motor Industry Organisation (RMI) Employer organisations represent members in collective
National Association of Automobile Manufacturers bargaining, data and information gathering and skills
Employer
(NAAMSA) development.
Organisations
National Association of Automotive Component and Allied In line with many of the national priorities, these organisations
Manufacturers (NAACAM) are important for the regulation of the sector as well as ensuring
Automotive Industry Export Council (AIEC) the interests of employers and workers.
The South African Tyre Manufacturers Conference
(SATMC)
Plastics South Africa (PlasticsSA)
Its core functions are the accreditation of engineering
programmes, registration of persons as professionals in specified
Professional categories, and the regulation of the practice of registered
Engineering Council of South Africa (ECSA)
Organisations persons.
Professional organisations ensure that professionals are of a high
quality and that their skills are up to date and relevant.
National Bargaining Forum (NBF)
The Labour Relations Act provides for the self-regulation of
Metal and Engineering Industries Bargaining Council
industries through the medium of Bargaining Councils. Bargaining
(MIEBC)
Bargaining Councils Councils deal with collective agreements, solve labour disputes,
Motor Industry Bargaining Council (MIBCO)
establish various schemes and make proposals on labour policies
Bargaining Council for the New Tyre Manufacturing and laws (DoL, 2016).
Industry
Labour Organisations National Union of Metalworkers South Africa (NUMSA)
6ORGANISATION TYPE NAME OF ORGANISATION ROLE
Chemical Energy Paper Printing Wood and Allied workers
Union (CEPPWAWU)
Metal and Electrical Workers Union of South Unions play a significant role in advocating and fighting for
Africa (MEWUSA) worker's rights, skills development and improving conditions of
Solidarity employment and advocating for transformation among other
LIMUSA (Metal Workers Trade Union) things.
United Association of South Africa (UASA)
Motor Industry Staff Association (MISA)
Non-governmental Institutions (NGOs) These organisations play a significant role in communities and
Community Based Organisations (CBOs) assist the state in terms of providing services required by the
Civil Society
community. These organisations are partners for skills
Faith Based Organisations (FBOs)
development within communities.
The key role players identified above play a critical part in realising the outcomes of the NSDP
(Government Gazette, 2019). Many of the organisations are partners with the merSETA in ensuring
that skills are improved, there is adequate career awareness, there are links between education and
the workplace, workers embark on lifelong learning and that there are opportunities to support
entrepreneurship and cooperative development through skills development. A critical component of
the NSDP is the need for community development through the community college system and not for
profit civil society organisations and social change entities. The social economy is integral to
community development, fostering social cohesion, inclusion and solidarity (National Social Economy,
Draft Green Paper, 2019). Compared with other countries, South Africa has a relatively low skilled
workforce, with a smaller proportion of the community achieving a secondary level education.
Statistics show that those with little education are more likely to unemployed than their more highly
skilled counterparts (OECD, 2019). With the onset of the COVID-19 pandemic, many companies in the
mer sector have either shut down or have had to retrench workers or reduce the incomes of workers
(merSETA data, 2020). This means that unemployment levels will increase even further, particularly
among those with lower skills levels. The OECD (2019) have lamented the fact that there exist very
few opportunities for adults to attain additional skills through formal education and training or
through the skills levy system. To this end the role of community colleges becomes ever more
important to support those in the informal and social economies. The role of civil society and the
community colleges will require additional focus and support to assist with skills interventions in a
post COVID-19 economy.
1.4 ECONOMIC PERFORMANCE
Following a decade of economic weakness, there were positive signs that the 2019/20 South African
economy had begun to gain lost ground. This came in the form of policy inertia and uncertainty
previously constraining investment and confidence had begun to lift. After shrinking sharply in Q1 of
2019, the economy rebounded from a low base to record positive growth of 3.1% in the second
quarter. The medium-term outlook for the South African economy is subdued, supported by a gradual
improvement in confidence, more effective public infrastructure spending and a better commodity
price outlook than previously assumed (National Treasury, 2019). However any positive momentum
generated in the early part of the year has been over shadowed by the COVID-19 pandemic, and the
forced lockdown by the South African Government, leaving millions with a restricted earning capacity.
According to the Stats SA business impact survey of the COVID-19 pandemic, the manufacturing sector
has been significantly impacted as a result of the lockdown restrictions. Out of 279 manufacturing
companies responding to the survey (between 30 March and 30 April 2020) 48.4% were temporarily
closed, 6,1% permanently closed, 36,9% continued to partially operate and only 8,6% continued to
operate at full capacity. With regard to manufacturing turnover in the same period (30 March – 30
7April 2020) 91.7% indicated a below normal turnover, while 6.1% had a normal turnover and only 2,2%
recorded an above normal turnover for this period.(Stats SA, 2020).
The survey administered by the merSETA in June 2020 has demonstrated similar results in terms of
the impact of COVID-19 lockdown restrictions. The sample comprised of 530 respondents operating
within the mer sectors. Initially, operations were completely suspended during lockdown level 1 with
operations returning to mostly only partial suspension during lockdown level 3.
Suspension of Operations during Lockdown
100%
26%
48%
69%
50%
69%
18% 49%
0% 5% 12%
Lockdown Level 5 Lockdown Level 4 Lockdown Level 3
No, did not suspend operations Yes, completely suspended operations Yes, partially suspended operations
Figure 10: Suspension of operations due to COVID-19 (n = 530)
With regard to South Africa’s economic outlook for 2020, the Moody’s rating agency recently cut its
forecast for our economy to a 6.5% contraction in fiscal 2020, saying the country’s R500 billion rescue
package will weaken its public finances and constrain government’s ability to provide support to state-
owned firms. With the impact of the weak economy on revenue, the ratings agency now expects the
government to record a budget deficit of 13.5% of GDP in fiscal year 2020 (Money Web, 2020). Based
on these concerns and predictions Moody’s has finally dropped South Africa to sub-investment grade
at Ba1. “This new Ba1 rating reflects downside risks to economic growth and fiscal metrics, that could
lead to an even more rapid and sizeable increase in the debt burden, further lowering debt
affordability and potentially weakening South Africa’s access to funding (Investec, 2020).”
The second survey conducted by StatsSA on the impact of the COVID-19 pandemic on the indicator
“access to financial resources”, 38.3% indicated a decrease in access to financial resources 37.7%
indicated access to financial resources remaining the same, and 30% of businesses indicated they had
applied for financial assistance using government relief schemes. Twenty while nine point seven
percent indicated they can survive less than a month without any turnover, while 55.3% can survive
between one and three months, with 61.9% indicating that they are not confident their businesses
have the financial resources to continue operating throughout the COVID 19 pandemic. Key workforce
indicators were: that most companies had laid off staff to cope with COVID 19 in the short term, and
most were expecting to decrease their workforce size, the highest decrease being in enterprises with
less than 10 employees (48%), followed by those with 10 to 49 employees (33%) and those with 50 to
249 employees (10%).
Results from the merSETA survey however indicated that the biggest impact on employment was
workers being placed on short time and salary cuts. About a quarter of the sample indicated that they
have either retrenched or are considering retrenchment of workers due to the financial strain brought
on by the COVID-19 pandemic.
8Impact on Employment
Short time 297
Salary cuts/no salary 294
Retrenching/threatening to retrench 135
None (but not guaranteed = 10) 79
Leave impacted
Supplemented by TERS
0% 10% 20% 30% 40% 50% 60% 70% 80% 90% 100%
Yes No
Figure 11: COVID-19 Impact on Employment
Overall it would seem that the financial impact of the pandemic has been the highest concern for most
businesses, however they tend to place workers on short time and cut salaries rather than to let go of
workers through retrenchments.
1.4.1 Economic Performance by Sector
In the next sub-sections, we explore the economic performance of the mer sectors under the merSETA
scope of coverage.
1.4.1.1 Metals Sector
The metals sector is arguably the most well-developed and largest manufacturing sector in South
Africa, representing roughly a third of the overall manufacturing of the country (DTI, 2019), and
contributes close to 30% of the manufacturing GDP. In the recent years, the metals sector has
experienced a consistent decline largely due to challenges that include: high volatility in production,
lack of new investment and poor fixed-capital stock, an increasing share of imported intermediate
inputs, a high imports-domestic demand ratio and high dependency on exports, as well as high
interdependence with the mining, construction and automotive industries (SEIFSA, 2019).
The Steel and Engineering Industries Federation of Southern Africa (SEIFSA) has noted the devastating
decline in the manufacturing sector stating that of the -16.3% deceleration, 36.6% was made up of a
deceleration in the sub-components of the metals and engineering sector (SEIFSA, 2020). This comes
on the back of increasing operational costs and a fluctuating exchange rate. Most, if not all businesses
are in survival mode, concentrating efforts on their immediate needs rather than the needs of the
broader sector (SEIFSA, 2020). The overall sentiment in the sector seems somewhat negative.
Consultative workshops in the sector, while not well attended echoed this negativity with the
emphasis on the fact that firms are just trying to survive and focus on production. The merSETA survey
reflects a mix of sentiment across the sector with around 40% indicating that the sector could recover
in a year or more. A third of firms indicated that there is a possibility that they will not recover however
the large proportions of firms indicating that there is a somewhat possibility of recovery indicates an
uncertainty during this time.
9Metal Chamber Business Sentiment n=223
The business will not recover 7% 32% 61%
It will take more than a year to see some recovery 41% 42% 17%
The business will begin to recover in the next 6 to 12… 39% 53% 8%
The business will begin to recover in the next 3 months 16% 51% 33%
0% 10% 20% 30% 40% 50% 60% 70% 80% 90% 100%
Highly Possible Somewhat Possible Impossible
Figure 12: COVID-19 Metal Chamber Business Sentiment
In this tumultuous time, the sector has welcomed the ruling by the high court in favour the DTIC
(Department of Trade, Industry and Competition) on the matter of localisation by supressing the
imports of certain designated products which will spur local production. The sector is however,
discouraged by a slowdown in the Producer Price Index (PPI) for intermediate manufactured goods, a
proxy for selling price inflation in the Metals and Engineering (M&E). This does not seem like good
news for beleaguered businesses in the Metal and Engineering cluster of industries, especially against
the backdrop of increased volatility in imported input prices. Statistics SA data shows that on a year-
on-year basis, the PPI for intermediate manufactured goods slowed from 1.9 % in August 2019 to 0.5
percent in September 2019. Correspondingly, the PPI for final manufactured goods for the broader
manufacturing sector also registered a slowdown of 4.1 % year-on-year in September 2019. This
slowdown in the PPI for intermediate manufactured goods prevents businesses from leveraging on
the improvements in trading opportunities (SEIFSA, 2019).
The local Metal and Engineering environment has been tough for local businesses, caused by a
relatively stagnant demand, rising materials prices, increasing input costs (including electricity costs),
oscillating political will and a generally downward revision of real GDP growth prognostic since 2018.
As a result, companies in the broader manufacturing sector and its diverse Metals and Engineering
(M&E) industry are finding it increasingly difficult to stay competitive, which is reflected in the monthly
economic data such as the producer price index, the business expectation index and the Absa
purchasing managers’ index (PMI), which has largely been in the stagnation since December 2018.
The sector exported R259 billion’s worth of output in 2019 (a decrease of R8 billion from 2018) and
imported R378 billion’s worth of products (an increase of R8 billion), resulting in an expanded trade
deficit of R118 billion (State of Metals and Engineering Sector 2020-21, 2020).
The continuous influx of imported steel into the domestic economy remains a great concern for
companies operating in the metals and engineering sector, in spite of a relative reduction in import
volumes, owing to the protection measures for the upstream steel industry announced by the
Government, import penetration remains a cause for concern. Although the establishment, through
interest rate subsidy, of a R1.5 billion downstream steel industry competitiveness fund over three
years has relieved some pressure from a number of structural factors (SEIFSA, 2019).
Steel production dipped and domestic consumption was generally low over lockdown levels 5 to 3,
while administered prices of raw materials have steadily been increasing (Steel and Engineering
Industries Federation of Southern Africa (SEIFSA). The South African steel industry “suffers from
structural problems” that existed before COVID-19, with “a slow and gradual degradation of the
10country’s economic environment” making the local steel industry increasingly uncompetitive
(Engineering News, 2020).
The current state of the steel industry calls local policymakers and decision makers to promote the
concept of buying local and encouraging all State-owned businesses to adhere to using products and
inputs designated for local production. Given the COVID-19 context and existing challenges facing
companies in the local steel value chain, there is clearly a need to rethink relevant policy measures in
the steel industry in line with the ‘new normal (Engineering News, 2020).
1.4.1.2 Plastics Sector
The plastics sector has come under heavy criticism lately due to the negative effects waste plastics
have had on the environment. The world seems to be advocating for a “life without plastics”. It is
specifically single use plastic products that are seen as the major contributor to the negative
environmental impact (News24, 2019). South Africa has also seen this culture being implemented in
many of its major shopping malls opting for “plastic free” bags (PlasticsSA, 2019). In light of this drive
to reduce the effects of plastics, Japan and South Africa signed an agreement (August 2019) to fund a
plastic recycling initiative termed MARINE (Management of waste, Recovery of marine litter,
Innovation and Empowerment). This initiative forms part of a larger Osaka Blue Vision, which seeks to
reduce ocean plastic litter to zero by 2050 (PlasticsSA, 2019).
Plastics South Africa has emphasised the need for government to become more involved in the
implementation of proper waste management strategies. In addition the sector has embraced the
circular economy, producing products with a strategy for recycling, repurposing and up cycling (design
for recycling). The sector body Plastics SA believes that working in partnership with government,
producers and retailers, new technologies can be put in place to change behaviours and reduce the
impact that plastics has had on the environment. This in turn also produces the opportunity to develop
new skills for new opportunities in the sector. Efforts put in to the recycling campaign have seen South
Africa surpass the recycling rate of Europe. These efforts have resulted in work for 58 100 workers
comprising waste pickers, entrepreneurial collectors and other formal jobs (Plastics SA, 2019). The
sector has really rallied behind finding sustainable solutions to mitigate the problems and also
promote the responsible use of plastics for the good of the economy.
Challenges experienced by the sector include the lack of advanced manufacturing practices and the
slow technological upgrading, skills shortages and the lack of downstream focus on R&D efforts. The
industry needs to focus its attention to the newly emphasised “circular economy” which should
become the plastics industry’s new roadmap to sustainable growth (merSETA Supply and Demand
Study, 2018). Previously sustainability growth was limited to recycling waste and its methods, however
with a circular economy emphasis, the focus is on adapting products and processes before plastic even
becomes waste.
Furthermore, the competitiveness of the local industry has been negatively impacted by factors such
as the impact of the COVID-19 pandemic, cost of polymers, proximity to markets, relatively small local
and regional market, and electricity pricing as well as inland location of production facilities in the case
of exports. The competitive landscape is also changing dramatically with international players
establishing themselves in the South African market (as is evidenced by the disposal of Astrapak to
RPC plc, Boxmore to Alpla, and Nampak Flexibles to Amcor and Afripack to Constantia Flexibles).
Therefore, a number of local players are now looking to position and strengthen themselves as this
situation is expected to continue.
11Since the COVID-19 pandemic, the plastics manufacturing industry has seen a dramatic increase in
demand for products across the sector. During the lockdown period it was essential to have workers
in their manufacturing facilities in order to maintain an uninterrupted supply of products. Business
sentiment in the sector seems positive with about half of respondents indicating that the sector could
recover in 6 to 12 months (figure 13). Consultation with the sector has revealed that whist the portion
of the sector that is producing PPEs is doing extremely well, this is only over the short term to medium
term. The packaging sector is doing well, similarly, the bottling sector (consumer products and drinks)
is doing well due to the ban on alcohol sales and a shift in demand to soft drinks. The sector
manufacturing for irrigation is performing relatively well as it is closely linked to the agricultural sector
that has been producing throughout the lockdown period. Plastic piping, which is closely linked to the
construction industry is under severe pressure and also subject to retrenchments, lay-offs and short
time. The recycling value chain is negatively affected and will not recover this year.
Plastics Chamber Business Sentiment n=23
The business will not recover 2% 40% 58%
It will take more than a year to see some recovery 27% 62% 11%
The business will begin to recover in the next 6 to 12… 47% 49% 4%
The business will begin to recover in the next 3 months 16% 56% 29%
0% 10% 20% 30% 40% 50% 60% 70% 80% 90% 100%
Highly Possible Somewhat Possible Impossible
Figure 13: COVID-19 Plastics Chamber Business Sentiment
The plastics industry provides employment to an estimated 60 000 workers, only some of them have
jobs that allow them to work from home. Manufacturers of basic and essential plastic packaging,
hygiene and health products needed a steady supply of raw materials during the lockdown, which saw
many complimentary industries operating over the lockdown period. Special care was taken to ensure
they produce their products in a hygienic environment and that their workers are also protected from
possible COVID-19 infections (Southern African Polymer Technology, 2020)
Some of the products plastic manufacturers are capable of producing to assist in the fight against the
COVID-19 pandemic, include ventilators, face masks, various equipment for healthcare workers,
containers and bottles for hand sanitizers and soaps, infection control bags, clinical waste bins, anti-
infection soluble laundry bags, and polythene sheeting. This does create opportunity for plastic
manufacturers in our weakening economy (Plastics SA, 2020)
1.4.1.3 Automotive Sector
The automotive industry contributes around 6.4% to GDP, comprising 4.0% manufacturing and 2.4%
retail (Automotive Export Manual, 2020). In 2019, the industry recorded investments of R7.3 billion
by the seven OEMs with further commitments of R40 billion up to 2025. The industry accounts for
29.9% of the country’s manufacturing output and 14.3% of South Africa’s total exports (Automobil,
November 2019).
The impact of COVID-19 has had devastating effects on the entire automotive value chain. In the
second quarter of 2020, new car sales decreased by 64.8% compared to the same time period in 2019
(NAAMSA, 2020). In terms of employment, the sector shed just under 500 jobs to record a total of
12around 25 900 positions. The lockdown measures instituted had a negative effect on the industry both
locally and globally. While there have been predictions that the sector should see recovery in the
second half of 2020, there have been predictions that could drop to the same levels seen 20 years ago
(NAACAM, 2020). This view is supported by the findings of the merSETA COVID-19 firm survey. Overall
the sentiment across the OEMs that submitted information was that it would take up to a year or
more to see some recovery in the sector (figure 14), in the consultative workshops, employers felt
that it would take around 2 years to recover to pre-COVID-19 conditions.
Business Sentiment Auto Chamber, n=8
The business will not recover 50% 50%
It will take more than a year to see some recovery 50% 25% 25%
The business will begin to recover in the next 6 to 12… 50% 50%
The business will begin to recover in the next 3 months 50% 50%
0% 10% 20% 30% 40% 50% 60% 70% 80% 90% 100%
Highly Possible Somewhat Possible Impossible
Figure 14: COVID-19 Auto Chamber Business Sentiment
NAAMSA announced that in March 2020, the domestic new vehicle sales declined sharply by 29,7%
and total vehicle exports were also negatively affected with a decrease of 21,5%, compared to the
corresponding period last year (March 2019). The effects of COVID-19 are further compounded by
persistent and recessionary pressures our economy in the recent past. During current COVID-19
uncertainties production investment initiatives activities have been halted.
Even though all steel-using sectors are affected by the lockdown measures, the mechanical machinery
and automotive sectors are highly exposed to a prolonged demand shock, as well as to disruption in
global supply chains (Automotive Industry Development Centre (AIDC, 2020). Taking into account
anticipated 6.1% decline in South Africa’s economic growth owing to the COVID-19 pandemic, new
vehicle sales will probably fall by 20% and 23% in 2020. Local vehicle production will probably track
this decline (Engineering News, 2020)
According to Engineering News (2020) government’s assistance is required. Currently South Africa’s
Automotive Masterplan, as governed and incentivised in the Automotive Production and
Development Programme, aims to boost growth and create jobs by more than doubling yearly vehicle
production to 1.4-million vehicles by 2035, and to increase locally manufactured components content
on these vehicles from the current 39% to 60%. However, currently OEMs and components
manufacturers will this year “likely not be able to adhere to the manufacturing and employment
requirements to qualify for certain incentives”.
1.4.1.4 Motor Retail and Aftermarket Chamber
The motor retail and aftermarket sector is a large employer in South Africa, employing around 360 000
people (QES – motor trade, 2018). According to the StatsSA motor trade sales data, sales decreased
49.1% in the second quarter of 2020 when compared to 2019. Sale of new vehicles reduced by over
50% contributing 15.7% to overall reduction, used vehicle sales fell by 51% contributing 9% points and
accessory sales fell by 40% contributing 6.8% points. The COVID-19 pandemic has negatively affected
the motor retail and after market sectors. The lockdown period has fundamentally altered consumer
behaviour with respect to driving and maintenance of vehicles. With the economy having ground to a
13You can also read