OR - FSEG COVID-19 Mitigation Analysis Using CFD and Agent Based Models
←
→
Page content transcription
If your browser does not render page correctly, please read the page content below
FSEG COVID-19 Mitigation Analysis Using CFD
 and Agent Based Models
 Prof Ed Galea
 and
Dr John Ewer, Mr Lazaros Filippidis, Mr Ian Frost, Dr Angus Grandison,
Dr Fuchen Jia, Dr Peter Lawrence, Prof Mayur Patel, Dr Zhaozhi Wang

 Fire Safety Engineering Group
 University of Greenwich
 UK

 OR 2m 2m

 Ventilation flow

 2m

 http://fseg.gre.ac.uk 27th May 2021 e.r.galea@gre.ac.uk
 FSEG, The University of Greenwich 2m
FSEG: Modelling safety and security
- FSEG was Founded in 1986 by Prof Galea in
 response to the Manchester Airport B737 fire.
- Today it consists of 20 researchers including:
 - fire engineers, CFD specialists, psychologists,
 mathematicians and software engineers.
- Research interests include the mathematical Behaviour experiments
 modelling and experimental analysis of:
 - evacuation dynamics in complex spaces,
 - urban-scale evacuation,
 - pedestrian dynamics in complex spaces,
 - combustion and fire/smoke spread,
 - fire suppression,
 - security EXODUS agent model
- Application areas include:
 - aviation, buildings, maritime and rail.
• Developed EXODUS and SMARTFIRE tools
 • Both under continual development since 90s
 • Extensive validation history
 • Users in over 35 countries SMRATFIRE CFD fire model
 http://fseg.gre.ac.uk 27th
 May 2021 e.r.galea@gre.ac.uk
 FSEG, University of Greenwich
THREE ROUTES TO SARS-CoV-2 INFECTION
• (1) Large Droplets: large respiratory droplets (> 100 µm) follow ‘cannon
 ball’ projectile trajectories and fall to the ground within ~ 2m in a few
 seconds – susceptibles within ~ 2m can inhale large falling droplets or they
 can impact eyes.
 • Hence recommended: 2m physical distance, avoid directly facing
 someone in queues or seating in offices, face shields, partial screens and
 one way flows.

 2m < 2m < 2m
 2m

• (2) Fomit infection: Associated with large droplets that fall onto surfaces
 contaminating them. Touching the surface and then your face, mouth or eyes
 causes infection.
 • Hence recommended: hand hygiene.
 • However, CDC now claim only 0.001% IP
 http://fseg.gre.ac.uk FSEG, The University of Greenwich e.r.galea@gre.ac.uk
Simulating imposed physical distancing within EXODUS (ABM)
 • EXODUS ABM has been modified to take into consideration agents efforts to
 maintain physical distancing, which is not always successful - circle radius = 1m.
 • Results in less crowding at exit point, time to empty space increased by 19%.
 • Can be used to assess impact on capacity, flow and level of service.

 Without Physical Distancing
 Agents attempt to maintain 2m Physical Distancing

• (3) Airborne infection: small respiratory droplets (< 100 µm). These aerosols can be
 dispersed throughout the space, carried by thermal currents, ventilation AND wake
 flows. Aerosols can remain suspended in the air for hours even after source has left.
 • Hence recommended: face coverings and high ACH.
• ABMs, on a building scale, ignore aerosol Ventilation flow
dispersion, the impact of air-conditioning
systems and the impact of agent generated
wake flows – questionable value for assessing
IP and mitigation strategies.
 http://fseg.gre.ac.uk e.r.galea@gre.ac.uk
 2m

Aerosol dispersion using CFD - SMARTFIRE
o Rapid prototype development of new modelling capabilities for aerosol dispersal based on
 core SMARTFIRE CFD fire simulation software;
 • RANS, with k-eps turbulence model, with Lagrange water mist model including
 particle/air momentum coupling, particle drag and evaporation.
o Enhancements include capability to:
 o Represent aerosol dispersion as evaporating particles or passive scalar.
 o Simulate recirculating HVAC with filtration and wake flows due to dynamic
 movement, through RNG K-eps and Immersed Boundary Method.
 o Couple CFD with Wells-Riley equation to determine infection probability (IP)
 based on CFD predicted aerosol dispersion, = 1 − − /
Model Verification and Current Applications:
o Attempt to verify model using analysis of critical indoor infection risk scenarios/events.
o Explore diverse indoor environments to evaluate IP and investigate mitigation strategies.
Publications:
o ‘Inflight Transmission of COVID-19 Based on Experimental Aerosol Dispersion Data’, Z
 Wang, E R Galea, A Grandison, J Ewer, F Jia, Journal of Travel Medicine, 2021;
 https://doi.org/10.1093/jtm/taab023
o ‘CFD Based Analysis of COVID-19 Infection Risk on Chinese G-Trains’. In preparation.
o ‘Source Terms for Benchmarking Models of Aerosol and Droplet Disease Transmission’,
 M. Stettler et al., in review, Journal of the Royal Society Interface, 2021, (RAMP Task 7)
 http://fseg.gre.ac.uk 27th May 2021 e.r.galea@gre.ac.uk
 FSEG, University of Greenwich
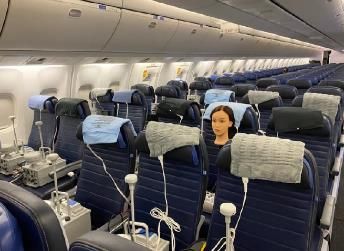
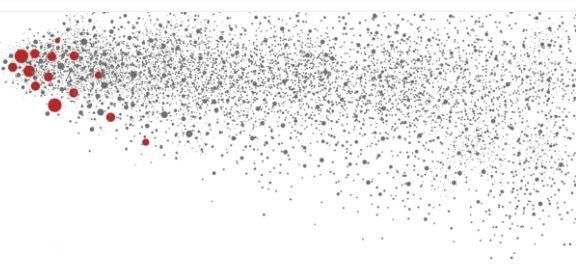
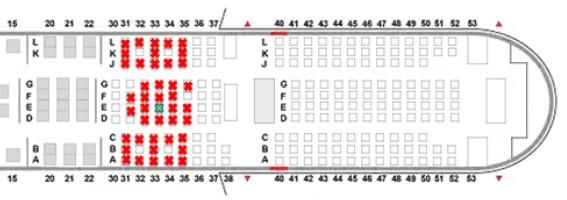
Inflight Transmission of COVID 19
 Index source Monitor locations

 TRANSCOM/AMC, D Silcott 2020

 Non-uniform measured Breathing Zone Penetration (BZP)

Modified Wells-Riley Model Experimental Observation:
 Aerosol rapidly diluted, min
 reduction, 99.7% (pax near
r: measured individual BZP (inhaled/released), q: quanta source source); and average
 reduction of 99.99% for the
 40+ monitored points in each
- Max individual IP (without masks) for 2-hr flight, varies from
 cabin section
 4.5% for ‘Mild Scenario’ to 60.2% for ‘Severe Scenario’, with
 average IP from 0.1% to 2.5%;
- C/W statistical study based on data from 291 flights (M. Concluded: Aerosol
 Hu, 2020 ): max individual IP 10.1% and average IP 0.7%; exposure risk is
- For 12-hr flight, max IP varies from 24.1% to 99.6% with minimal even during
 average IP from 0.8% to 10.8%. long duration flights, but
- Face mask can reduce average IP by 73%, but removing for 1 typically highest in
 hr meal service increases IP by 59%. index patient row
 http://fseg.gre.ac.uk 27th May 2021 e.r.galea@gre.ac.uk
 FSEG, University of Greenwich
Verification Case: Actual COVID 19 Transmissions on G - Train

 Floor configuration of typical G-train carriage Two typical ventilation configuration

 Statistical Analysis by M Hu et al., 2020
 • G-train—high speed trains in China; typical carriage: 17 rows with 5 seats abreast ;
 • Two typical ventilation configurations: Inlet: ceiling, Outlet: floor-level side-walls
 (44 ACH) and Inlet: side-walls under racks, Outlet: seat bottoms (24 ACH);

 o Note: ventilation rates for UK trains are much lower, 8-10 ACH.
 • Involving 2,334 index patients and 72,093 close contacts (seated within three rows
 of index) with co-travel times of 0–8 hours from 19 Dec 2019 to 6 Mar 2020;
 • The attack rate for paxs seated within 3 rows and 5 columns of an index patient
 varied from 0 to 10.3%;
 • Maogui Hu, et al, "The risk of COVID-19 transmission in train passengers: an epidemiological and
 modelling study," Clinical Infectious Diseases, no. https://doi.org/10.1093/cid/ciaa1057, 2020.

 http://fseg.gre.ac.uk 27th May 2021 e.r.galea@gre.ac.uk
 FSEG, University of Greenwich

G-train CFD Aerosol Dispersion Model
Investigation Methodology: Coupled CFD + Wells-Riley Model
• Respired aerosol droplets modelled using a scalar gas release;
• Predicted CFD scalar concentrations are first converted to quanta concentrations;
• Individual IP are derived using modified WR model and simulated local quanta concentrations;

CFD Simulations
• Seats/Paxs: represented as obstacles, paxs have 50 W/m2 surface heat release rate;
• Two saloon ventilation scenarios considered:
 o Scenario 1: Top inlet with a ventilation rate of 5500 m3/h (44 ACH);
 o Scenario 2: Side wall inlets with a ventilation rate of 4000 m3/h (24 ACH).
• Ventilation System: mass ratio of recirculated to dumped air in Scenario 1 / 2 is 0.66 / 0.59
• Ventilation filtration efficiency: 20%;
• One index patient per simulation per scenario.
 • Five different seating locations per
 scenario, Seat 6A, 6B, 6C, 6D and 6F;
 • Five simulations per scenario.
• Quanta generation rate: 14 quanta/h is assumed.
 Representative of resting infectious individuals
 (Wang et al 2021)
 http://fseg.gre.ac.uk 27th May 2021 e.r.galea@gre.ac.uk
 FSEG, University of Greenwich
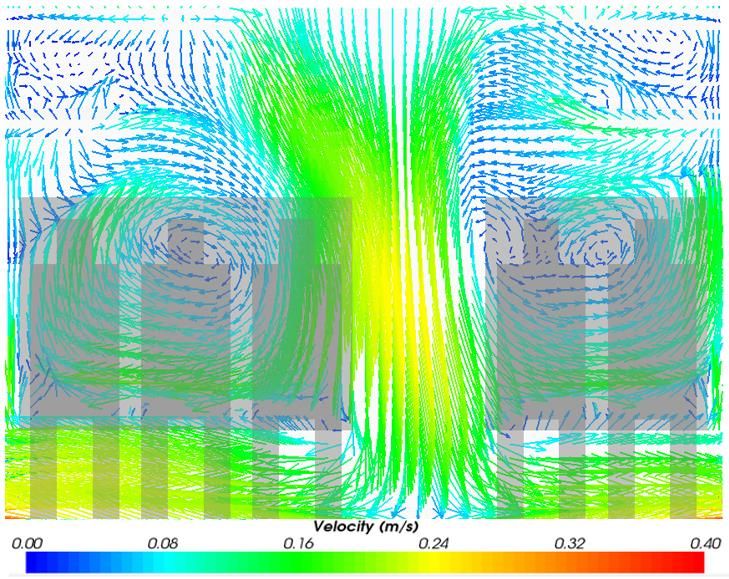
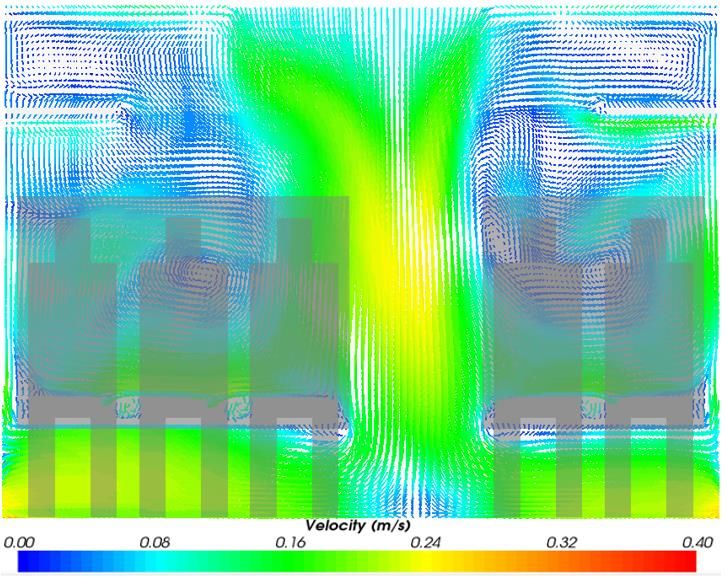
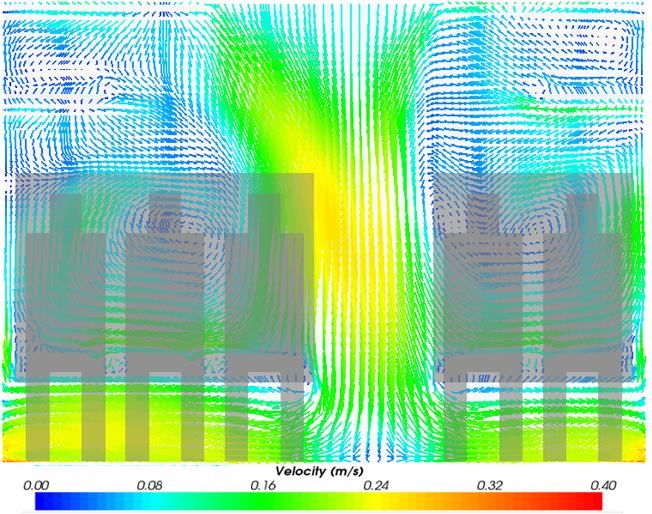
G-train CFD Aerosol Dispersion Model
CFD Simulations
• Mesh sensitivity analysis: coarse, medium and fine cases, with computational cells of
 1,095,444 (378×46×63), 2,245,320 (378×60×99) and 5,091,240 (399×88×145) respectively.
• The medium mesh is applied in all CFD simulations; a quasi-steady-state reached within
 990s, requiring 60 hours of computation per simulation.

 Velocity distribution in the cross plane for the Coarse, Medium and Fine mesh
 cases

 Simulated velocity and infection probability along lines for the Coarse, Medium and Fine mesh cases

 http://fseg.gre.ac.uk 27th May 2021 e.r.galea@gre.ac.uk
 FSEG, University of Greenwich
G-train – Estimation of COVID 19 Infection Risk
Modified Wells-Riley Model

Where:
• p is infection probability; x is probability of a passenger (or proportion of population) wearing a
 face mask; c is quanta concentration in the target volume derived from a CFD simulation;
 a is mask efficiency for index, b is mask efficiency for susceptible; t is exposure time;

• q: 14 quanta/h; x: 40%; a: 50% and b: 30% respectively; t =1, 2, …, 8 h

• Quanta concentration distribution rapidly reaches a quasi-steady-state after about 900 s.

• Apart from end effects, seating row number has little impact on distribution.
 • Seat row location for study based on seat row 6.

• For verification study, results for each scenario are based on a weighted average of index
 patient located in seats 6A, 6B, 6C, 6D, 6F where weighting derived from provided data.
 • Model predictions involve a simple average of results from Scenario 1 and 2.

• For the general study, simple average of the 5 seat locations across both scenarios is
 presented unless otherwise stated.

 http://fseg.gre.ac.uk 27th May 2021 e.r.galea@gre.ac.uk
 FSEG, University of Greenwich
G-train verification study, estimation of COVID19 IP
 Maximum infection probability
 • 10.3% at seat locations adjacent to index patient as reported by M Hu, 2020;
 • 14.7% predicted by simulations (average for 10 index cases in the two ventilation scenarios)
 Highest/lowest infection probability (average travel time 2.1 hours)
 Reported infection probability: 0.28% 0.41% 0.34% 0.34% 0.27%

 Estimated infection probability: 0.56% 0.70% 0.55% 0.63% 0.53%
 • Infection probability as function of distance to index patient and exposure
 time.

Same seat row as the index patient (symbol: reported data) Three seat row away from the index patient
 http://fseg.gre.ac.uk 27th May 2021 e.r.galea@gre.ac.uk
 FSEG, University of Greenwich
G-train – Estimation of COVID 19 Infection Risk
Asymmetry in quanta distribution and IP in Scenario 1 with index patient in 6C
• Very high quanta conc up to 2 seat rows behind index patient;
• Lower quanta conc in seat row ahead of index patient;
• Seat block with index patient has significantly higher quanta conc than seat block opposite;
• Asymmetry of quanta distribution results in asymmetry in IP.
• IP of 0.5% at locations far from the index patient is due to recycled quanta.
• Conventional WR model with well mixed assumption CANNOT reproduce these observations.
• Questionable validity of rigid 2m separation and concept employed by agent-based models.

 Index 6C, Ceiling level air supply

 Quanta concentration distribution excluding recycled background distribution

 IP (%) distribution for 8-hour G-train travel Scenario 1 (recycled quanta contributes 0.5%)
 http://fseg.gre.ac.uk 27th May 2021 e.r.galea@gre.ac.uk
 FSEG, University of Greenwich
Exploring various non-pharmaceutical mitigations
• Model used to explore a range of mitigation strategies and impact of ventilation conditions.
 • Unless stated otherwise, results are for average of Scenario 1 and 2 with 20% FE,
 8 hr exposure, 63% recycled air and averaged over the 5 index seating locations
• Ventilation filtration efficiency (FE):
 • Increasing FE to 100% results in negligible decrease in max IP, 15.8% compared with
 16.1% for the 20% FE case, however,
 • Average IP reduces from 1.21% to 0.69% i.e. 1.02 secondary infections to 0.58.
• Ventilation rate (VR): (based on Scenario 1 and Index in 6C only)
 • Reducing VR from 44 ACH to 14 ACH reduces the max IP from 25% to 11%.
 • However, average IP increases from 1.4% to 2.6% i.e. 1.1 secondary infections to 2.2.
• Impact of Mask Wearing (MW):
 • With 40% paxs wearing surgical masks, average IP 1.21%, 1.02 secondary infections
 • Increasing MW to 90%, average IP and secondary infections reduce to 0.7% and 0.6.
 • With 90% MW and high efficiency masks (90%), average IP and secondary infections
 drop significantly to 0.06% and 0.05.
• Seat Blocking Strategies: (assuming 1 Index per 85 paxs)
 • 3 seat blocking strategies explored, reducing paxs from 85 to 51, 45 and 27.
 • Note: IP dependent on location of index patient.
 • Most effective involves occupying A, C and F seats in odd rows
 • Reduces number of paxs per saloon from 85 to 27
 • Reduces average IP from 1.21% to 0.63% i.e. 1.02 secondary infection to 0.16.
 • However, must run 3.15x as many saloons.
 • MOST EFFECTIVE STRATEGY IS TO ENSURE 90% OF PAXS WEAR HIGH
 EFFICIENCY MASKS (CORRECTLY).
 http://fseg.gre.ac.uk 27th May 2021 e.r.galea@gre.ac.uk
 FSEG, University of Greenwich
Exploring the impact of vaccinations
• Consider G Train (average of Scenario 1 and 2), 40% pax wear face masks; assuming:
 • Index patient is not vaccinated,
 • For the B.1.617.2 variant, recent (22 May 2021) PHE data suggests for any vaccine
 • 51% of the pop have received 1 vaccination dose (effectiveness of 33.5%)
 • 30% of pop have received 2 vaccination doses (effectiveness of 80.9%);
• The average infection probability for the partially vaccinated population ( ) is related to the
 previously calculated infection probability of the non-vaccinated probability ( ) by:
 1 dose 2 doses 0 dose
 = × 0.51 × 1 − 0.335 + 0.3 × 1 − 0.809 + 0.19 × 1 = 0.586
 o Average Max IP (irrespective of location) is reduced from 16.0% to 9.4%;
 o Maximum average IP is reduced from 8.9% to 5.2% ;
 o Average IP and secondary infections reduced from 1.21% to 0.71% and 1.02 to 0.60;
• Furthermore, in addition to reducing the IP, the risk of likely hospitalisation after vaccination
 is reduced by ~90%. (PHE)

 Without vaccination

 With vaccination

 Infection probability (%) distribution for 8-hour G-train travel with/without vaccination
 http://fseg.gre.ac.uk 27th May 2021 e.r.galea@gre.ac.uk
 FSEG, University of Greenwich
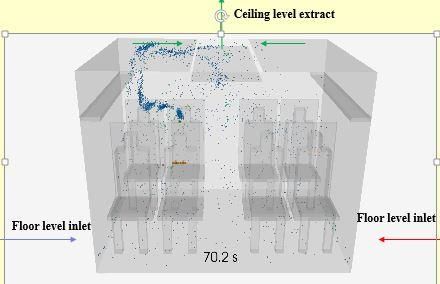
Demonstration of SMARTFIRE Particle Model for Respiratory
 Particles

• 10 ACH, approximately 67% of air-conditioned air is recycled
• Train filtration system generally low quality i.e. not HEPA filters – 20% filtration efficiency
• Return air contains respiratory aerosols uniformly seeding the environment.
• The droplet/aerosol source is represented by a sinusoidal breathing model (Gupta et al,
 2010)
• The respiratory droplets/aerosols follow the “BLO” size distribution of Johnson et al. (2011)

 http://fseg.gre.ac.uk FSEG, The University of Greenwich e.r.galea@gre.ac.uk
Immersed moving boundary condition with droplet dispersal
• Is 2m spacing adequate in corridors? ABM implicitly assume this is acceptable.
• Each figure is separated by 2m, height and walking speeds are identical.
• Lead figure is the Index Patient, 3 following figures are constantly bathed in aerosols.
• Staggered walking configuration significantly reduces exposure to respired aerosols
• Note the persistence of the aerosol cloud.
 4 3 2 1
 Single file with 2m separation
 Side view

 4 3 2 1

 Single file with 2m separation
 Plan view

 2 1

 Diagonal formation with 2m separation
 Plan view
 3
 4

 http://fseg.gre.ac.uk FSEG, The University of Greenwich e.r.galea@gre.ac.uk
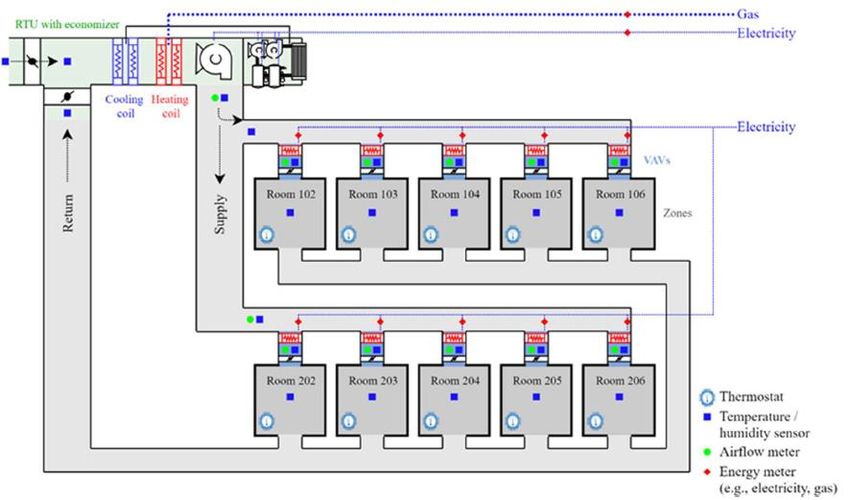
Potential Infection Risk Via Air Conditioning System
Aerosol Experiment (Chien et al 2021)
medRxiv preprint doi: https://doi.org/10.1101/2021.02.25.21252239
• The facility is a typical two-floor (10 rooms) office building;
• A central HVAC system provides variable air volume with ventilation rates between 5.4 ACH
 and 9.3 ACH for rooms;
• There is a exhaust fan in the core room;
• The supplied air includes 90% recycled air from the 10 rooms as seen in the figure below;
• The flow rate is 11 L/min from the aerosol generator but the particle generation rate was not
 measured; (most particles are less that 0.5 µm);
• Two experiments undertaken involving all room doors open or closed;
• Heaters are set to emulate human
 occupancy but the locations and heat
 release rates are not reported; Supply
• Particle mass concentrations measured at
 various locations;
• In the experiment with closed doors, the
 particles mass concentrations under the
 diffuser of the HAVAC suppliers are 17
 Return
 μg/m3 in the source room and 2.5 μg/m3 in
 non-source room, with a ratio of 6.8
 Centralised HVAC system to supply and return air

 http://fseg.gre.ac.uk 27th May 2021 e.r.galea@gre.ac.uk
 FSEG, University of Greenwich
IP Within Air Conditioned Buildings
Coupled CFD+Wells-Riley Room 104 Source Room 102
Aerosol Experiment (Chien et al 2021)
medRxiv: https://doi.org/10.1101/2021.02.25.21252239
• Preliminary CFD analysis, note there are many
 uncertainties in the experimental setup.
• Particle source (
•
 IMPLICATIONS AND FURTHER DEVELOPMENTS
 ABM can provide insight into the negative impact of physical distancing but usage limited
 to capacity, through-put and level of service analysis (and proximity dose).

• To understand the potential impact of dispersal of contaminated respiratory aerosols on
 infection probability within complex spaces it is essential to consider the impact of:
 • Convection currents (e.g. body heat plumes, heating systems)
 • Natural/forced ventilation and its interaction with the spatial configuration.
 • Wake effects caused by walking individuals
 • Requires CFD analysis

• These factors can generate asymmetric dispersal of contaminated aerosols, drive
 contaminated aerosols in unexpected directions and generate persistent hot-spots,
 severally impacting the ability of ABM to predict IP and efficacious mitigation strategies.

• Within complex spaces the desirable simplifying assumption of well-mixed environments
 and hence the appropriateness of simplistic treatments such as WR model for mitigation
 analysis is questionable and potentially misleading.
 • Simply imposing high ACH may not be a sufficient mitigation strategy
 • HEPA filters alone may not be a sufficient mitigation strategy.
 • Masks can be very effective but requires public buy-in, adherence and education.
 • Partial inoculation and population immunity can be factored into the IP analysis.
• We are currently exploring the development of a new coupling between ABM-CFD
 (EXODUS-SMARTFIRE) to enable EXODUS predicted agent paths to control the
 movement of agents within SMARTFIRE.
 http://fseg.gre.ac.uk 27th May 2021 e.r.galea@gre.ac.uk
 FSEG, The University of Greenwich
You can also read