WGBI inclusion confirms China's arrival on global bond stage
←
→
Page content transcription
If your browser does not render page correctly, please read the page content below

Market Navigation | Fixed Income

WGBI inclusion confirms China’s
arrival on global bond stage

    May 2021

AUTHOR
                                                    Introduction
Robin Marshall
Director, Fixed Income Research                     In earlier research papers 1 we have discussed the impact of inclusion of the
+44 0 7866 1908                                     Chinese government bond market in global bond indexes, and the
robin.marshall@lseg.com                             internationalization of the renminbi. In this paper, we assess the impact in
                                                    more detail, after the recent announcement that Chinese government bonds
CO-AUTHOR                                           will join the FTSE Russell World government bond index, or WGBI, over a
                                                    period of 36 months from October 2021—we consider both private sector and
Zhaoyi Yang                                         official holdings.
Fixed Income Research
+852 2164 3286                                      Given that foreign holdings of Chinese government bonds have been low
zhaoyi.yang@lseg.com                                historically, there is the potential for them to rise significantly. These increased
                                                    holdings could amount to US$130-160 billion to match China’s inclusion in the
                                                    WGBI alone, and a further US$207 billion in central bank inflows, assuming
                                                    private investors seek to move to benchmark index weight, and central banks
                                                    closer to the renminbi’s special drawing rights weight over time.

1
    See “Chinese government bonds; characteristics and evolution,” FTSE Russell, March 2021.

ftserussell.com                                                   An LSEG Business                                                         1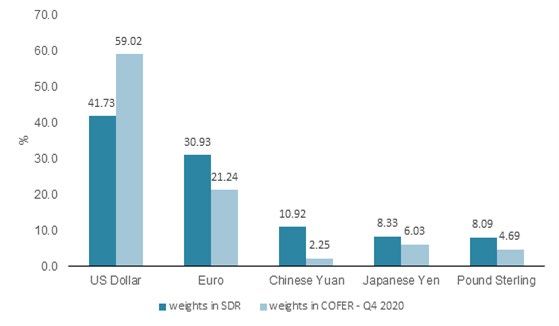
Defining the issue – private sector and central
bank holdings of RMB assets remain low vs
benchmarks
Foreign private sector holdings have remained low in renminbi assets generally, particularly in
Chinese government bonds, relative to other major markets 2. This remains the case despite a
sharp increase in foreign holdings in recent years. There has been less analysis of public sector
holdings of renminbi assets, but IMF data shows central banks’ foreign exchange reserve assets
denominated in RMB are also low. They reached US$267.5 billion in Q4 2020—only about 2.25%
of allocated reserves of US$11.9 trillion.

Although this figure represents an approximate doubling of reserves held in RMB assets since
2016, when the renminbi joined the IMF’s special drawing rights (SDR), it is much lower than the
assigned weighting in the IMF’s SDR for the renminbi of 10.92%.

It is true that to compensate for the big overweight in the US dollar, reserve weightings in other
currencies are also below SDR weights, but compared to other SDR components this is a
substantial underweight in the renminbi, as Chart 1 shows. The tendency for the primary reserve
currency to dominate these official weightings makes the overweight in the US dollar less
surprising, particularly given that the US Treasury market is the largest, and perceived to be the
most liquid, of major government bond markets.

Chart 1. Foreign reserve weightings in SDR components vs Weights in COFER

Source: IMF as of March 31, 2021.

2
    “China deepens global finance links as it joins benchmark indexes,” IMF blog, June 2019, Sally Chen, Dimitris Drakopoulos, and Rohit Goel.

ftserussell.com                                                                                                                                  2
Unlike G7 government markets, foreign holdings of Chinese government bonds are much lower Foreign private sector holdings of Chinese government bonds tell a similar story of rapid growth since 2016, as reforms have accelerated, but from very low levels. So current foreign holdings of Chinese government bonds have now reached about 10% of the total outstanding as of Q4 2020, compared with only 2% in 2016. This figure of 10% compares with foreign holdings nearer to 30% in major G7 government bond markets, like the UK and US markets (Table 1). It means foreign investors hold RMB 2.044 trillion (US$312 billion) in Chinese government bonds, as Chart 3 shows. Table 1: Foreign holdings of major government bond markets Government bond market China Japan Germany US UK % held by foreign residents 10.0% 12.7% 44.0%* 26.4% 27.0% Sources: US Treasury Dept., Japan MoF, UK DMO, PBOC, Bundesbank; *Non-Eurozone holders 2018 Chart 3: Foreign holdings of Chinese government bonds Source: CCDC as of March 31, 2021. Why?...there are good reasons for this historical underweight position Given the renminbi only joined the SDR as recently as 2016, Chinese financial markets were relatively inaccessible to foreign investors until recent reforms, and the renminbi has had limited tradability. As a result, the low weighting in renminbi assets and Chinese government bonds is unsurprising. Concerns about liquidity in Chinese government bonds has been another factor, reducing foreign ownership. Chinese government bonds have also been designated an Emerging Market (EM) for bond index purposes and therefore not featured in global indexes until recently. Thus, China joined the FTSE Russell Emerging Market government bond index in January 2018 but will not enter the FTSE Russell World Government Bond Index (WGBI) until October 2021. ftserussell.com 3
Are investors likely to move quickly to benchmark weights?
Whether, and indeed how quickly, private investors and official entities like central banks might
move towards benchmark/SDR weights will depend on a range of factors. The main factors would
seem market valuation and returns, ease of access for investors, currency convertibility and
outlook, and market liquidity in renminbi assets.

High relative yields for China’s sovereign credit ratings and the relative short duration of market
indexes are a clear contrast with G7 bonds (as Table 2 shows). These high yields, despite the
market’s short duration and A+ rating, suggest the Chinese market is modestly rated versus G7
markets. Low foreign participation in the Chinese government bond market also means the
correlation of returns between Chinese and G7 bond markets has been low 3. Indeed, Chinese
bonds withstood the recent sharp back-up in US treasury yields, with yields barely rising 4, and
low correlation of returns also offers portfolio diversification benefits.

Table 2: Major govt bond markets, ratings, valuations and duration

                                           FTSE market index           FTSE market                          Current
                                               capitalization        index duration           Credit     index yield
                                               (USD, trillion)              (years)           rating             (%)

    China Govt Bond (CGBI)          1.77                          5.62                    A+           3.01

    EM Govt Bond (EMGBI)                                   3.15                  5.56            A-             3.96
    US Treasury, USD                                       8.93                  6.53          AA+              0.99
    Eurozone Govt Bond                                     8.47                  8.55           AA-            -0.03
    Japan Govt Bond                                        4.25                11.76             A+             0.20
    UK Govt Bond                                           1.37                12.92            AA              0.89
    German Govt Bond                                       1.56                  8.06          AAA             -0.42

Source: FTSE Russell as of March 31, 2021.

Continuing market reforms and improving access for foreign investors are also evident, with
restrictions on renminbi convertibility easing. Given China’s favorable net international investment
position, currency reserves of over US$3 trillion, and ongoing trade surplus, pronounced
weakness of the renminbi would also appear unlikely. Indeed, it could be expected to attract
international opprobrium. The Balassa/Samuelson effect also suggests currency risks for foreign
investors are relatively low 5.

Liquidity metrics for both the government, and policy bank bond markets, suggest some
improvement in recent years, as foreign participation has increased, and the PBOC now conducts
monthly secondary auctions with market makers, designed to improve liquidity. However, longer
dated government bonds tend to be less liquid, with lower free floats, since high proportions of
these issues are held by domestic insurance institutions and are not frequently traded. This may
slow the speed with which investors move to benchmark weights, although liquidity in G7
government bond markets has not been guaranteed at all times during the COVID-19 crisis.

3
    See Chinese government bonds ‒ characteristics and evolution, FTSE Russell, March 2021.
4
    See China Fixed Income Monthly, FTSE Russell, April 2021.
5
    The Balassa/Samuelson effect implies that rapidly expanding economies tend to have appreciating exchange rates.

ftserussell.com                                                                                                        4
Potential scale of portfolio flows is substantial, even if at
benchmark weights, or below
To assess potential portfolio flows, it is assumed private investors aim to achieve global
benchmark index weights for Chinese government bonds. (Given the modest rating of the market,
and high relative yields, a case could be made for an overweight position, but assume a
benchmark weight is required by investors.)
For the FTSE Russell WGBI index, that would mean a benchmark weight of about 5.25% in the
index, over 36 months, from October 2021 to 2024, as Table 2 shows. Estimates 6 vary but
suggest about US$2.5-3 trillion in private sector assets currently track the WGBI index, which
would equate to about US$130-160 billion in inflows over 36 months, or US$3.6-4.4 billion
monthly for the WGBI index alone. For other global indexes, much hinges on whether the portfolio
adjustment is now complete since the Chinese government bond market has now been fully
incorporated into these indexes.
Central bank inflows from adjustment of currency reserves
could exceed index matching flows
For public sector investors, like central banks, potential inflows are also substantial, although
these projections are more speculative. They hinge on how far central banks and other public
sector investors would wish to expand RMB weightings in their official reserves, in a currency that
is not yet fully convertible. It seems reasonable to assume some increase in holdings is likely,
however, and particularly if the Chinese current account moves into deficit over time, so that
China becomes a net capital importer.
Assuming public investors seek a RMB weighting in currency reserves in line with the average
weights in yen, sterling and euro (Table 3), relative to their SDR weights (which are all
underweight) would give a desired weighting of 7.25% in RMB assets, versus the 10.9% SDR
weighting. Moving to 7.25% in RMB assets would increase holdings by US$415 billion.
A further assumption is required for the share of government bonds in the total official allocations
to renminbi assets. Let us assume the share of government bonds in reserve allocation in RMB is
about 50% (reflecting the safety of government bonds) 7. So, if 50% of the US$415 billion in
official portfolio flows were to be invested in Chinese government bonds, this would add a further
US$207.5 billion in foreign holdings.
6
HSBC estimate, Asian Fixed income Watch, October 2020. State Street estimate, A.Khumar, MD, State Street Global Advisers, September
2020, quoted in Pensions & Investments, September 2020.
7
Managing foreign exchange reserves in the crisis and after, Robert Macauley and Jean Francois Rigaudy, BIS Research paper No 58.
ftserussell.com 5Table 3: Potential portfolio flows into Chinese government bonds from index inclusion &
official inflows
Portfolio flows from private sector required to match index weight Other potential portfolio inflows
(Other global
FTSE WGBI indexes)* Central bank/official
Estimated AUM tracking the index
(US$ trillions) 2.5-3.0trn 2.2trn Global FX reserves ex China = US$8.6tr
10-20
months to
Phased-in period 36 months end-2020 Open-ended
China's weight upon full inclusion Assume 7.25% versus IMF SDR RMB
(%) 5.25%bn 6.0%bn weight = 10.9%
Total potential inflows (US$ billions) 130-158bn 141bn 207.5bn
Estimated monthly inflows over
36-months from Oct 2021 (US$ 5.7bn monthly (if completed over 36
billions) 3.65-4.40bn 6.03-8.05bn months)
Source: FTSE Russell calculation. *China has already joined two other global bond indexes as of end of 2020 and we
assume portfolio flows to match those indexes may therefore be complete.
Another impact may be to change the nature of the asset
allocation decision for global investors
So even with relatively cautious assumptions on desired index benchmark weights, and central
bank reserve adjustments to renminbi weights, overall foreign inflows into Chinese government
bonds could reach US$337-365 billion in the three years from October 2021. Since foreign
holdings in Chinese government bonds currently represent just over US$ 300 billion, this would
more than double foreign holdings to over 20%, taking them nearer to typical G7 levels. Given
China’s relatively low government debt/GDP ratio of around 45.8% 8, and ongoing economic
development, China’s weighting in global indexes may also increase from current levels, and
particularly if (state guaranteed) policy bank bonds are also included.
Finally, China’s arrival in global indexes also changes the nature of the asset allocation decision
for global investors benchmarked against these indexes, since investors may now need reasons
to justify not investing strategically in Chinese government bonds, rather than a justification for
doing so, tactically, when they were not included in benchmark indexes.
8
China Ministry of Finance (and includes both central and local govt debt).
ftserussell.com 6About FTSE Russell
FTSE Russell is a leading global provider of benchmarks, analytics and data solutions with multi-asset capabilities,
offering a precise view of the markets relevant to any investment process. For over 30 years, leading asset owners,
asset managers, ETF providers and investment banks have chosen FTSE Russell indexes to benchmark their
investment performance and create investment funds, ETFs, structured products and index-based derivatives. FTSE
Russell indexes also provide clients with tools for performance benchmarking, asset allocation, investment strategy
analysis and risk management.
To learn more, visit ftserussell.com; email info@ftserussell.com; or call your regional
Client Service Team office
EMEA North America Asia-Pacific
+44 (0) 20 7866 1810 +1 877 503 6437 Hong Kong +852 2164 3333
Tokyo +81 3 4563 6346
Sydney +61 (0) 2 8823 3521
© 2021 London Stock Exchange Group plc and its applicable group undertakings (the “LSE Group”). The LSE Group includes (1) FTSE International
Limited (“FTSE”), (2) Frank Russell Company (“Russell”), (3) FTSE Global Debt Capital Markets Inc. and FTSE Global Debt Capital Markets Limited
(together, “FTSE Canada”), (4) MTSNext Limited (“MTSNext”), (5) Mergent, Inc. (“Mergent”), (6) FTSE Fixed Income LLC (“FTSE FI”), (7) The Yield
Book Inc (“YB”) and (8) Beyond Ratings S.A.S. (“BR”). All rights reserved.
FTSE Russell® is a trading name of FTSE, Russell, FTSE Canada, MTSNext, Mergent, FTSE FI, YB and BR. “FTSE®”, “Russell®”, “FTSE Russell®”,
“MTS®”, “FTSE4Good®”, “ICB®”, “Mergent®”, “The Yield Book®”, “Beyond Ratings®“ and all other trademarks and service marks used herein
(whether registered or unregistered) are trademarks and/or service marks owned or licensed by the applicable member of the LSE Group or their
respective licensors and are owned, or used under licence, by FTSE, Russell, MTSNext, FTSE Canada, Mergent, FTSE FI, YB or BR. FTSE
International Limited is authorised and regulated by the Financial Conduct Authority as a benchmark administrator.
All information is provided for information purposes only. All information and data contained in this publication is obtained by the LSE Group, from
sources believed by it to be accurate and reliable. Because of the possibility of human and mechanical error as well as other factors, however, such
information and data is provided “as is” without warranty of any kind. No member of the LSE Group nor their respective directors, officers, employees,
partners or licensors make any claim, prediction, warranty or representation whatsoever, expressly or impliedly, either as to the accuracy, timeliness,
completeness, merchantability of any information or of results to be obtained from the use of the FTSE Russell products, including but not limited to
indexes, data and analytics or the fitness or suitability of the FTSE Russell products for any particular purpose to which they might be put. Any
representation of historical data accessible through FTSE Russell products is provided for information purposes only and is not a reliable indicator of
future performance.
No responsibility or liability can be accepted by any member of the LSE Group nor their respective directors, officers, employees, partners or licensors
for (a) any loss or damage in whole or in part caused by, resulting from, or relating to any error (negligent or otherwise) or other circumstance involved
in procuring, collecting, compiling, interpreting, analysing, editing, transcribing, transmitting, communicating or delivering any such information or data
or from use of this document or links to this document or (b) any direct, indirect, special, consequential or incidental damages whatsoever, even if any
member of the LSE Group is advised in advance of the possibility of such damages, resulting from the use of, or inability to use, such information.
No member of the LSE Group nor their respective directors, officers, employees, partners or licensors provide investment advice and nothing
contained herein or accessible through FTSE Russell products, including statistical data and industry reports, should be taken as constituting financial
or investment advice or a financial promotion.
The information contained in this report should not be considered “research” as defined in recital 28 of the Commission Delegated Directive (EU)
2017/593 of 7 April 2016 supplementing Directive 2014/65/EU of the European Parliament and of the Council (“MiFID II”) and is provided for no fee.
Past performance is no guarantee of future results. Charts and graphs are provided for illustrative purposes only. Index returns shown may not
represent the results of the actual trading of investable assets. Certain returns shown may reflect back-tested performance. All performance presented
prior to the index inception date is back-tested performance. Back-tested performance is not actual performance, but is hypothetical. The back-test
calculations are based on the same methodology that was in effect when the index was officially launched. However, back- tested data may reflect the
application of the index methodology with the benefit of hindsight, and the historic calculations of an index may change from month to month based on
revisions to the underlying economic data used in the calculation of the index.
This document may contain forward-looking assessments. These are based upon a number of assumptions concerning future conditions that
ultimately may prove to be inaccurate. Such forward-looking assessments are subject to risks and uncertainties and may be affected by various factors
that may cause actual results to differ materially. No member of the LSE Group nor their licensors assume any duty to and do not undertake to update
forward-looking assessments.
No part of this information may be reproduced, stored in a retrieval system or transmitted in any form or by any means, electronic, mechanical,
photocopying, recording or otherwise, without prior written permission of the applicable member of the LSE Group. Use and distribution of the LSE
Group data requires a licence from FTSE, Russell, FTSE Canada, MTSNext, Mergent, FTSE FI, YB, BR and/or their respective licensors.
ftserussell.com 7You can also read