ORFORD MINING CORPORATION - MANAGEMENT'S DISCUSSION AND ANALYSIS Years Ended December 31, 2020 and 2019
←
→
Page content transcription
If your browser does not render page correctly, please read the page content below
ORFORD MINING CORPORATION

MANAGEMENT’S DISCUSSION AND ANALYSIS

  Years Ended December 31, 2020 and 2019

                   -1-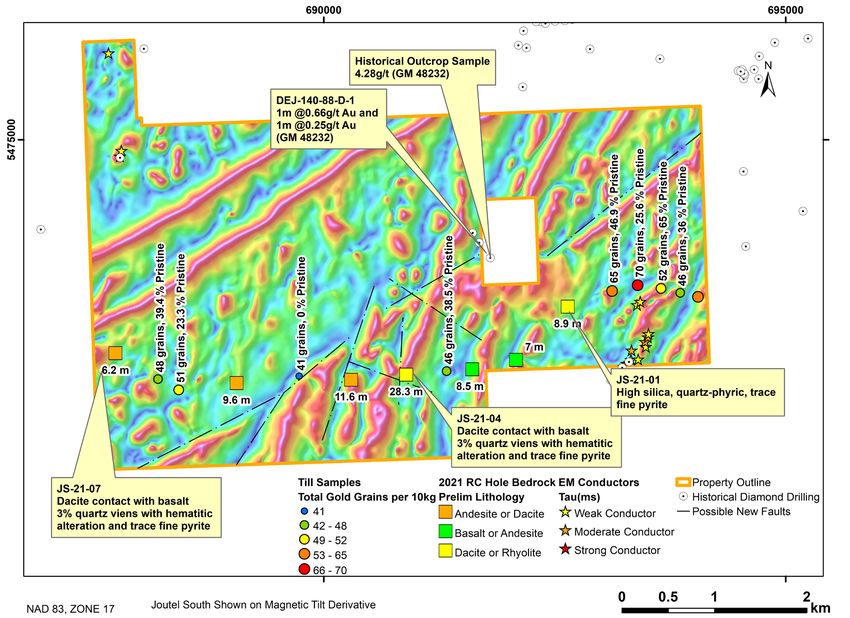
TABLE OF CONTENTS

Management’s Discussion and Analysis .................................................................................... 3
Description of Business ....................................................................................................... 3
COVID - 19 ...................................................................................................................... 3
Corporate Highlights ........................................................................................................... 4
Operational Overview .......................................................................................................... 5
Selected Annual Financial Information ..................................................................................... 17
Summary of Quarterly Results .............................................................................................. 17
Results of Operations ......................................................................................................... 18
Related Party Transactions .................................................................................................. 20
Contractual Commitments ................................................................................................... 21
Off-Balance Sheet Arrangements........................................................................................... 21
Outstanding Share Data ...................................................................................................... 21
Critical Accounting Policies and Estimates ................................................................................ 21
Risk Factors .................................................................................................................... 22
Subsequent Event ............................................................................................................. 27
Cautionary Statement Regarding Forward-Looking Information ....................................................... 28

                                                                -2-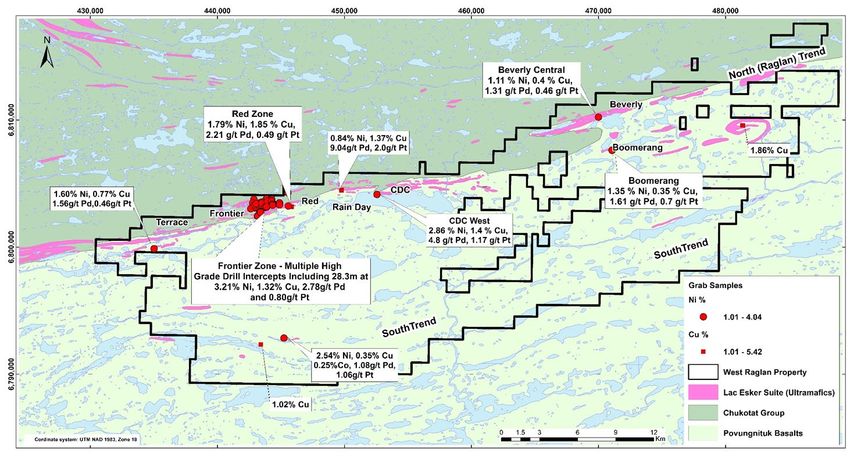
Management’s Discussion & Analysis
                                  Years Ended December 31, 2020 and 2019

MANAGEMENT’S DISCUSSION AND ANALYSIS

The following management’s discussion and analysis (“MD&A”) of the financial condition and results of the
operations of Orford Mining Corporation (“Orford” or the “Corporation”) constitutes management’s review of
the factors that affected the Corporation’s financial and operating performance for the years ended December
31, 2020 and 2019. This MD&A, dated April 23, 2021, is intended to supplement and complement the
Corporation’s audited consolidated financial statements prepared in accordance with International Financial
Reporting Standards (“IFRS”) and related notes for the years ended December 31, 2020 and 2019. This
MD&A contains certain forward-looking statements and reference should be made to the cautionary language
at the end of this MD&A.

For the purposes of preparing this MD&A, management, in conjunction with the Board of Directors, considers
the materiality of information if: (i) such information results in, or would reasonably be expected to result in, a
significant change in the market price or value of the Corporation’s common shares; or (ii) there is a
substantial likelihood that a reasonable investor would consider it important in making an investment decision;
or (iii) it would significantly alter the total mix of information available to investors.

Unless otherwise noted, all amounts presented are in Canadian dollars.

DESCRIPTION OF BUSINESS

Orford is a mineral resource corporation primarily focused on the exploration of its Qiqavik (gold), West
Raglan (nickel) and recently acquired three Joutel District (gold) exploration projects, all in northern Quebec.
The Qiqavik Project hosts several high-grade gold discoveries along a mineralized trend in excess of 40 km
long. The West Raglan project hosts a number of high-grade nickel-copper-Platinum group metal discoveries.

COVID - 19

Commencing in March 2020 and continuing to the date of this MD&A, the outbreak of the COVID - 19 virus
has resulted in governments worldwide enacting emergency measures to combat the spread of the virus. In a
response to the outbreak of the COVID - 19 virus, the Québec Government had banned all non-essential
businesses, including mineral exploration province wide. On May 11, 2020, the Québec Government lifted the
ban over most of the province. Until August 17, 2020, the directive remained in place for the Nunavik region of
Quebec where two of the Corporation’s properties are located. On August 17, 2020, the Nunavik Regional
Emergency Preparedness Advisory Committee lifted the travel ban for exploration companies with existing
projecting in Nunavik under strict guidelines and approval of the planned travel by the Committee.

Mr. Jonatan Julien, Minister of Energy and Natural Resources of Quebec, announced on April 9, 2020, the
extension of validity of all mining claims for a period of one year. This has effectively postponed the
requirement to carry out fieldwork to renew Orford held claims with renewal dates falling in 2020 by one full
year. This was a very important and helpful measure for exploration in the province of Quebec during the
current COVID - 19 Pandemic. Orford is concerned about the health and safety of its staff, contractors and the
communities it works with and is adhering to a work from home policy for its employees, contractors and
partners until further notice.

                                                       -3-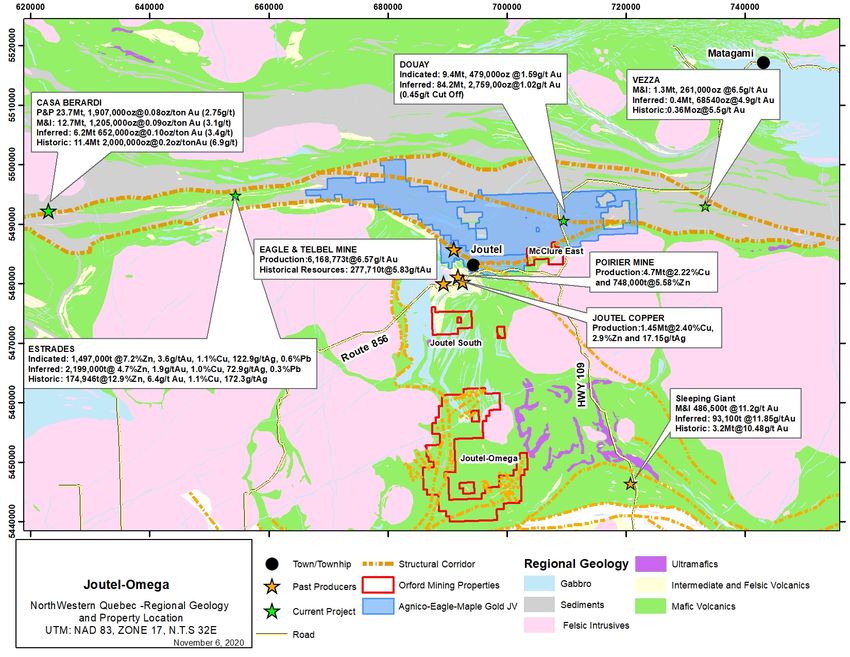
Management’s Discussion & Analysis
                                Years Ended December 31, 2020 and 2019

CORPORATE HIGHLIGHTS
•   On March 22, 2021, the Corporation announced that it had completed the reverse circulation (“RC”)
    overburden drilling program on its Joutel South and McClure East properties in the historic Joutel Mining
    District of Quebec. Twenty-five holes were completed on McClure East and 7 holes on Joutel South which
    resulted in the collection of 122 till samples and 37 bedrock (chip) samples. Preliminary visual
    observations of bedrock samples have identified the presence of sulfides and quartz veins on both the
    McClure East and Joutel South properties along with newly defined structures from a recently completed
    airborne survey.

•   On February 2, 2021, the Corporation announced that it had completed the inaugural exploration program
    on its Joutel South and McClure East properties in the historic Joutel Mining District of Quebec. The
    inaugural program consisted of a helicopter airborne time-domain electromagnetic (TDEM) survey on both
    the Joutel South and McClure East properties along with till sampling for gold grain analysis on the Joutel
    South Property.

•   On January 19, 2021, the Corporation reached a definitive agreement with Wyloo Metals Pty Ltd for a $25
    million earn-in and joint venture over Orford’s 100% owned West Raglan property in Nunavik, Quebec.
    (See “Subsequent Event” below for details).

•   On December 2, 2020, the Corporation announced that it has increased its property holdings in the
    underexplored Joutel Region by claim staking the Joutel-Omega property. The 100% Orford owned Joutel
    Omega property covers approximately 17,000 hectares of underexplored Archean greenstone belt in
    Quebec’s Abitibi District.

•   On October 29, 2020, the Corporation announced the launch of its inaugural exploration program at its
    Joutel exploration properties. Orford began its first phase of exploration on its Joutel South and McClure
    East properties in the historic Joutel Mining District of Quebec. Phase One will consist of a helicopter
    airborne time domain electromagnetic (TDEM) survey on both the Joutel South and McClure East
    properties along with till sampling for gold grain analysis on the Joutel South Property.

•   On October 19, 2020, the Corporation announced that it had closed the non-brokered private placement
    announced September 23, 2020 for gross proceeds of $5.25 million.

•   On October 15, 2020, the Corporation held its Annual General meeting. At the meeting, the shareholders
    of Orford Mining elected David Christie, Mark Goodman, Ben Pullinger, Lawrence Smith and Peter
    MacPhail as directors of the Corporation for the ensuing year. The shareholders also voted in favour of
    the appointment of PricewaterhouseCoopers LLP as the auditor of the Corporation for the ensuing year
    and in favour of the Corporation’s Stock Option Plan.

•   On September 23, 2020, the Corporation announced that it had upsized the non-brokered private
    placement previously announced on September 19, 2020 to $5.25 million due to investor demand. The
    terms were the same as those announced previously.

•   On September 19, 2020, the Corporation announced a $4.5 million non-brokered private placement of: (i)
    flow-through units at an issue price of C$0.315 per unit, and (ii) hard dollar units at an issue price of
    C$0.18 per unit. (the “Offering”). The expected gross proceeds of up to $4,500,000 from the sale of flow-
    through units, hard dollar units, or any combination thereof. Each flow-through unit will consist of one
    common share issued and one-half of a common share purchase warrant, each on a flow-through basis.
    Each hard dollar unit will consist of one common share and one-half of a common share purchase warrant.
    Each whole common share purchase warrant will entitle the holder to purchase one common share of the

                                                     -4-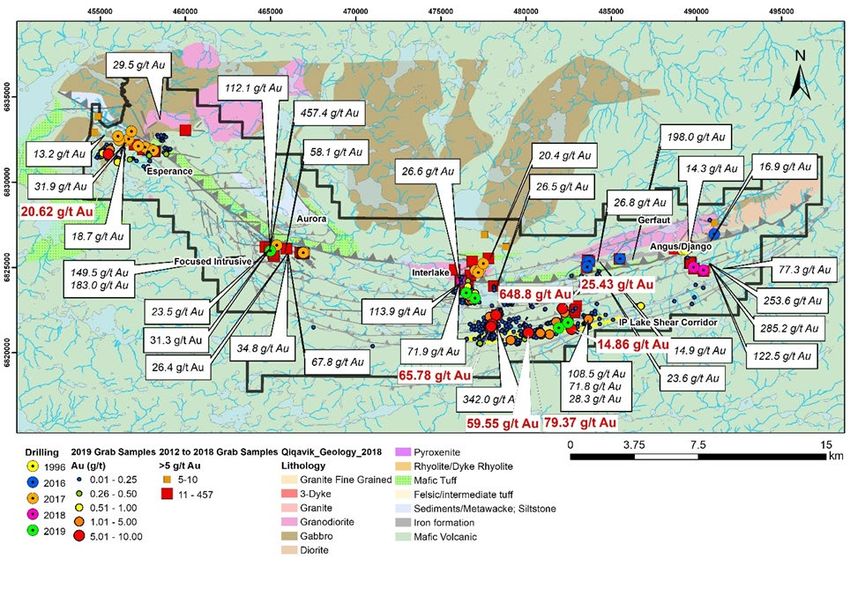
Management’s Discussion & Analysis
                                 Years Ended December 31, 2020 and 2019

    Corporation for a period of three years at an exercise price of $0.26. Alamos Gold (AGI-TSX) has
    confirmed that it will participate in the financing at its pro-rata level of 22.2%.

•   On September 8, 2020, the Corporation announced changes to our management team. Alger St.-Jean
    who was Orford’s VP Exploration was named Chief Geoscientist, and Michelle Sciortino who was Orford’s
    Senior Geologist was promoted to VP Exploration.

OPERATIONAL OVERVIEW

Exploration Properties

Qiqavik Property

The Corporation’s Qiqavik Project is a property in Northern Quebec within the Cape Smith Belt, showing a
high-grade gold and copper mineralized trend.

Exploration efforts during the summer of 2018 were focused on discovering structural and chemical traps
within the Qiqavik gold system, which includes the Interlake area just south of the Central Zone. The 2019
program continued with this focus along the Interlake structural corridor, the newly discovered IP Lake
Corridor, the Esperance area and the Focused intrusive area.

The 2019 exploration program was completed at the end of August and all results have been received. The
first phase of the program was conducted in May 2019 and consisted of the initiation of Induced Polarization
(“IP”) surveys over shallow frozen lakes in high priority target areas using Abitibi Geophysic’s OrevisionTM
system. The second phase of his work was continued beginning on July 8, 2019 with the mobilization of field
crews to complete the 34.8 line-km IP surveys, a 1,128 line-km Airborne Electromagnetic (“EM”) survey using
Geotech’s VTEMTM system, detailed geological and structural mapping as well as frost boil and large till
sampling to develop multi-parameter drill targets. The third phase of the program consisted of 1,368 meters of
diamond drilling in six holes which was completed at the end of August 2019. No field program was conducted
in 2020 as a result of the travel restrictions in the Nunavik region due to COVID - 19.

Key 2019 Exploration Program Highlights:

•   Intersected gold mineralization in all holes drilled in 2019 targeting three different geological structures on
    the property separated by up to 18 km (see Figure 1 and Table 1);

•   Extended the thick gold mineralized trend in drilling to 2.5 km of the 5 km structural package along the
    Interlake Shear Structure (Up to 0.51 g/t Au over 53 meters in 19-QK-004) (see Table 1);

•   Confirmed gold mineralization in drilling results associated with multiple quartz veins in the multiphase
    Focused Intrusion (2.8 g/t Au over 1.84 meters including 8.57 g/t Au over 0.58 meters in QK-19-06)
(see Table 1);

•   Identification of a large new structural corridor (75-100 meters wide) that extends from IP Lake westward
    for approximately 7 km. The shear is hosted in basalt and meta-sediments and contains large quartz vein
    boulders with sphalerite, chalcopyrite, galena, pyrite and visible gold (Figure 2). Orford’s claim position
    has been expanded twice in the past year by a total of 19% (7,366 Ha) to further cover the IP Lake Shear
    Zone to the west, south and east and now totals 39,063 hectares.

•   Confirmed Au in drilling (QK-19-002) on the newly discovered 7 km long IP Lake Shear (0.58 g/t Au over
    10 meters) (see Table 1);

                                                       -5-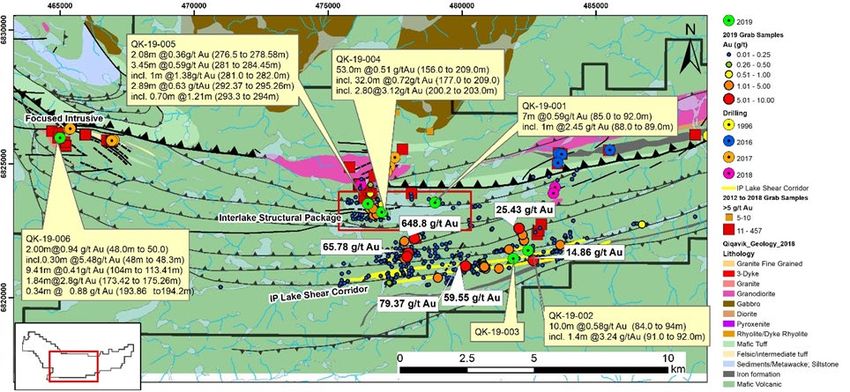
Management’s Discussion & Analysis
                                 Years Ended December 31, 2020 and 2019

•   Confirmed multiple gold mineralized boulder trains (including 5 grab samples ranging from 14.9 g/t Au to
    648.8 g/t Au, see Table 2) associated with untested cross structures along the newly discovered, 7 km
    long IP Lake Shear Corridor (IPSC, Figure 1 and Table 1). In addition, some very strong gold grain in till
    sample dispersion trends have identified the central (Dumbbell Lake) and western segments of the IPSC
    and secondary-scale cross-structures in these areas as a high priority target for future exploration
    programs.

•   Reported high grade gold on a newly discovered contact-shear trend south of Esperance (Up to 20.62 g/t
    Au in grab sample, Figure 2 and Table 1);

•   Identification of new untested EM drill targets along the main Esperance trend and additional EM
    anomalies to the south of the main trend associated with Au (up to 10 g/t Au in boulders);

• Identification of new gold anomalies in boulders up to 648 g/t Au1 defining dispersion trains pointing towards
     the IP Lake structural corridor (Figure 1).; and

• Drill hole QK-19-004 testing the Interlake structural zone 300 meters east of drilling completed in 2018 (QK-
     18-007, 24.6 meters grading 0.48 g/t Au)2 intersected 32.0 meters grading 0.71 g/t Au, including 2.8
     meters grading 3.31 g/t Au in an altered volcaniclastic.

• Orford expanded the property position by 19% at Qiqavik to the south, east and west of the IP Lake
    Structural Corridor due to the very strong gold grains in glacial till sample results pointing to potential
    targets along this favourable structural zone.

Note:
1. Grab samples are selective by nature and values reported may not be representative of mineralized zones
2. All drilling intervals are down-hole lengths. True thicknesses cannot be estimated with available information.

                                                      -6-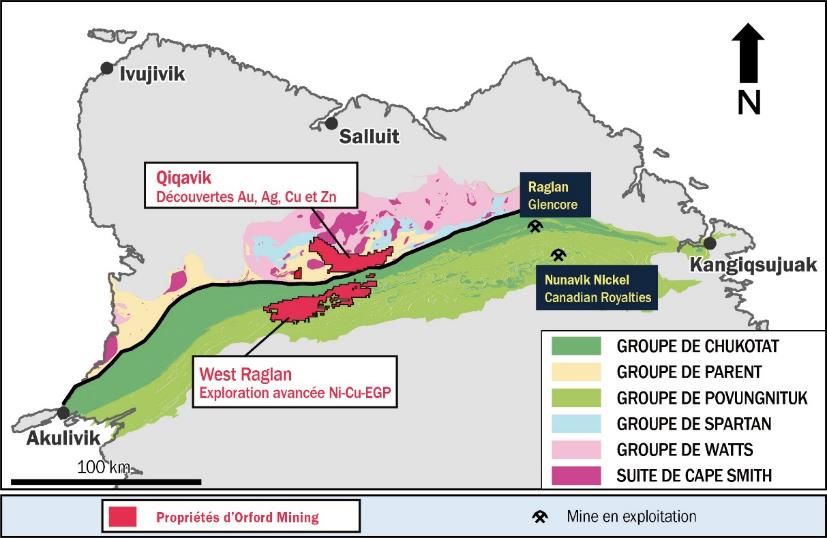
Management’s Discussion & Analysis
                               Years Ended December 31, 2020 and 2019

Figure 1: 2019 Grab sample Results (shown in red)

Note that grab samples are selective by nature and values reported may not be representative of
mineralized zonesFigure 2: Summary of 2019 Diamond Drilling Assay Results

Note that All drilling intervals are down-hole lengths. True thicknesses cannot be estimated with available
information. Note that grab samples are selective by nature and values reported may not be representative of
mineralized zones

                                                    -7-
Management’s Discussion & Analysis
                                 Years Ended December 31, 2020 and 2019

Table 1: 2019 Drill Program Significant Results1
  Hole Number          From              To                 Interval (m)        Au (g/t)            Area
  QK-19-001             33.00            34.00                    1.00             0.38*
  QK-19-001             85.00            92.00                    7.00             0.59
                                                                                                   Interlake
    including           88.00            89.00                    1.00             2.45
    including           91.00            92.00                    1.00             1.20
  QK-19-002             84.00            94.00                   10.00             0.58
    including           88.00            91.00                    3.00             1.70            IP Lake
    including           88.00            89.40                    1.40             3.24
  QK-19-003            230.00           231.00                    1.00             0.23            IP Lake
  QK-19-004            103.00           104.00                    1.00             1.08
  QK-19-004            135.00           137.00                    2.00             1.43
    including          136.00           137.00                    1.00             2.56
  QK-19-004            156.00           209.00                   53.00             0.51
    including          158.00           159.00                    1.00             1.37            Interlake
    including          177.00           209.00                   32.00             0.72
    including          197.00           205.00                    8.00             1.95
    including          198.00           203.00                    5.00             2.79
    including          200.20           203.00                    2.80             3.12
  QK-19-005            276.50           278.58                    2.08             0.36
  QK-19-005            281.00           284.45                    3.45             0.59
    including          281.00           282.00                    1.00             1.38            Interlake
  QK-19-005            292.37           295.26                    2.89             0.63
    including          293.30           294.00                    0.70             1.21

  QK-19-006              17.39              17.69                0.30              3.37
  QK-19-006              34.46              35.19                0.73              0.65
  QK-19-006              40.77              43.26                2.49              0.68
   including             41.78              42.15                0.37              2.53
  QK-19-006              48.00              50.00                2.00              0.94
   including             48.00              48.30                0.30              5.48
                                                                                              Focused Intrusive
  QK-19-006             104.00             113.41                9.41              0.41
   including            104.00             105.00                1.00              0.93
   including            111.09             112.00                0.91              2.30
  QK-19-006             173.42             175.26                1.84              2.80
   including            173.42             174.00                0.58              8.57
  QK-19-006             193.86             194.20                0.34              0.88

*This interval also reported 0.59% Cu.
1. All drilling intervals are down-hole lengths. True thicknesses cannot be estimated with available information.

                                                      -8-
Management’s Discussion & Analysis
Years Ended December 31, 2020 and 2019
Table 2: Grab Sample Results from the 2019 Qiqavik field program1
Sample Description X Y Au (g/t) Cu Pb S% Sb Zn Area
% % (ppm) %
B00393009 Boulder 478230.2 6822208 648.8 0.08 0.52 5.00 14 0.16 IP Lake Shear
Boulder Trend
B00393434 Boulder 480086.5 6821140 79.4 0.03 0.00 0.17 5 0.00 IP Lake Shear
Boulder Trend
B00393062 Boulder 477998.0 6821666 65.8 0.01 0.27 2.51 29 0.04 IP Lake Shear
Boulder Trend
B00393890 Boulder Field 480137.6 6821178 59.6 0.01 0.47 0.11 5 0.05 IP Lake Shear
Boulder Trend
B00393013 Boulder 482140.4 6822586 25.4 0.11 0.33 0.21 52 0.02 IP Lake Shear
Boulder Trend
B00393782 Boulder 455479.7 6831646 20.6 5.00 0.24 5.00 85 0.01 Esperance
South
B00393016 Boulder Field 482667.8 6821387 14.9 0.03 0.00 5.00 5 0.01 IP Lake Shear
Boulder Trend
B00393069 Boulder 477947.9 6821524 5.4 0.00 0.00 1.23 8 0.00 IP Lake Shear
Boulder Trend
B00393818 Outcrop 476687.6 6823313 4.5 0.00 0.01 0.87 20 0.09 Interlake
B00393817 Subcrop 476816.3 6823111 4.3 0.01 0.14 0.86 20 0.09 Interlake
B00393687 Boulder 480843.5 6821126 3.9 0.00 0.00 0.01 5 0.00 IP Lake Shear
B00393872 Boulder Field 477862.8 6821450 3.5 0.01 0.20 0.62 50 0.21 IP Lake Shear
Boulder Trend
B00393666 Boulder 480884.6 6821072 3.3 0.00 0.00 0.00 0 0.00 IP Lake Shear
Boulder Trend
B00393689 Boulder 480842.4 6821151 3.2 0.00 0.00 0.00 0 0.00 IP Lake Shear
Boulder Trend
B00393383 Boulder 477856.5 6822102 2.8 0.00 0.00 0.01 5 0.03 IP Lake Shear
Boulder Trend
B00393014 Boulder 482322.7 6822126 2.5 0.02 0.00 5.00 5 0.01 IP Lake Shear
Boulder Trend
B00393910 Boulder Field 479101.2 6820736 2.5 0.00 0.00 0.70 21 0.01 IP Lake Shear
Boulder Trend
B00393809 Subcrop 476696.6 6823065 2.2 0.00 0.02 0.45 10 0.01 Interlake
1. Grab samples are selective by nature and values reported may not be representative of mineralized zones
Joutel South, McClure East and Joutel Omega Properties
On April 29, 2020, the Corporation announced that it has acquired by staking two claim blocks along the
prolific gold mineralized Casa Berardi-Joutel Structures, in the Abitibi region of Northern Quebec (figure 3).
One claim block “Joutel South” is at the southern underexplored extension of the Joutel trend that hosted both
Agnico-Eagle Mines Ltd.’s (AEM-T) founding gold mine Eagle/Telbel which produced in excess of 1.1Moz of
gold1 and a number of copper assets that have produced 244 Mlbs of copper, 116Mlbs of Zinc and 52Mlbs of
silver2, all on neighbouring properties. All commercial operations in the region had closed by 1993. The other
block is on the easterly extension of the Casa Berardi structural zone, which to the west hosts Hecla Mining
Ltd’s (HL-NYSE) Casa Berardi Mine which has produced 2 million oz and has reserves of 3.4 million oz3, and
the nearby Duay Gold Deposit held by Maple Gold Mines (MGM-TSXV) containing 422,000 oz in indicated
and 2,532,000 oz in inferred resources4, both on neighbouring properties. This information from neighbouring
properties is not necessarily indicative of the mineralization on Orford Mining’s properties.
-9-Management’s Discussion & Analysis
Years Ended December 31, 2020 and 2019
On December 2, 2020, the Corporation announced that it has increased its property holdings in the
underexplored Joutel Region by claim staking the Joutel-Omega property (Figure 3). The 100% Orford owned
Joutel Omega property covers approximately 17,000 hectares of underexplored Archean greenstone belt in
Quebec’s Abitibi District. The Joutel Omega covers the Vanier-Dalet-Priorier Group (VDP) and the
Valerennes Volcanic Group (VVG). The latter is part of the Joutel-Raymond volcanic complex that hosts both
Agnico-Eagle Mines Ltd.’s (TSX: AEM) founding gold mine, Eagle/Telbel, which produced in excess of 1.1
Moz of gold1 and a number of copper mines that have produced 244 Mlbs of copper, 116Mlbs of zinc and 52
Mlbs of silver2 (Figure 3). To the southeast, the VDP hosts the Sleeping Giant mine which produced 978,000
ounces (3.2 Mt @ 10.48g/t Au3 ). Information from neighbouring properties is not necessarily indicative of the
mineralization on Orford Mining’s properties. The technical information presented in this report was obtained
from historical work reports filed with the Quebec Ministry of Energy and Natural Resources and has not been
independently verified by a Qualified Person as defined by NI 43-101.
1 Système d'information géominière of Québec “SIGEOM”, Quebec Ministry of Energy and Natural Resources.
April 20, 2020.
2 Système d'information géominière of Québec “SIGEOM”, Quebec Ministry of Energy and Natural Resources.
April 20, 2020.
3 Casa Berardi Mineral Resources Statement as of December 31, 2019 published on Hecla Mining Company’s
website.
4 Douay Gold Project Mineral Resource Statement as at October 23, 2019 published on Maple Gold Mines’
website.
Key 2020-2021 Exploration Highlights
• The inaugural program in November and December on the Joutel properties consisted of a helicopter
airborne time-domain electromagnetic (TDEM) survey on both the Joutel South and McClure East
properties along with till sampling for gold grain analysis on the Joutel South Property. The best till sample
from the Joutel South property reported 65 gold grains (46% of which were pristine), along with several
other samples in the eastern part of the property which were anomalous.
• In February and March of 2021, the Corporation completed the reverse circulation (“RC”) overburden
drilling program on its Joutel South and McClure East properties. Twenty-five holes were completed on
McClure East and 7 holes on Joutel South which resulted in the collection of 122 till samples and 37
bedrock (chip) samples. Preliminary visual observations of bedrock samples have identified the presence
of sulfides and quartz veins on both the McClure East and Joutel South properties (Figure 4 & 5) along
with newly defined structures from a recently completed airborne survey. Sample analysis results are in
process and will be reported when available.
• Twenty-five RC holes were completed on the McClure East property to follow up on an historical RC
drilling gold in till anomaly on the southeastern part of the property which reported up to 30g/t Au in
overburden material1 (Figure 5), and to test the westward down-ice extent of the property (glacial transport
direction is to the south). Interesting mineralization and alteration were noted visually in bedrock chips
from several holes which included the presence of pyrite, and arsenopyrite mineralization, quartz veining
and possible hematite, ankerite and epidote alteration (Holes: ME-21-11, ME-21-10, ME-21-16, ME-21-20,
ME-21-19, Figure 2). The historical information shown in this news release was obtained from historical
work reports filed with the Quebec Ministry of Energy and Natural Resources and has not been
independently verified by a Qualified Person as defined by NI 43 101.
- 10 -Management’s Discussion & Analysis
Years Ended December 31, 2020 and 2019
Figure 3: Joutel Area Property Locations
Information from neighboring properties is not necessarily indicative of the mineralization on Orford Mining’s
properties.
- 11 -Management’s Discussion & Analysis
Years Ended December 31, 2020 and 2019
Figure 4: Joutel South Property 2021 Airborne Geophysics with RC drill hole locations and Till sampling
results
Drilling intervals are down-hole lengths from historical data. True thicknesses cannot be estimated with
available information. Historical information was obtained from historical work reports filed with the Quebec
Ministry of Energy and Natural Resources and has not been independently verified by a Qualified Person as
defined by NI 43-101.
- 12 -Management’s Discussion & Analysis
Years Ended December 31, 2020 and 2019
Figure 5: McCLure East Property 2021 Airborne Geopysics with RC Drill hole Locations
.
Historical information was obtained from historical work reports filed with the Quebec Ministry of Energy and
Natural Resources and has not been independently verified by a Qualified Person as defined by NI 43-101.
West Raglan Property
West Raglan is a mature nickel sulphide exploration project located in the centre of the Cape Smith Belt in
northern Quebec, Canada. The Cape Smith Belt is home to prolific, high-grade nickel sulphide deposits,
including two producing mines: Glencore’s Raglan Mine and Canadian Royalties’ Nunavik Nickel Mine (figure
6).
On January 19, 2021, the Corporation announced that it has reached a definitive agreement with Wyloo
Metals Pty Ltd (Wyloo Metals) for a $25.0 million earn-in and joint venture over Orford’s 100% owned West
Raglan property in Nunavik, Quebec. The West Raglan property is a camp scale, advanced Ni-Cu-Co-PGE
exploration property covering an area of 840 km2, increased from the previous 663 km2. Information about
neighbouring properties is not necessarily indicative of the mineralization on Orford Mining’s properties.
Seven zones of Ni-Cu-PGM sulphide mineralization have been found to date on the West Raglan property
(figure 7). One of these zones, the Frontier Zone, includes five key high-grade lens clusters. Highlights from
Frontier Zone drilling include5:
- 13 -Management’s Discussion & Analysis
Years Ended December 31, 2020 and 2019
• Seahawk A: 28.28m grading 3.21% Ni, 1.32% Cu, 2.43g/t Pd and 0.65g/t Pt
• Frontier Central: 10.50m grading 2.78% Ni, 1.21% Cu, 2.78g/t Pd and 0.80g/t Pt.
• Frontier East: 7.62m grading 2.54% Ni, 1.42% Cu, 1.56g/t Pd and 0.39g/t Pt
• Frontier South: 20m grading 2.41% Ni, 0.92% Cu, 2.28g/t Pd and 0.66g/t Pt
These intersections occur in the same geological setting as the Raglan Mine in ultramafic intrusions and flows
occurring stratigraphically below the Chukotat Group basalt. The mineralization is also very similar to the
typical ores from the Raglan Mine, which is among the richest Ni-Cu-PGM mines in the world.
No physical exploration work occurred on the West Raglan project during the year ended December 31, 2019
and an impairment charge of $3,947,146 was taken on December 31, 2019 representing the entire carrying
value of the property. This impairment does not diminish the potential of the property and the Corporation in
January 2021 reached a definitive agreement with Wyloo Metals Pty Ltd for a $25 million earn-in and joint
venture.
5 The information disclosed herein in respect of the West Raglan Property is based on the independent report
of Clement Dombrowski, P.Geo of IOS Services Geoscientifiques Inc. titled “NI 43-101 Technical Report on
West Raglan Project, Northern Quebec, Canada” effective February 20, 2017 and available on Orford’s
Website and under Orford’s profile on SEDAR.com.
Figure 6: West Raglan Location
- 14 -Management’s Discussion & Analysis
Years Ended December 31, 2020 and 2019
Figure 7: West Raglan Nickel-Copper-PGM Mineralization
Note that grab samples are selective by nature and values reported may not be representative of mineralized
zones.
Note that all drilling intervals are down-hole lengths. True thicknesses cannot be estimated with available
information.
Outlook
The outlook and financial targets only relate to fiscal 2021. This outlook includes forward looking information
about the Corporation’s operations and financial expectations and is based on management’s expectations
and outlook as of April 23, 2021. This outlook, including expected results and targets, is subject to various
risks, uncertainties, and assumptions, which may impact future performance and our achievement of the
results and targets discussed in this section. For additional information on forward-looking information, refer to
"Forward-Looking Information" of this MD&A. This outlook may be periodically updated depending on changes
in metals prices and other factors.
At Qiqavik, the summer 2020 exploration program could not be executed due to COVID - 19 restrictions
enacted by the province of Quebec. Results from the 2019 program are presented above (Tables 1 and 2).
The current global COVID - 19 Pandemic has put severe strain on both the capital markets and the ability of
companies, like Orford, to raise funds. Orford was, however, successful in raising $5.25 million in October of
2020. Conversely, the physical gold market remains strong, despite some recent seasonal weakness, as a
hedge during uncertain times globally as well as a hedge against the threat of future inflation. This strength
may help the Corporation in future months. In response to the outbreak of the COVID - 19 virus in Quebec in
2020, the Québec Government had banned mineral exploration province-wide in early 2020. The Quebec
provincial government issued an updated directive that allowed mineral exploration in most areas of the
province starting on May 11, 2020 but not in the Nunavik region where a non-essential travel ban remained in
place until August 17, 2020. Exploration is now allowed under certain restrictions and subject to approval of
travel plans and COVID - 19 prevention program by the regional government of Nunavik. Orford had yet to
initiate the field portion of its 2020 exploration program at Qiqavik or West Raglan in the Nunavik region.
- 15 -Management’s Discussion & Analysis
Years Ended December 31, 2020 and 2019
Orford completed a recent financing to fund exploration in 2021 at its Qiqavik property and expects to launch a
program during the summer of 2021. It will also launch a program in 2021 as operator for Wyloo Metals on the
West Raglan property as part of the Wyloo earn-in. The COVID – 19 situation is fluid with a third wave
currently affecting many areas of the country. In Nunavik, however, as of March 17, 2021, just over half of
Nunavik adults have had a 1st vaccine dose. On March 25, 2021, the Nunavik Regional Emergency
Preparedness Advisory Committee provided clear and updated guidelines on obtaining approval for
exploration in Nunavik. Orford is in the process of applying for this approval.
Orford was able to complete exploration on its recently acquired Joutel South and McClure East properties in
the Abitibi district of northern Quebec. Starting in late October of 2020, the Corporation began to explore its
Joutel area properties, Joutel South and McClure East, with Glacial till sampling programs, RC drilling
programs and airborne geophysics and these programs were completed in March of 2021 and we await
analytical results to make proposals for follow-up programs. We have commenced compilation work on the
newly staked Joutel Omega property.
We remain committed to the potential of both our Qiqavik and West Raglan properties in the Nunavik Region
of northern Quebec as well as our new properties, McClure East, Joutel South and Joutel Omega.
The West Raglan property has excellent potential to deliver the nickel, platinum, palladium and cobalt required
to meet the massive demand growth expected from the stainless steel markets, the electric vehicle and
energy storage markets in the coming decade and is strategically located in an established nickel mining
camp. Orford was successful in finding a strategic partner to explore the West Raglan property. On January
19, 2021, an earn-in agreement with Wyloo Metals was signed on the West Raglan property. This is a marked
change from the end of 2019 when, with no agreement on the property and no funds to explore it, the
Corporation had impaired the asset as noted above. The Corporation will continue to focus on the highly
prospective and under-explored Cape Smith Belt in Northern Quebec, a region that bears strong geological
similarities and is in close proximity to an existing flagship mining operation for a major mining producer (Cape
Smith Belt – Raglan Mine, Glencore), while seeking new opportunities to add to its portfolio such as the
recently acquired properties in the Joutel district of the Abitibi region.
- 16 -Management’s Discussion & Analysis
Years Ended December 31, 2020 and 2019
SELECTED ANNUAL FINANCIAL INFORMATION
Year ended Year ended Year ended
December 31, 2020 December 31, 2019 December 31, 2018
($) ($) ($)
Revenue nil nil nil
Net loss (1,366,918) (3,858,084) (2,656,439)
Net loss per share – basic and diluted (0.01) (0.05) (0.05)
As at As at As at
December 31, 2020 December 31, 2019 December 31, 2018
($) ($) ($)
Total assets 13,403,487 9,475,055 9,756,073
Total long-term liabilities 3,593,343 1,749,143 1,772,699
SUMMARY OF QUARTERLY RESULTS
A summary of selected financial information of Orford for the eight most recently completed quarters is
provided below:
Working Net Income or (Loss)
Total capital surplus
Revenue (deficiency) Total Per Share
Three Months Ended ($) ($) ($) ($)
December 31, 2020 nil 4,232,105 (778,435) (0.01)
September 30, 2020 nil (622,109) (185,225) (0.00)
June 30, 2020 nil (349,736) (168,745) (0.00)
March 31, 2020 nil 52,200 (234,513) (0.00)
December 31, 2019 nil 416,148 (3,504,450) (0.04)
September 30, 2019 nil 944,964 184,690 0.00
June 30, 2019 nil 1,245,662 (302,526) (0.00)
March 31, 2019 nil (200,117) (235,798) (0.00)
The Corporation is an exploration stage mineral resources company. Issues of seasonality have not had an
impact on our results or operations, however, commodity market fluctuations, and fluctuations in the price of gold,
in particular, may impact our exploration activities and our ability to grow through acquisition, and may continue
to do so in the future. Over the past eight quarters, variations in the quarterly net income (loss) were caused by
fluctuations in general and administrative expense. Stock-based compensation expense varies from quarter-to-
quarter depending on the number of stock options granted in a quarter, their vesting periods, and the inputs,
including assumptions used in the Black-Scholes Option Pricing Model, which is used to calculate the fair value
of the stock options.
- 17 -Management’s Discussion & Analysis
Years Ended December 31, 2020 and 2019
RESULTS OF OPERATIONS
Three months ended December 31, 2020, compared with the three months ended December 31, 2019.
The Corporation’s net loss for the three months ended December 31, 2020 was $778,435 (three months
ended December 31, 2019 – net loss of $3,504,450). The decrease in net loss of $2,726,015 is mainly
attributable to:
• For the three months ended December 31, 2019, an impairment loss of $3,947,146 was incurred in
respect of the West Raglan property on the basis that the Corporation had not incurred any costs, other
than property maintenance, on the property since 2017 and had no current plan to engage exploration
and evaluation activities on the property without a strategic partnership.
• During the three months ended December 31, 2020, the Corporation incurred $464,813 of exploration
and evaluation expenditures on the West Raglan and Joutel properties. These expenditures represent
budgeted exploration on the properties.
• During the three months ended December 31, 2020, the Corporation reversed a provision of $544,496
for potential indemnities payable to flow-through subscribers from a 2012 flow-through financing. As the
liability is now statute barred and the Corporation has reversed the liability.
• During the three months ended December 31, 2020, the Corporation recorded a deferred tax expense
of $625,393 compared to a recovery of $739,796 for the three months ended December 31, 2019. The
deferred tax expense is recognized for Quebec Mining Duties for the period, offset by deferred tax
recovery from eligible flow-through expenditures incurred. The deferred tax recovery recognized in the
2020 period is considerably less than the amount recovered in the 2019 period due to the Corporation
not being able to access mining sites because of COVID - 19 restrictions.
• The Corporation incurred a decrease in management services of $38,242 during the three months
ended December 31, 2020 compared to 2019. This decrease resulted from the Corporation cost saving
initiatives implemented in the current period compared to the previous period when the Corporation
engaged the services of an investor relations consultant.
• During the three months ended December 31, 2020, professional fees decreased by $63,300 compared
to the 2019 period. The decrease is primarily a result of the reduced need for professional services
required during the 2020 period.
• There was a decrease of $67,382 in stock-based compensation expense for the three months ended
December 31, 2020 over the 2019 period. Stock-based compensation expenses will vary from period to
period depending upon the number of options granted and vested during a period and the fair value of
the options calculated as at the grant date.
Year ended December 31, 2020, compared with the year ended December 31, 2019.
The Corporation’s net loss for the year ended December 31, 2020 of $1,366,918 (year ended December 31,
2019 - $3,858,084) was lower than 2019 by $2,491,166.
• For the year ended December 31, 2019, an impairment loss of $3,947,146 was incurred in respect of
the West Raglan property on the basis that the Corporation had not incurred any costs, other than
property maintenance, on the property since 2017 and had no current plan to engage exploration and
evaluation activities on the property without a strategic partnership.
- 18 -Management’s Discussion & Analysis
Years Ended December 31, 2020 and 2019
• During the year ended December 31, 2020, the Corporation incurred $464,813 of exploration and
evaluation expenditures on the West Raglan and Joutel properties. These expenditures represent
budgeted exploration on the properties.
• During the year ended December 31, 2020, the Corporation reversed a provision of $544,496 for
potential indemnities payable to flow-through subscribers from a 2012 flow-through financing. As the
liability is now statute barred and the Corporation has reversed the liability.
• During the year ended December 31, 2020, the Corporation recorded a deferred tax expense of
$536,630 compared to a recovery of $1,259,738 for the year ended December 31, 2019. The deferred
tax expense is recognized for Quebec Mining Duties for the year, offset by deferred tax recovery from
eligible flow-through expenditures incurred. The deferred tax recovery recognized in the 2020 period is
considerably less than the amount recovered in the 2019 year due to the Corporation not being able to
access mining sites because of COVID - 19 restrictions.
• During the year ended December 31, 2020, investor relations decreased by $127,304 compared to the
2019 year. This decrease resulted from the Corporation cost saving initiatives implemented in the
current year compared to the previous year when the Corporation engaged the services of an investor
relations consultant.
• There was a decrease of $131,262 in stock-based compensation expense for the year ended December
31, 2020 over the 2019 year. Stock-based compensation expenses will vary from period to period
depending upon the number of options granted and vested during a period and the fair value of the
options calculated as at the grant date.
Cash Flows, Liquidity and Capital Resources
The Corporation’s cash and cash equivalents were $4,596,523 as of December 31, 2020 compared to
$1,042,228 as of December 31, 2019.
For the year ended December 31, 2020 2019
Cash used in operating activities $ (995,103) $ (1,012,453)
Cash used in investing activities (507,926) (3,211,780)
Cash provided by financing activities 5,057,324 4,503,897
Change in cash and cash equivalents $ 3,554,295 $ 279,664
Operating Activities
Cash used in operating activities for the year ended December 31, 2020 were $995,103. Operating activities
were affected by non-cash items of share-based payments of $94,114, deferred income tax expense of
$536,630 and other income of $544,496. The net change in non-cash working capital balances of $285,567
resulted from a decrease in amounts receivable of $212,340, an increase in prepaid expenses of $20,254, a
decrease in tax credits receivable of $10,552 and an increase in accounts payable and accrued liabilities of
$82,929.
Investing Activities
For the year ended December 31, 2020, the Corporation incurred $507,926 of expenditures on mineral
property interests.
Financing Activities
For the year ended December 31, 2020, the Corporation received proceeds from private placements and
option exercises of $5,072,765 and made lease payments of $15,441.
- 19 -Management’s Discussion & Analysis
Years Ended December 31, 2020 and 2019
Liquidity and Capital Resources
December 31, December 31,
2020 2019
Cash and cash equivalents $ 4,596,523 $ 1,042,228
Working capital surplus 4,232,105 416,148
Mineral property interests 8,544,276 7,869,265
Total assets 13,403,487 9,475,055
Shareholders' equity 9,312,569 6,764,037
Working capital increased during the year ended December 31, 2020 by $3,815,957. The increase is primarily
attributed to proceeds from the private placement completed in October 2020 offset by the use of funds in the
Corporation’s day-to-day operations.
The Corporation’s total assets increased during 2020 by $3,928,432. The increase was primarily due to the
increase in cash and cash equivalents of $3,554,295 and an increase in mineral property interests of
$675,011 partially offset by a decrease in amounts receivable of $212,340.
RELATED PARTY TRANSACTIONS
The following table reflects the remuneration of key management, which consists of the Corporation’s
directors and executive officers:
Year Ended December 31, 2020 2019
Management salaries and benefits $ 319,884 $ 237,500
Directors' fees - (51,000)
Management services 8,360 -
Share-based payments - Management 44,227 66,209
Share-based payments - Directors 74,932 182,025
$ 447,403 $ 434,734
An employment agreement between the executive team and the Corporation contains a termination without
cause provision. Assuming that all members of the executive team had been terminated without cause on
December 31, 2020, the total amounts payable to the executive team in respect of severance would have
totaled $337,500.
During the years ended December 31, 2020 and 2019, the Corporation had the following related party
transactions with Karora an entity which had significant influence over Orford until July 31, 2020 when Karora
diluted its ownership in Orford:
Exploration and Evaluation Expenses Management Services
Years ended December 31, 2020 2019 2020 2019
Karora $ 108,480 $ 312,568 $ 105,543 $ 330,164
As at December 31, 2020, $nil was payable to Karora (December 31, 2019 - $69,095) and this amount was
included in accounts payable and accrued liabilities.
As at December 31, 2020, Almos Gold Inc. is the holder of 25,865,448 common shares representing a 22.2%
of the Company's outstanding shares.
- 20 -Management’s Discussion & Analysis
Years Ended December 31, 2020 and 2019
CONTRACTUAL COMMITMENTS
The following table summarizes the expected maturity of the Corporation’s significant financial liabilities based
on the remaining period from the balance sheet date to the contractual maturity date:
Less than More than Carrying
1 year 1-3 years 4-5 years 5 years Total Value
Accounts payable and accrued liabilities $ 479,650 $ - $ - $ - $ 479,650 $ 479,650
Lease liability 20,658 8,608 - - 29,266 26,220
$ 500,308 $ 8,608 $ - $ - $ 508,916 $ 505,870
OFF-BALANCE SHEET ARRANGEMENTS
As of the date of this MD&A, the Corporation does not have any off-balance sheet arrangements that have, or
are reasonably likely to have, a current or future effect on the results of operations or financial condition of the
Corporation, including, and without limitation, such considerations as liquidity and capital resources.
OUTSTANDING SHARE DATA
As at April 23, 2021, the Corporation had 116,987,649 common shares issued and outstanding.
As at April 23, 2021, the Corporation had the following securities outstanding, which are exercisable for
common shares:
Weighted Average
Number of Securities Exercise Price
Stock options 7,854,999 $0.21
Warrants 16,239,070 $0.24
CRITICAL ACCOUNTING POLICIES AND ESTIMATES
The preparation of consolidated financial statements in conformity with IFRS requires management to apply
accounting policies and make estimates and assumptions that affect amounts reported in the audited
consolidated financial statements and accompanying notes. There is full disclosure of the Corporation’s critical
accounting policies and accounting estimates in note 2 of the audited consolidated financial statements for the
year ended December 31, 2020.
- 21 -Management’s Discussion & Analysis
Years Ended December 31, 2020 and 2019
RISK FACTORS
The Corporation is subject to a number of risks and uncertainties.
Overview
The Corporation’s business consists of the exploration and development of mineral properties and is subject
to certain risks. The risks described below are not the only risks facing the Corporation and other risks now
unknown to the Corporation may arise or risks now thought to be immaterial may become material. No
guarantee is provided that other factors will not affect the Corporation in the future. Many of these risks are
beyond the control of the Corporation.
COVID - 19
From March 2020 to the date of this MD&A, the world has been marked by the effects of the coronavirus
global outbreak. In response to the outbreak of the COVID - 19 virus, the Québec Government had banned all
non-essential businesses, including mineral exploration province wide until May 11, 2020. The Nunavik region
also banned mineral exploration until August 17, 2020. It is not possible to reliably estimate the length and
severity of these developments and the impact on the financial results, ability to finance, carrying value of
assets and condition of the Corporation in future periods.
Liquidity
As at December 31, 2020, the Corporation had cash and cash equivalents of $4,596,523. Management
estimates that these funds will not be sufficient over the next twelve months to fund the advancement of
exploration properties, cover general and administrative expenses and settle current liabilities. Until such time
that financing becomes available on acceptable terms, the Corporation has taken action to limit the ongoing
exploration and evaluation work and reduce its operating costs. Accordingly, these conditions indicate the
existence of material uncertainties that cast significant doubt upon the Corporation’s ability to continue as a
going concern. The Corporation's ability to continue future operations and fund its exploration, evaluation,
development and acquisition activities is dependent on management's ability to secure additional financing in
the future, which may be completed in a number of ways including, but not limited to, the issuance of debt or
equity instruments, expenditure reductions, or a combination of strategic partnerships, joint venture
arrangements, project debt finance and other capital market alternatives. While management has been
successful in securing financing in the past, there can be no assurance it will be able to do so in the future or
that these sources of funding or initiatives will be available on terms which are acceptable to the Corporation.
Overview of Exploration, Development and Operating Risk
The Corporation is engaged in mineral exploration and development. Mining operations may be subject to
risks and hazards, including environmental hazards, industrial accidents, unusual or unexpected geological
formations, unanticipated metallurgical difficulties, ground control problems, seismic activity, weather events
and flooding. Mining and exploration operations require reliable infrastructure, such as roads, rail, ports, power
sources and transmission facilities and water supplies. Mineral exploration and development is highly
speculative in nature, involves many risks and is frequently not economically successful. Increasing mineral
resources or reserves depends on a number of factors including, among others, the quality of a Corporation’s
management and their geological and technical expertise and the quality of land available for exploration.
Once mineralization is discovered, it may take several years of additional exploration and development until
production is possible, during which time the economic feasibility of production may change. Substantial
expenditures are required to establish proven and probable reserves through drilling or drifting to determine
the optimal metallurgical process and to finance and construct mining and processing facilities. At each stage
of exploration, development, construction and mine operation, various permits and authorizations are
required. Applications for many permits require significant amounts of management time and the expenditure
of substantial capital for engineering, legal, environmental, social, and other activities. At each stage of a
- 22 -Management’s Discussion & Analysis
Years Ended December 31, 2020 and 2019
project’s life, delays may be encountered because of permitting difficulties. Such delays add to the overall cost
of a project and may reduce its economic feasibility. As a result of these uncertainties, there can be no
assurance that these mineral exploration and development programs will result in profitable commercial
production. There is no assurance that any of the projects can be mined profitably. Accordingly, it is not
assured that the Corporation will realize any profits in the short to medium term, if at all. Any profitability in the
future from the business of the Corporation will be dependent upon acquiring, developing, and commercially
mining an economic deposit of minerals.
Companies engaged in mining activities are subject to all of the hazards and risks inherent in exploring for and
developing natural resource projects. These risks and uncertainties include, but are not limited to,
environmental hazards, industrial accidents, labour disputes, social unrest, encountering unusual or
unexpected geological formations or other geological or grade problems, unanticipated metallurgical
characteristics or less than expected mineral recovery, encountering unanticipated ground or water conditions,
cave-ins, pit wall failures, flooding, rock bursts, periodic interruptions due to inclement or hazardous weather
conditions and other acts of God or unfavourable operating conditions and losses. Should any of these risks
or hazards affect the Corporation’s exploration, development or mining activities it may: cause the cost of
exploration, development or production to increase to a point where it would no longer be economic to
produce metal from the Corporation’s mineral resources or reserves; result in a write-down or write-off of the
carrying value of one or more mineral projects; cause delays or stoppage of mining or processing; result in the
destruction of mineral properties, processing facilities or third party facilities necessary to the Corporation’s
operations; cause personal injury or death and related legal liability; or result in the loss of insurance
coverage, any or all of which could have a material adverse effect on the financial condition, results of
operations or cash flows of the Corporation.
Funding Needs, Financing Risks and Dilution
As at December 31, 2020, the Corporation has no history of earnings from operations and, due to the nature
of its business, there can be no assurance that it will be profitable. Development of its properties will require
substantial financing. There is no assurance that such funding will be available to the Corporation, that it will
be obtained on terms favourable to the Corporation or that it will provide the Corporation with sufficient funds
to meet its objectives, which may adversely affect the Corporation’s business and financial position. While
Orford may generate additional working capital through fund raising or through a sale or joint venture, there is
no assurance that any such funds will be available. If available, the terms of such financing may not be
favourable to the Corporation and, if raised by offering equity securities, or securities convertible into equity
securities, any additional financing may involve substantial dilution to existing shareholders. Failure to obtain
any financing necessary for the Corporation’s capital expenditure plans may result in a delay or indefinite
postponement of exploration, development, or production on any or all of the Corporation’s properties, which
may have a material adverse effect on the Corporation’s business, financial condition, and results of
operations.
If the credit and capital markets deteriorate, or if any sudden or rapid destabilization of global economic
conditions occurs, it could have a material adverse effect on the Corporation’s liquidity, ability to raise capital
and costs of capital. If the Corporation experiences difficulty accessing the credit and/or capital markets, the
Corporation may seek alternative financing options, including, but not limited to, streaming transactions,
royalty transactions or the sale of non-core assets. Failure to raise capital when needed or on reasonable
terms may have a material adverse effect on the Corporation’s business, financial condition, and results of
operations.
Uninsurable Risks
In the course of development of mineral properties, certain risks, and in particular, unexpected, or unusual
geological operating conditions including rock bursts, cave-ins, fires, flooding, and earthquakes may occur. It
is not always possible to fully insure against such risks, and the Corporation may decide not to take out
insurance against such risks as a result of high premiums or other reasons. Should such liabilities arise, they
could reduce or eliminate the funds available for acquisition of mineral prospects or exploration, increase
- 23 -Management’s Discussion & Analysis
Years Ended December 31, 2020 and 2019
costs to the Corporation, reduce future profitability, if any, and/or lead to a decline in the value of the Common
Shares.
Environmental and Safety Regulations and Risks
Environmental laws and regulations may affect the operations of the Corporation. These laws and regulations
set various standards regulating certain aspects of health and environmental quality, including air and water
quality, mine reclamation, solid and hazardous waste handling and disposal and the promotion of occupational
health and safety. These laws provide for penalties and other liabilities for the violation of such standards and
establish, in certain circumstances, obligations to rehabilitate current and former facilities and locations where
operations are or were conducted. The permission to operate can be withdrawn temporarily where there is
evidence of serious breaches of health and safety standards, or even permanently in the case of extreme
breaches. Significant liabilities could be imposed on Orford for damages, clean-up costs or penalties in the
event of certain discharges into the environment, environmental damage caused by previous owners of
acquired properties or noncompliance with environmental laws or regulations. To the extent that the
Corporation becomes subject to environmental liabilities, the satisfaction of any such liabilities would reduce
funds otherwise available to the Corporation and could have a material adverse effect on the Corporation. The
Corporation intends to minimize risks by taking steps to ensure compliance with environmental, health and
safety laws and regulations and operating to applicable environmental standards. There is a risk that
environmental laws and regulations may become more onerous, making the Corporation’s operations more
expensive.
Mineral Titles
There is no guarantee that title to the Corporation’s mineral property interests will not be challenged or
impugned, and no assurances can be given that there are no title defects affecting its mineral properties.
Orford’s mineral property interests may be subject to prior unregistered agreements or transfers and title may
be affected by undetected defects. The Corporation has not conducted surveys of the claims in which it holds
direct or indirect interests; therefore, the precise area and location of such items may be in doubt. There may
be valid challenges to the title of the mineral property interests which, if successful, could impair the
exploration, development and/or operations of the Corporation.
Permitting Risks
The Corporation has not received all permits and related authorizations required to exploit, develop, and
operate the West Raglan, Qiqavik and Joutel Projects. The process of permitting involves the filing of a
number of studies and applications with federal and provincial authorities. The Corporation continues to work
through the permitting process. There can be no assurance that all of the necessary permits and approvals
will be forthcoming.
Land Reclamation
Although they vary, depending on location and the governing authority, land reclamation requirements are
generally imposed on mineral exploration companies, as well as companies with mining operations, in order to
minimize long-term effects of land disturbance. Reclamation may include requirements to control dispersion of
potentially deleterious effluents and to reasonably re-establish pre-disturbance land forms and vegetation. In
order to carry out reclamation obligations imposed on the Corporation, the Corporation must allocate financial
resources that might otherwise be spent on other programs.
The Corporation is subject to the risk of litigation, the causes, and costs of which cannot be known
The Corporation may be involved in disputes with other parties in the normal course of business in the future
which may result in litigation. The causes of potential future litigation cannot be known and may arise from,
among other things, business activities, environmental laws, volatility in stock price or failure or alleged failure
to comply with disclosure obligations. The results of litigation cannot be predicted with certainty. If the
Corporation is unable to resolve litigation favourably, either by judicial determination or settlement, it may have
- 24 -You can also read